
Buxfer dropped its free tier and now runs $8 to $21 a month on annual billing. The two features that keep its users on it, multi-currency tracking across 100+ currencies and IOU-style group expenses, both rebuild in Google Sheets, and the Monthly Budget Template is $29 once. The one piece a spreadsheet cannot match is Buxfer's automatic bank sync across 70+ countries.
If you bank in Mumbai and Munich and split rent with a roommate in Toronto, Buxfer is one of the few tools that sees all three at once. That is the cohort it was built for, and it is the audience this post is written for: people whose EUR holiday spend and roommate’s half of the rent both need to land in the same file.
The walkthroughs below cover currencies and shared bills in detail. Recurring rules and forecasts port too, but they port the same way they would for any rules-and-projections app, so they get a shorter treatment near the end.
What the subscription costs
Buxfer dropped its free tier and now runs three paid plans, billed monthly or annually. Annual billing trims roughly 15 to 20 percent off the monthly rate.
| Plan | Monthly billing | Annual billing (per month) |
|---|---|---|
| Plus | $9.99 | $7.99 |
| Pro | $11.99 | $9.99 |
| Prime | $23.99 | $20.99 |
Plus covers bank sync, budgets, automatic tagging, multi-currency, and IOUs. Pro adds forecasts, rules, and favorites. Prime layers in investments, a retirement planner, access control, backups, and API access. Numbers above come from the official pricing page at the time of writing; tiers and prices shift over the years.
The 10-year math on each tier:
| Years | Plus annual ($96/yr) | Pro annual ($120/yr) | Prime annual ($252/yr) |
|---|---|---|---|
| 1 | $96 | $120 | $252 |
| 5 | $480 | $600 | $1,260 |
| 10 | $960 | $1,200 | $2,520 |
| 30 | $2,880 | $3,600 | $7,560 |
A daily user leaning on the forecasts and the international sync gets a lot of feature surface for $120 a year. A user whose habit has thinned to a monthly check-in is paying the same $120 for something a spreadsheet could carry. The renewal date is where that question lands.
Multi-currency: two formulas, one helper tab
Currency support is the Buxfer feature that keeps US-based-but-half-in-EUR households on it. Most spreadsheet-alternative articles wave at this and move on. The full rebuild is a column and two formulas.
A Currency column on the Transactions tab carries the original code (EUR, INR, GBP). A second column holds the home-currency amount, converted at the rate that applied on the transaction date, not today:
=D2 * INDEX(GOOGLEFINANCE("CURRENCY:" & E2 & "USD", "price", A2), 2, 2)D2 is the original amount, E2 the currency code, A2 the transaction date. GOOGLEFINANCE returns a small array for historical rates; INDEX(..., 2, 2) pulls the price out. A EUR coffee bought in December 2025 stays valued at the December 2025 rate when you open the sheet next March.
For households running three or more currencies, a small By currency dashboard tab pulls its weight:
| Currency | Original total | Home-currency equivalent | Share of spending |
|---|---|---|---|
| USD | -3,420 | -3,420 | 62% |
| EUR | -1,180 | -1,290 | 23% |
| INR | -42,000 | -510 | 9% |
| GBP | -240 | -305 | 6% |
Share is =C2 / SUM(C:C). Two SUMIFS lines per row handle the totals. At a glance, you see what proportion of your spend lives in each currency, the question Buxfer answers natively.
Two known gaps:
- GOOGLEFINANCE covers the majors but not every minor currency. PKR, NGN, VND need a manual
Ratestab with monthly snapshots. - Historical rates more than ~5 years back can return blank. A single annual-average per year fills in older data with no real loss of accuracy.
If you are running one or two currencies, this stack is overkill and a single column does the job. The dashboard earns its space at three currencies and up.
Splitting bills without a separate app
The other feature Buxfer users actually stay for. Roommates, couples on partly-shared accounts, friends running a Thursday dinner club: the IOU pattern is genuinely useful, and it lives in one tab.
| Date | Payee | Amount | Paid by | Split with | Per person | A owes B |
|---|---|---|---|---|---|---|
| 2026-07-02 | Costco run | 184.40 | Alex | Alex, Sam | 92.20 | Sam owes Alex 92.20 |
| 2026-07-04 | Brunch | 56.00 | Sam | Alex, Sam | 28.00 | Alex owes Sam 28.00 |
| 2026-07-09 | Internet bill | 70.00 | Alex | Alex, Sam, Jamie | 23.33 | Sam owes Alex 23.33, Jamie owes Alex 23.33 |
Per person is =C2 / (LEN(E2) - LEN(SUBSTITUTE(E2, ",", "")) + 1). The formula counts commas in “Split with” and divides by the number of people. Net balances live below the table:
| Pair | Net | Settled |
|---|---|---|
| Sam -> Alex | $112.20 | No |
| Jamie -> Alex | $23.33 | No |
A pair-totals strip uses SUMIFS to net who owes whom across the month. Settlement is one transfer plus a Yes in the Settled column.
For a stable group (one apartment, one couple), this is fine. For an active group splitting many bills across many people, Splitwise is smoother - the spreadsheet keeps up, the UI does not. The expense-splitting apps roundup covers that comparison if shared bills are a daily thing.
The rest of the surface area
The other Buxfer pieces (categorization, recurring transactions, forecasts) port the same way they would in any rules-and-projections workflow, so the notes below stay short.
Transactions and Rules. One row per transaction with date, payee, category, amount, account, currency. A two-column Rules tab matches payee substrings to categories via INDEX/MATCH. Same pattern as the Lunch Money alternative walkthrough.
Recurring and Forecast. List fixed inflows and outflows with a day-of-month and an amount. The Forecast tab pulls a running balance forward:
=B2 + SUMIFS(Recurring!D:D, Recurring!A:A, DAY(A3))B2 is yesterday’s projected balance, A3 today’s date. Drag down 60 or 90 rows and the balance projects forward, low points visible. A more honest forecast adds an Adhoc tab for one-off known expenses (a flight, a tax bill) and a per-day discretionary subtraction. Without those, the forecast looks rosier than Buxfer’s.
Forecasts in either tool rest on the same assumption: next month looks like a clean version of last month. It occasionally does.
Setup time. From scratch the full stack is around 90 minutes. The Monthly Budget Template covers the base layer for you, a Budget Plan with a target per category, a Transactions log and a Summary, which leaves the currency, shared-expenses, rules and forecast tabs above as the part you build. Ongoing time is 10 to 20 minutes a week, roughly what an active Buxfer user spends correcting categorizations.
What you give up: the global sync
Buxfer’s real edge is automatic bank coverage across more than 20,000 banks in 70+ countries. The spreadsheet does not have that. If you bank in India, Germany, Indonesia, or Brazil and depend on automatic transaction pull, no Google Sheets workflow replaces that connection.
The two workarounds:
- Buy the sync, paste the data. Tiller, Zoho Sheet plug-ins, and paid CSV-to-Sheets bridges exist. They cost money. They mostly cover US and UK banks, less so elsewhere.
- Manual CSV paste, weekly. Most banks worldwide offer CSV export from the web portal. Five to ten minutes a week. Some users find the pause useful, not punitive; others bounce off it within a month.
Neither is a like-for-like replacement for “your accounts, automatically.” That is the one piece a spreadsheet cannot recreate.
A shorter comparison table
The other alt-post articles in this series carry a 12-row capability matrix. For Buxfer that mostly mirrors the others, so the version below keeps only the rows where the answer is meaningfully different.
| Capability | Buxfer | Spreadsheet (DIY or template) |
|---|---|---|
| Cost | $96 to $252 a year | $29 once (template) or your time (DIY) |
| Multi-currency, 3+ codes | Native, automatic | GOOGLEFINANCE + helper tab |
| Group expenses across roommates | Native IOU view | Shared tab + SUMIFS pair-totals |
| Global bank sync (70+ countries) | Yes | No, weekly CSV paste |
| Forecast 30 to 90 days out | Built in, daily updated | SUMIFS on Recurring + Adhoc tabs |
| Setup time | 20 to 40 minutes | 90 minutes from scratch, less when a template carries the budget layer |
Rows you would expect (categorization, data ownership, mobile, works-outside-US) split the same way they do for the other apps in this series, and the Copilot Money alternative walkthrough carries the longer version if you want it.
Where the renewal math points
Two variables determine how much of Buxfer’s surface area you actually use: how many countries your accounts live in, and how often someone else owes you money. The matrix below describes where each tool’s strengths sit, not what to pick.
| One country, solo | One country, shared bills | Two-plus countries, solo | Two-plus countries, shared bills | |
|---|---|---|---|---|
| Light monthly use | Spreadsheet covers it | Spreadsheet, or Splitwise paired with a sheet | Sheet works; Buxfer adds polish | Buxfer’s strongest cohort |
| Active investments and net worth in the same file | Sheet plus a tracker | Sheet plus a tracker | Buxfer Pro folds it in | Buxfer Prime folds it in |
| Daily forecast user | Either tool | Either tool | Buxfer Pro updates passively | Buxfer Pro updates passively |
| Subscription-averse, manual paste accepted | Sheet | Sheet | Sheet, with weekly patience | Sheet, with weekly patience |
The bottom row is where most users who churn off Buxfer end up: one country, light shared bills, manual CSV paste accepted. The top-right cell is the cohort the product was built for. Everything in between is a judgment call about whether automation is worth a recurring spend.
Migrating from Buxfer without losing history
If you want to test the spreadsheet against Buxfer side by side, one month is enough.
- Export transactions from Buxfer as CSV. The full-export option pulls every account and date range.
- Open the Monthly Budget Template and paste the CSV into the Transactions tab, which takes a category, name, date and amount per row. Column order may need one rearrangement.
- Add a Rules tab of your own and fill it from your Buxfer auto-tags. The template does not ship one, and most accounts need 15 to 30 rules to cover recurring payees.
- Tick the Subscription checkbox on each recurring row. The Summary totals those into a subscriptions tile with a monthly figure and an active count. A Recurring tab and a Forecast tab are additions you make.
- Run both tools in parallel for a month. At month-end, compare what each caught.
The data move takes a weekend afternoon. The habit move takes longer.
Templates that fit this
The Monthly Budget Template at $29 is the closest fit for the budgeting half of the Buxfer workflow. It carries a Budget Plan that holds a target and a Need or Want tag per category, a Transactions tab with a Subscription checkbox, a Summary with 50/30/20 and zero-based views, and a Goals sheet. The currency, shared-expenses, rules and forecast tabs described above are ones you add to it.
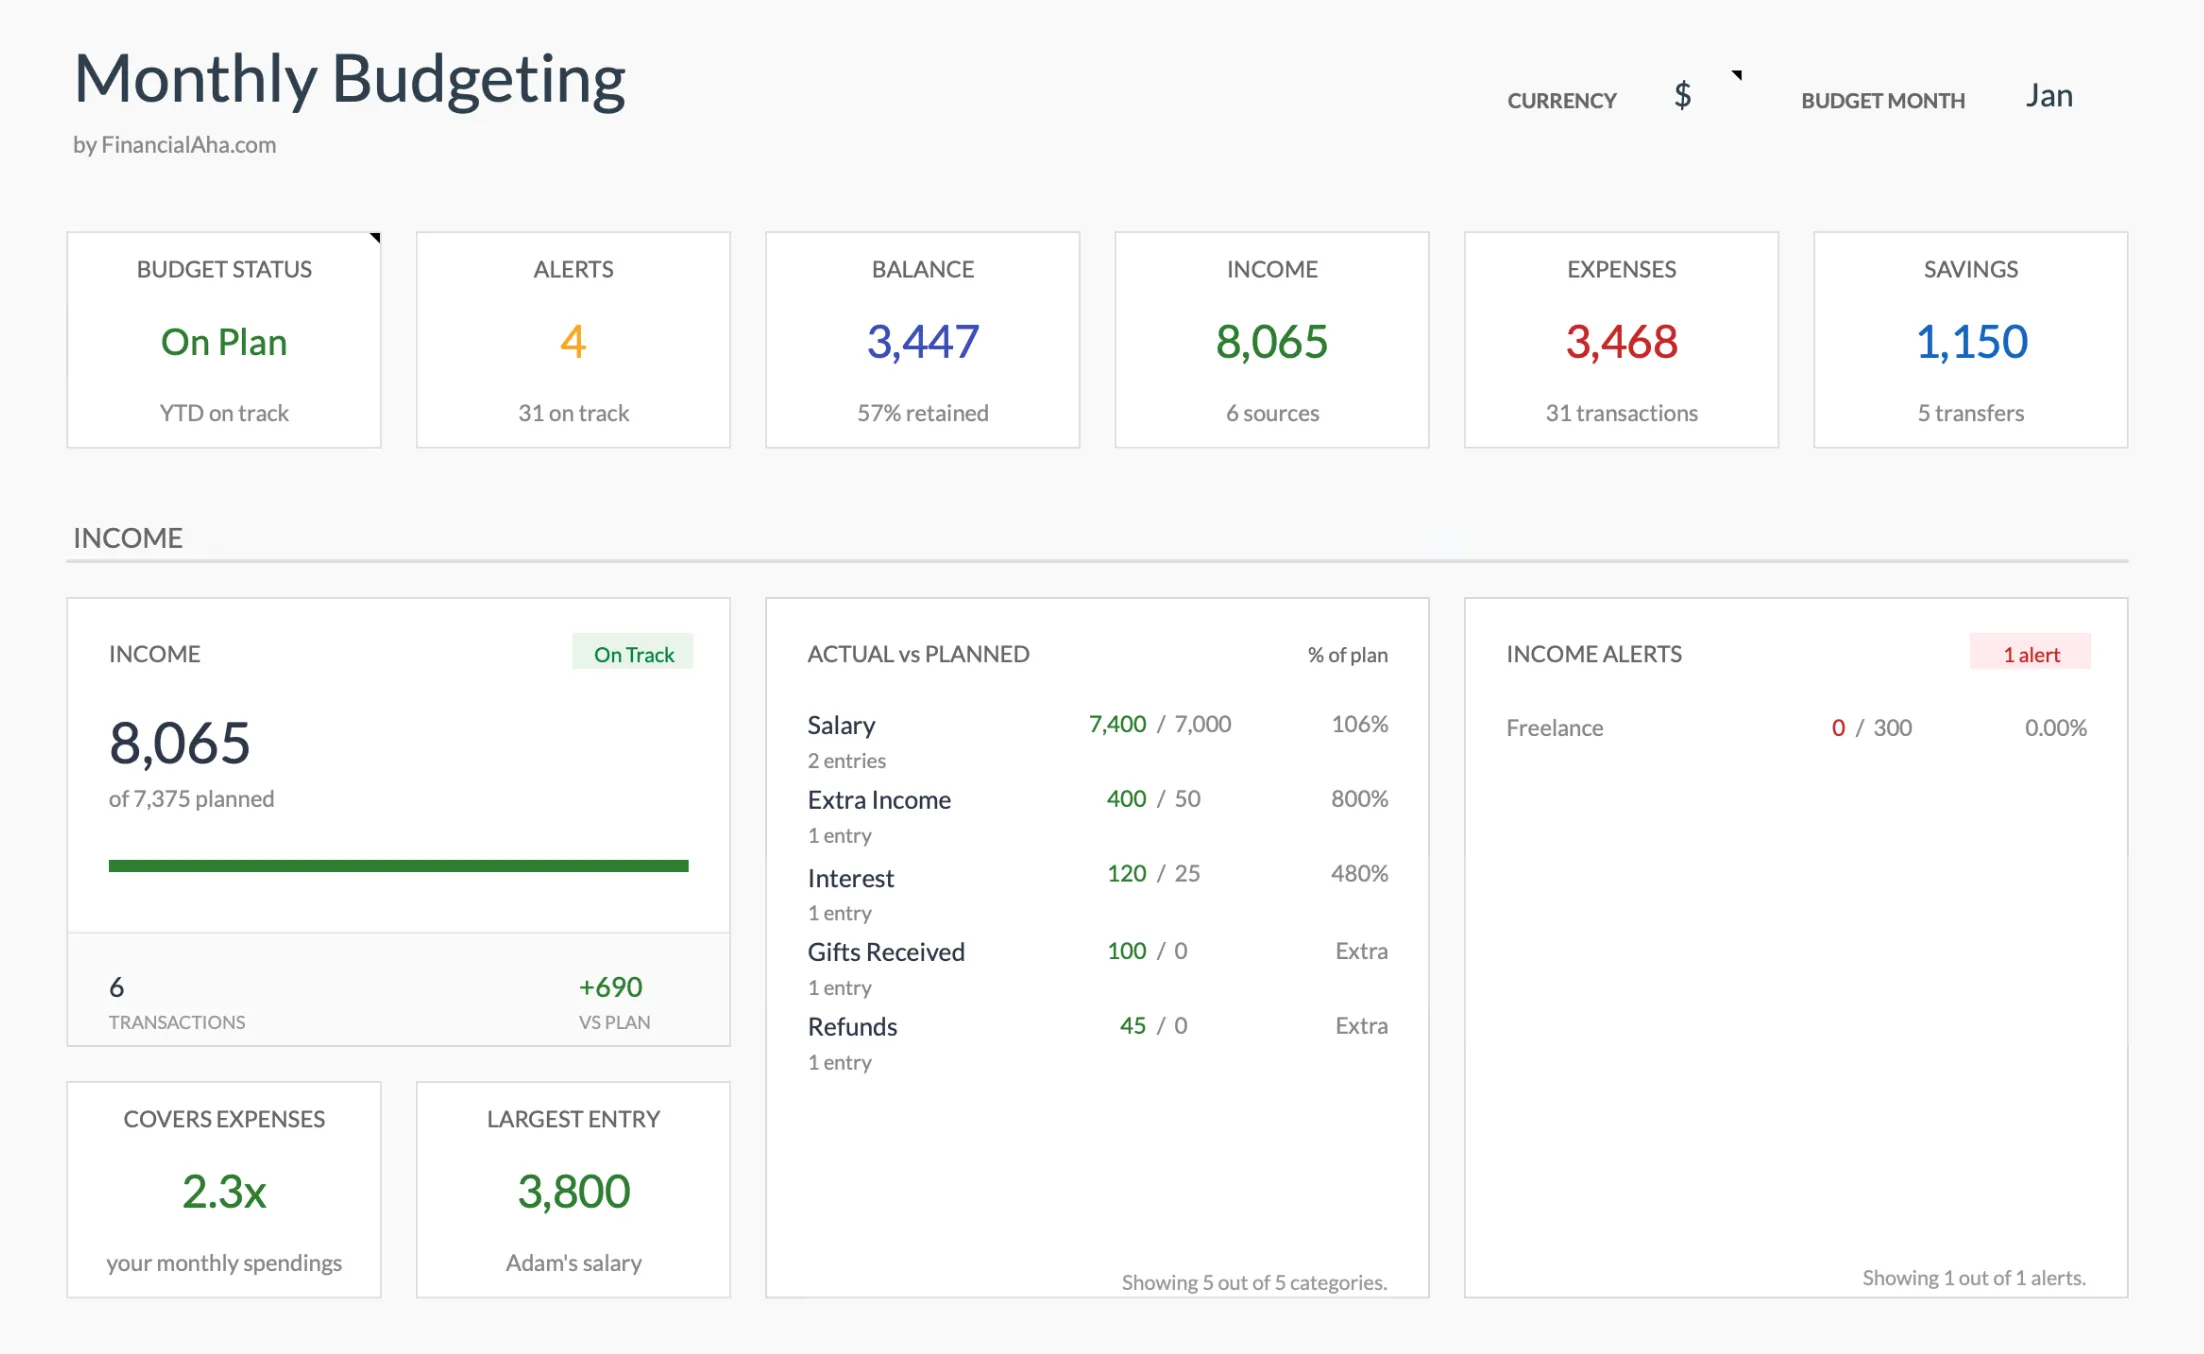
The Monthly Budget Template (Premium tier) dashboard. The currency cell top-right sets the symbol used across the file rather than converting between currencies, and the actual-vs-planned panel compares each category against the target you set for the month.
Two related options if your situation tilts differently:
- The Monthly Expense Tracker at $19 is the simpler starting point - a clean log with category totals, no targets, no forecast. Useful if Buxfer felt heavier than what you actually used.
- The Annual Budget Template at $29 carries all 12 months in one view, closer to the year-long timeline Buxfer puts behind its higher tiers.
All three are Google Sheets templates, one-time purchase, your own copy on your own Drive.
Related
Frequently asked questions
Who uses Buxfer?
Buxfer has a loyal niche of international users (especially in India and Europe) and US users who like the group-expense and forecast features. It supports more international bank connections than most competitors.
Why would I leave Buxfer?
Some users report sync reliability issues, others want lower cost, and some have outgrown the interface design (which has been criticized as dated). The subscription model also irritates users who prefer one-time purchases.
Can a spreadsheet handle multiple currencies?
Yes. A currency column plus GOOGLEFINANCE for conversion rates handles basic multi-currency tracking. For complex multi-currency portfolios, dedicated tools may still win.
What about group expenses (splitting with roommates)?
Sheets handles group expenses through a 'shared expenses' tab with paid-by and owes-by columns. The reconciliation math is straightforward. Apps like Splitwise are more streamlined for active group use, but a spreadsheet works for occasional reconciliation.
Does Buxfer still have a free plan?
No. Buxfer discontinued its free tier and now offers three paid plans (Plus, Pro, Prime) with a 14-day money-back guarantee. A spreadsheet is the closest free-after-purchase alternative for the core budgeting and IOU workflow.
Which Buxfer tier includes investment and retirement tracking?
Investments and the retirement planner sit in the top Prime tier, not Pro. Pro adds forecasts, rules, and favorites on top of Plus; a spreadsheet can carry a simple investment or net-worth tab alongside the budget without a tier change.
Sources
- Buxfer Pricing - Buxfer
- Buxfer - Buxfer
About this article
Buxfer pricing, tier features, currency count, and country coverage checked against the company's published pricing page and homepage. Template sheets, inputs and outputs checked on 2026-09-10 against the shipped Monthly Budgeting Google Sheet (Summary, Budget Plan, Transactions, Goals, Categories, Setup tabs), the Monthly Expense Tracker (Summary, Transactions, Categories) and the Annual Budgeting Planner (Summary, Annual Plan, Annual Financial Goals). Last reviewed September 2026.