Three numbers answer 'how much house can I afford,' and they rarely agree. The 28/36 rule sets a conservative ceiling, the lender's DTI approval runs 15 to 20 points higher, and the true cost of ownership lands below both once maintenance and reserves are in. On a $120,000 income the 28/36 housing ceiling is about $2,800 a month while a 45% lender DTI clears roughly $4,100. A spreadsheet that runs all three from one set of inputs shows the spread instead of hiding it behind the lender's number.
Most affordability calculators give a single answer, and that single number is almost always the lender’s. The lender’s math is the cleanest to code and the most generous to display. Our Home Affordability Calculator starts from the 28/36 limits rather than a lender’s ceiling, and sets 80 and 90 percent of that maximum beside it, so the ceiling is not the only figure on the sheet.
The lender’s number is not optimizing for the borrower’s monthly comfort. It is optimizing for default risk on a mortgage portfolio. Different question, different answer.
The three numbers and why they disagree
The same buyer with the same income and debts can be told they can afford three different homes depending on who is asked.
| Source | What it measures | Typical answer |
|---|---|---|
| 28/36 rule | A budgeting heuristic: housing under 28% of gross, total debt under 36% | Conservative, often the lowest of the three |
| Lender DTI | Risk model: what the loan program will approve | Often 25 to 45% higher than the 28/36 number |
| True cost of ownership | What the home actually costs to run once owned | Lands between the two, often below 28/36 once maintenance is in |
The 28/36 figure comes from decades-old underwriting norms, when housing was cheaper relative to income. The lender DTI figure comes from current loan program guidelines, which allow much higher ratios. The cost-of-ownership figure comes from the actual line items in a homeowner budget - most of which are missing from the lender’s calculation.
Run all three from one set of inputs and the spread becomes the actual question. Some buyers land near the lender ceiling, others closer to the cost-of-ownership floor, with the 28/36 number as a reference between them. The math does not decide; it clears the fog.
To see the shape of it before reading further, our free interactive version takes income, debts, down payment, rate, term, property tax rate and insurance rate, then returns a max home price, a max loan amount, a monthly payment, and where the front-end and back-end ratios land against the 28 and 36 percent limits:
The 28/36 rule and where it came from
The 28/36 rule is two thresholds:
- Front-end ratio: housing costs (principal, interest, property tax, insurance, HOA) under 28% of gross monthly income.
- Back-end ratio: all debt payments combined (housing plus car, student loans, credit cards, etc.) under 36% of gross monthly income.
The rule originated in conventional mortgage underwriting in the 1970s and 1980s, when lenders used it as a hard cap. It is no longer a hard cap at most lenders, but it remains a useful budgeting reference because it bakes in some breathing room.
A worked example, used throughout this article: a household with $120,000 in gross annual income ($10,000/month) and $400/month in existing debt payments. That existing-debt figure is often a car payment, and how much car fits the budget directly shrinks or widens the housing number the rules allow.
| Rule | Calculation | Result |
|---|---|---|
| Front-end (28%) | $10,000 x 28% | $2,800/month for all housing costs |
| Back-end (36%) | $10,000 x 36% - $400 existing debt | $3,200/month for housing |
The binding constraint is the lower of the two, which is the front-end at $2,800. That is the 28/36 ceiling for monthly housing.
Lender DTI and what gets approved
Lenders look at debt-to-income ratios that often run well above 36%. Conventional loans backed by Fannie Mae or Freddie Mac typically allow a back-end DTI up to 45%. Automated underwriting may approve up to 50% with strong compensating factors: high credit score, large reserves, and a low loan-to-value ratio. FHA loans can go higher still - manually underwritten FHA files have been approved with back-end DTI around 50 to 57% in some scenarios.
The same $120,000 household at a 45% back-end DTI:
| Step | Math | Result |
|---|---|---|
| Maximum total debt | $10,000 x 45% | $4,500/month |
| Less existing debt | $4,500 - $400 | $4,100/month available for housing |
That is $4,100/month for housing - 46% higher than the 28/36 ceiling of $2,800.
The lender is not being reckless on a portfolio basis. Default rates at higher DTI bands are manageable in aggregate. For an individual borrower, the $1,300/month gap between $2,800 and $4,100 is the size of a car payment or the line item that absorbs an annual property-tax reassessment. It is real money inside a budget, even if it is not a risk metric on a portfolio.
The framing problem with single-number affordability calculators is right there. The number they show is the approval number, not the comfort number. The two answer different questions, and a buyer is the one who has to decide which one they are asking.
The true cost of ownership
The lender’s monthly payment quote covers PITI - principal, interest, property tax, insurance. The 28/36 rule covers PITI plus HOA. Neither covers what it actually takes to run a home.
The lines that get omitted, with rough monthly ranges for a $500,000 home:
| Line | Why it’s missing from PITI | Typical monthly |
|---|---|---|
| Maintenance | Not a lender concern | $300 to $1,200 |
| HOA dues (where applicable) | Sometimes included, often forgotten | $0 to $800 |
| Utilities (whole-house) | Lenders ignore them | $200 to $500 |
| Lawn / pest / cleaning | Out of scope | $50 to $300 |
| Reserve for capital replacement | Not a monthly bill | $150 to $600 |
The maintenance reserve is the largest hidden line. Common rules of thumb run 1 to 3 percent of home value annually for routine maintenance and capital replacement, with newer homes at the low end and older homes at the high. On a $500,000 home, that is $5,000 to $15,000 per year, or roughly $417 to $1,250 per month smoothed across the year. The Homeowner’s Budget Template breakdown walks through the full category list and the timing problem with annual bills.
Add these lines back to PITI and the “comfortable” affordability figure typically lands 10 to 30 percent below the lender’s number, near the 28/36 ceiling or slightly below it. The math is straightforward; the lender just does not include it.
The worked example: $120,000 household across three metros
Same buyer, same income, same down payment. The differences come from property tax, insurance, and HOA. Assumptions:
- Gross income: $120,000/year, $10,000/month
- Existing debt: $400/month
- Down payment: 20% (so no PMI)
- Mortgage rate: 6.4% (in line with recent 30-year fixed readings in the Freddie Mac Primary Mortgage Market Survey; check the survey for the current figure)
- 30-year fixed
- Homeowners insurance: $1,800/year ($150/month) baseline, adjusted per metro
- Maintenance reserve: 1.5% of home value annually
The variable is property tax rate, which varies enormously by state and county. Three illustrative metros:
| Metro | Property tax rate | Insurance assumption |
|---|---|---|
| Austin, TX (Travis County) | ~1.8% of value | $2,400/year (hail/wind exposure) |
| Phoenix, AZ (Maricopa County) | ~0.6% of value | $1,800/year |
| Newark, NJ (Essex County) | ~2.7% of value | $1,500/year |
Property tax data ranges from the Tax Foundation property tax dataset and county assessor publications; insurance figures are illustrative ranges.
Holding the 28/36 ceiling of $2,800/month for total housing costs constant, the maximum home price shifts by metro:
| Metro | Max home price (28/36 ceiling) | Approximate monthly breakdown |
|---|---|---|
| Phoenix | ~$390,000 | $1,952 P&I, $195 tax, $150 ins, $488 maintenance reserve |
| Austin | ~$335,000 | $1,677 P&I, $503 tax, $200 ins, $419 maintenance reserve |
| Newark | ~$315,000 | $1,576 P&I, $709 tax, $125 ins, $394 maintenance reserve |
Same income, same rule, home prices ranging from $315,000 to $390,000. A $75,000 swing driven almost entirely by property tax. The lender ceiling sits 40 to 50 percent higher in each metro; the cost-of-ownership-aware ceiling lands slightly below the 28/36 number once maintenance is in.
This is the kind of contrast a single-number calculator hides. The Cost of Living Comparison Spreadsheet covers similar metro-level math for households weighing locations.
The down payment question
Down payment percentage shifts the math through three channels:
- Loan-to-value (LTV): Below 80% LTV (20%+ down on conventional), the loan typically clears PMI. PMI runs roughly 0.3 to 1.5 percent of the loan amount annually, adding $100 to $400/month on a typical loan.
- Loan amount: A larger down payment means a smaller mortgage, lower P&I, lower DTI ratios, more headroom for the same home price.
- Reserve liquidity: A bigger down payment means less in liquid reserves for closing costs, the maintenance reserve, and the emergency fund. That trade-off lives outside the affordability formula but inside the comfort calculation.
A worked illustration for the Austin scenario at $335,000:
| Down payment | Loan amount | Monthly P&I | PMI | Total monthly (PITI + maint) |
|---|---|---|---|---|
| 5% ($16,750) | $318,250 | $1,990 | ~$130 | $3,240 |
| 10% ($33,500) | $301,500 | $1,886 | ~$125 | $3,135 |
| 20% ($67,000) | $268,000 | $1,676 | $0 | $2,800 |
Same house, same income. The 5% down household sits above the 28/36 ceiling; the 20% down household sits just below. The 5% household keeps more cash on hand but pays for that liquidity in PMI and a larger monthly carry. Changing the down payment figure in the calculator moves the maximum price, the loan amount and the down payment percentage together, though where PMI starts and stops is set by the lender rather than by the sheet.
Interest rate sensitivity
A one-percentage-point shift in mortgage rates moves monthly P&I on a $300,000 loan by about $200, or roughly $40,000 in home-price affordability at constant monthly payment. Assuming a 20% down payment and roughly $840/month of non-P&I housing costs (tax, insurance, maintenance) inside a $2,800/month ceiling:
| Rate | Monthly P&I on $300K, 30-year | Approximate home price at $2,800/mo total housing |
|---|---|---|
| 5.5% | $1,703 | ~$430,000 |
| 6.5% | $1,896 | ~$385,000 |
| 7.5% | $2,098 | ~$350,000 |
A swing from 5.5 to 7.5 percent reduces the affordable price by roughly 19 percent for the same income and the same rule. Rate environment is the largest single variable in cross-time comparison. For the payment side of that math in detail, the Mortgage Analysis Template runs a full 360-month amortization schedule and compares three rate or term scenarios side by side. The FHFA 2026 conforming loan limit announcement shows national price levels rising 3.26% year over year, but borrower purchasing power moves with rates more than with home-price drift.
How the spreadsheet sizes the number
The input side is short:
- Annual gross income
- Existing monthly debt payments
- Down payment savings (dollar amount)
- Mortgage interest rate and loan term in years
- Property tax rate (or county average)
- Annual home insurance
- Monthly HOA fees
- Front-end and back-end DTI limits, both editable
The output side works from whichever of the two limits binds first. The setup sheet shows the front-end and back-end maximum payments, takes the lower of the two as the housing budget, then turns it into a maximum home price, a maximum loan amount, monthly principal and interest, monthly property tax, and the down payment as a share of price. The dashboard carries those as KPIs alongside 80 percent of the maximum, and the setup sheet lists 90 percent as well. Raising the two limits to a lender’s thresholds re-runs the sheet at the approval number, which is one way to see the gap between the two ceilings. Maintenance and reserves sit outside the calculation, so the cost-of-ownership figure stays separate arithmetic.
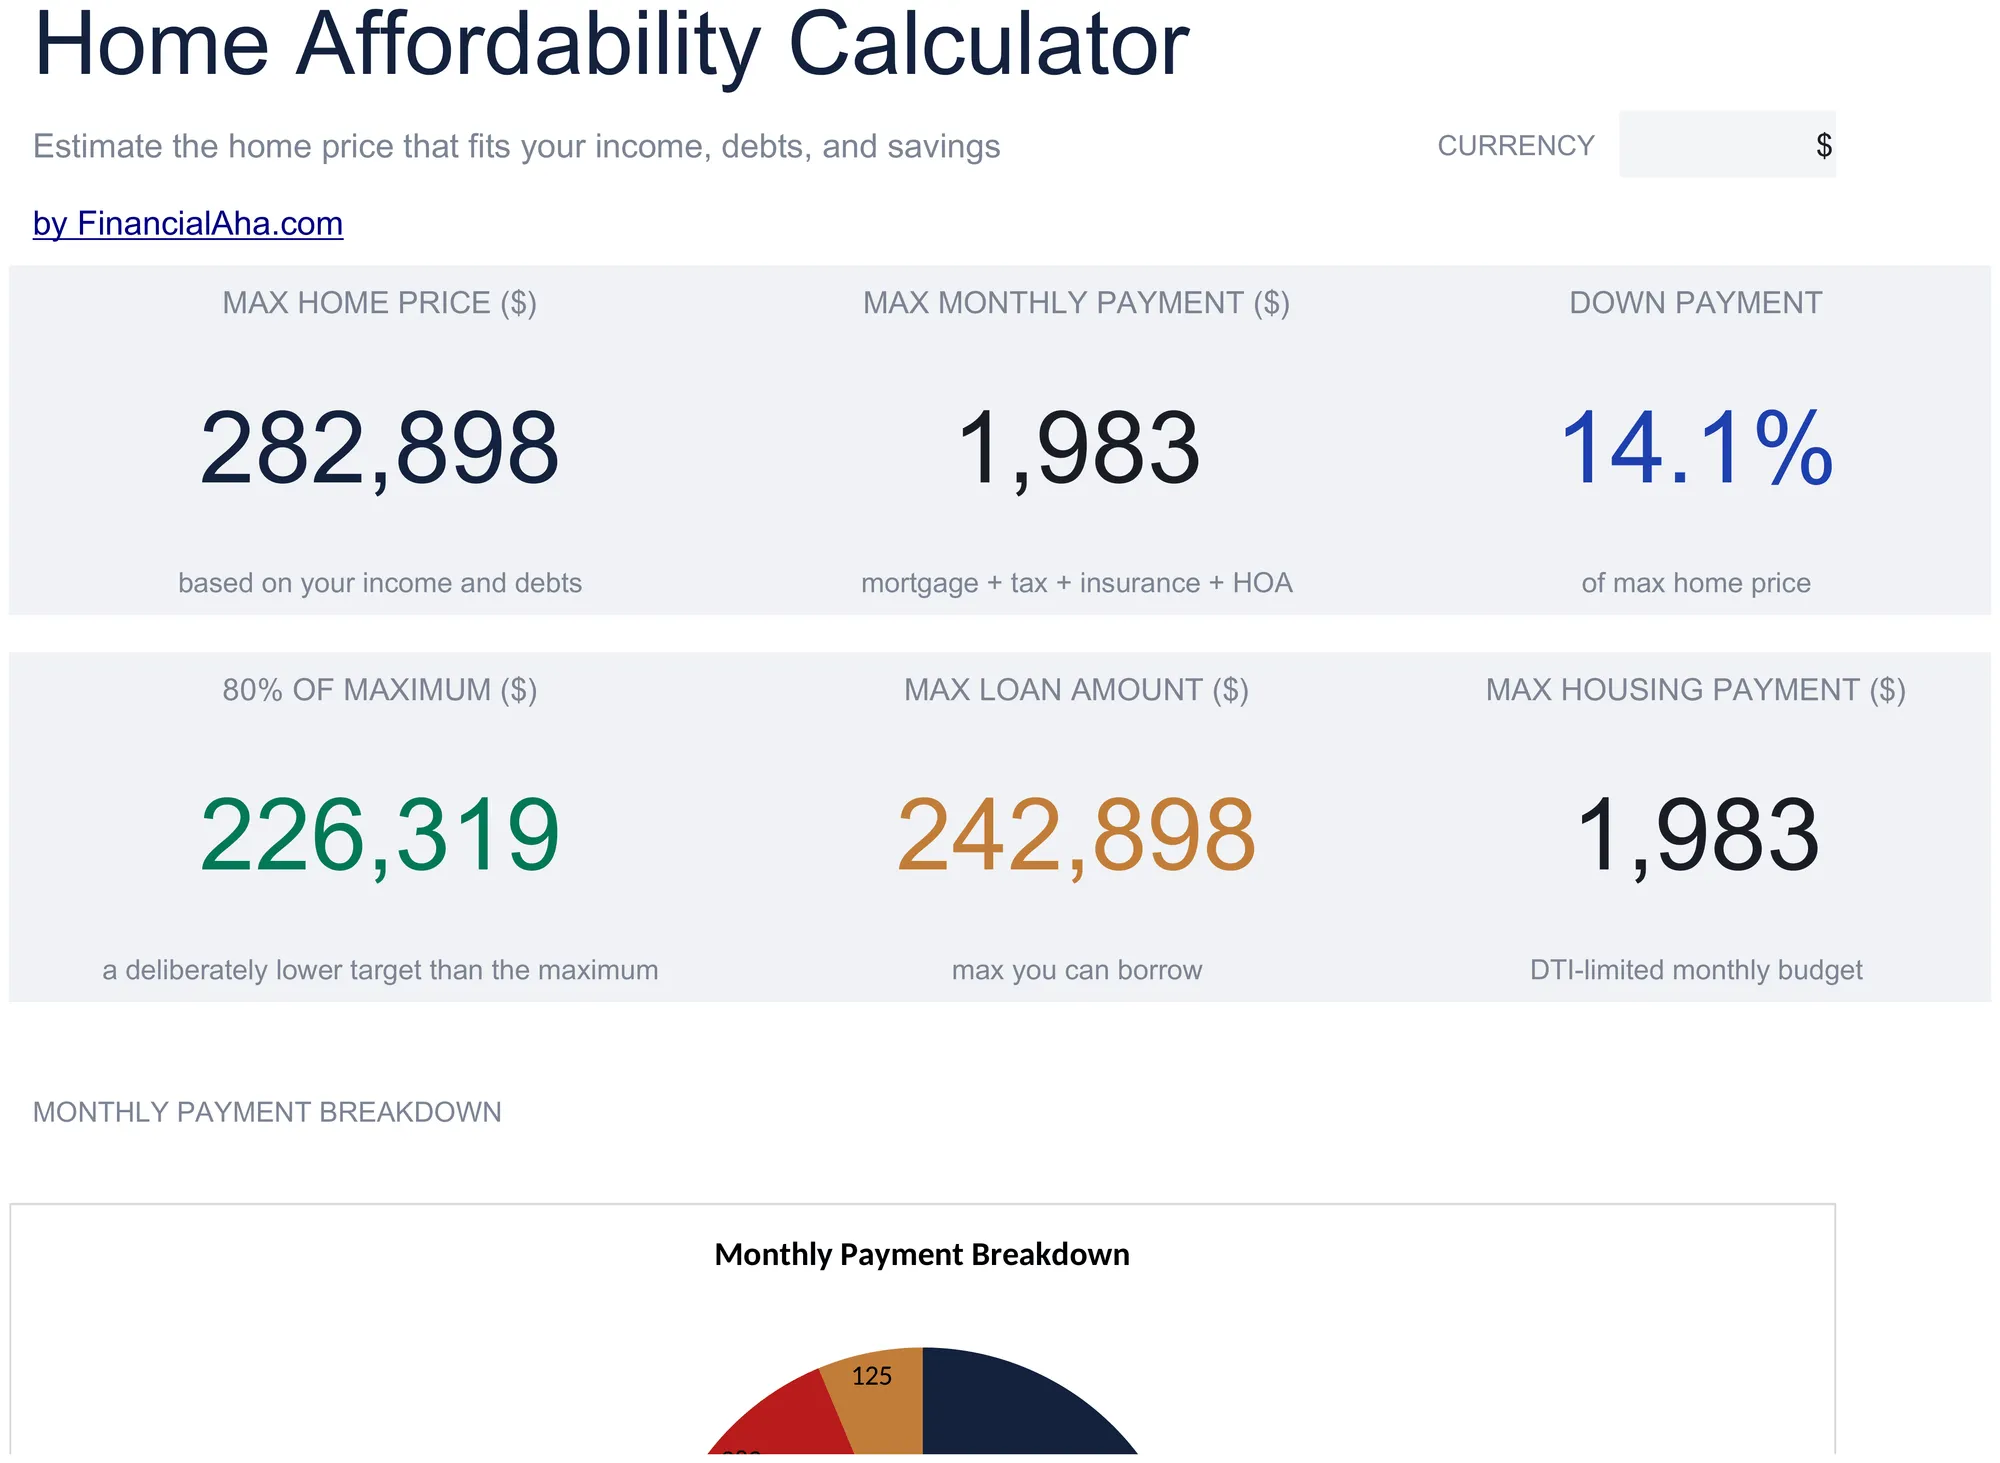
The Home Affordability Calculator (Essentials tier) dashboard: the max figure, a max monthly payment, and a deliberately lower target sit next to each other, with the payment pie split into mortgage, property tax and insurance. HOA is counted in the totals.
Three patterns turn up most often:
- The three numbers cluster within 10 percent of each other - usually a sign of low existing debt and a moderate maintenance assumption. The decision space is narrow.
- The lender number is 30 to 50 percent above the others. Common when income is solid but housing markets are expensive. The household has room to decide where in the band to sit.
- The cost-of-ownership number lands below the 28/36 number. Common for older homes, high-HOA condos, or high property-tax metros. The maintenance reserve is doing real work.
Reading the three together is what the exercise is for. A single number, no matter which one, hides the trade-offs.
When the spreadsheet meets the rest of the financial plan
Home affordability is one input to the larger picture. Down payment funds compete with retirement contributions, emergency reserves, and other goals. A 20% down payment on a $400,000 home is $80,000 in cash no longer available for an index fund position, a Roth IRA, or a business runway. The Financial Planning Template sits one layer up, tracking assets, debts and monthly cash flow against goals for net worth, liquid money and debt-to-income, with a projection that runs to an end year you set.
Renovation costs often surface after affordability is settled. A house at the comfort ceiling with a 10-year-old roof and an HVAC system near end of life carries replacement liabilities a first-year maintenance reserve may not absorb. The Home Renovation Budget Spreadsheet article covers phase-based cost tracking and realistic contingency math for projects above $25,000.
Templates that fit
- “I want the DTI ceiling worked out from my own numbers.” Home Affordability Calculator. Editable front-end and back-end limits, a maximum home price built from the tighter of the two, and 80 and 90 percent of that maximum beside it. Rate, term, property tax, insurance and HOA are inputs rather than assumptions.
- “I want the home decision inside the whole plan.” Financial Planning Template. Monthly cash flow, an assets sheet, a debt sheet and eight goal targets, with a projection to an end year you set; the house sits in it as a real-estate asset and its mortgage as a loan.
- “I want to see the payment and total interest across rate scenarios.” Mortgage Analysis Template. A full 360-month amortization schedule with a three-scenario side-by-side comparison and a total-interest summary.
- “I want a monthly homeowner budget once the house is bought.” The Homeowner’s Budget Template breakdown covers categories and sinking-fund structure for tax, insurance, and maintenance.
Related
Frequently asked questions
What is the 28/36 rule?
A common affordability heuristic: housing costs (PITI) under 28 percent of gross income, total debt payments under 36 percent. It is a starting framework, not a law. Lenders look at debt-to-income ratios that often allow higher percentages.
What does a lender actually approve?
Conventional loans typically allow back-end DTI up to about 43 to 50 percent depending on credit score, reserves, and down payment. FHA can go higher. Approval ceiling is usually well above what most personal-finance frameworks suggest is comfortable.
What costs do the rules miss?
Maintenance (1-3 percent of home value annually), insurance increases, property tax reassessments, HOA special assessments, lawn care, appliance replacement, and the time cost of homeownership. The PITI number understates the true monthly outflow.
Does the lender's maximum mean I can comfortably afford that price?
Not necessarily. The lender's approval is a default-risk number for a mortgage portfolio, not a comfort number for one household's budget. It leaves out maintenance, capital reserves, and whole-house utilities entirely, which is why the cost-of-ownership figure usually lands well below the approval ceiling.
Why can two homes at the same price cost very different amounts each month?
Property tax rates swing from under 0.6 percent of value in low-tax counties to over 2.7 percent in high-tax ones, and insurance varies with local hazard exposure. In the worked example the same $2,800 monthly ceiling buys roughly $390,000 in Phoenix but about $315,000 in Newark, a swing driven almost entirely by property tax.
How does putting less than 20 percent down change the numbers?
Below 20 percent down on a conventional loan the lender typically adds private mortgage insurance, which runs roughly 0.3 to 1.5 percent of the loan amount annually. That is often $100 to $400 a month on top of a larger loan balance, so a smaller down payment keeps more cash on hand but raises the monthly carry.
Sources
- Conforming Loan Limit Values for 2026 - FHFA
- Primary Mortgage Market Survey - Freddie Mac
- Property Taxes by State and County - Tax Foundation
About this article
Loan-limit and year-over-year price figures verified against the FHFA 2026 conforming loan limit release; property-tax ranges cross-checked against the Tax Foundation county dataset; mortgage-rate assumptions referenced to the Freddie Mac Primary Mortgage Market Survey. Template claims checked on 2026-09-10 against the shipped Home Affordability Calculator workbook (Dashboard, Affordability Setup, How to Use), the Mortgage Analysis workbook (Summary, Scenarios, Amortization, Settings) and the Financial Planning workbook (Summary, Goals, Assets, Debt, Cashflow, Projection), plus the on-site Home Affordability Calculator component. Last reviewed September 2026.