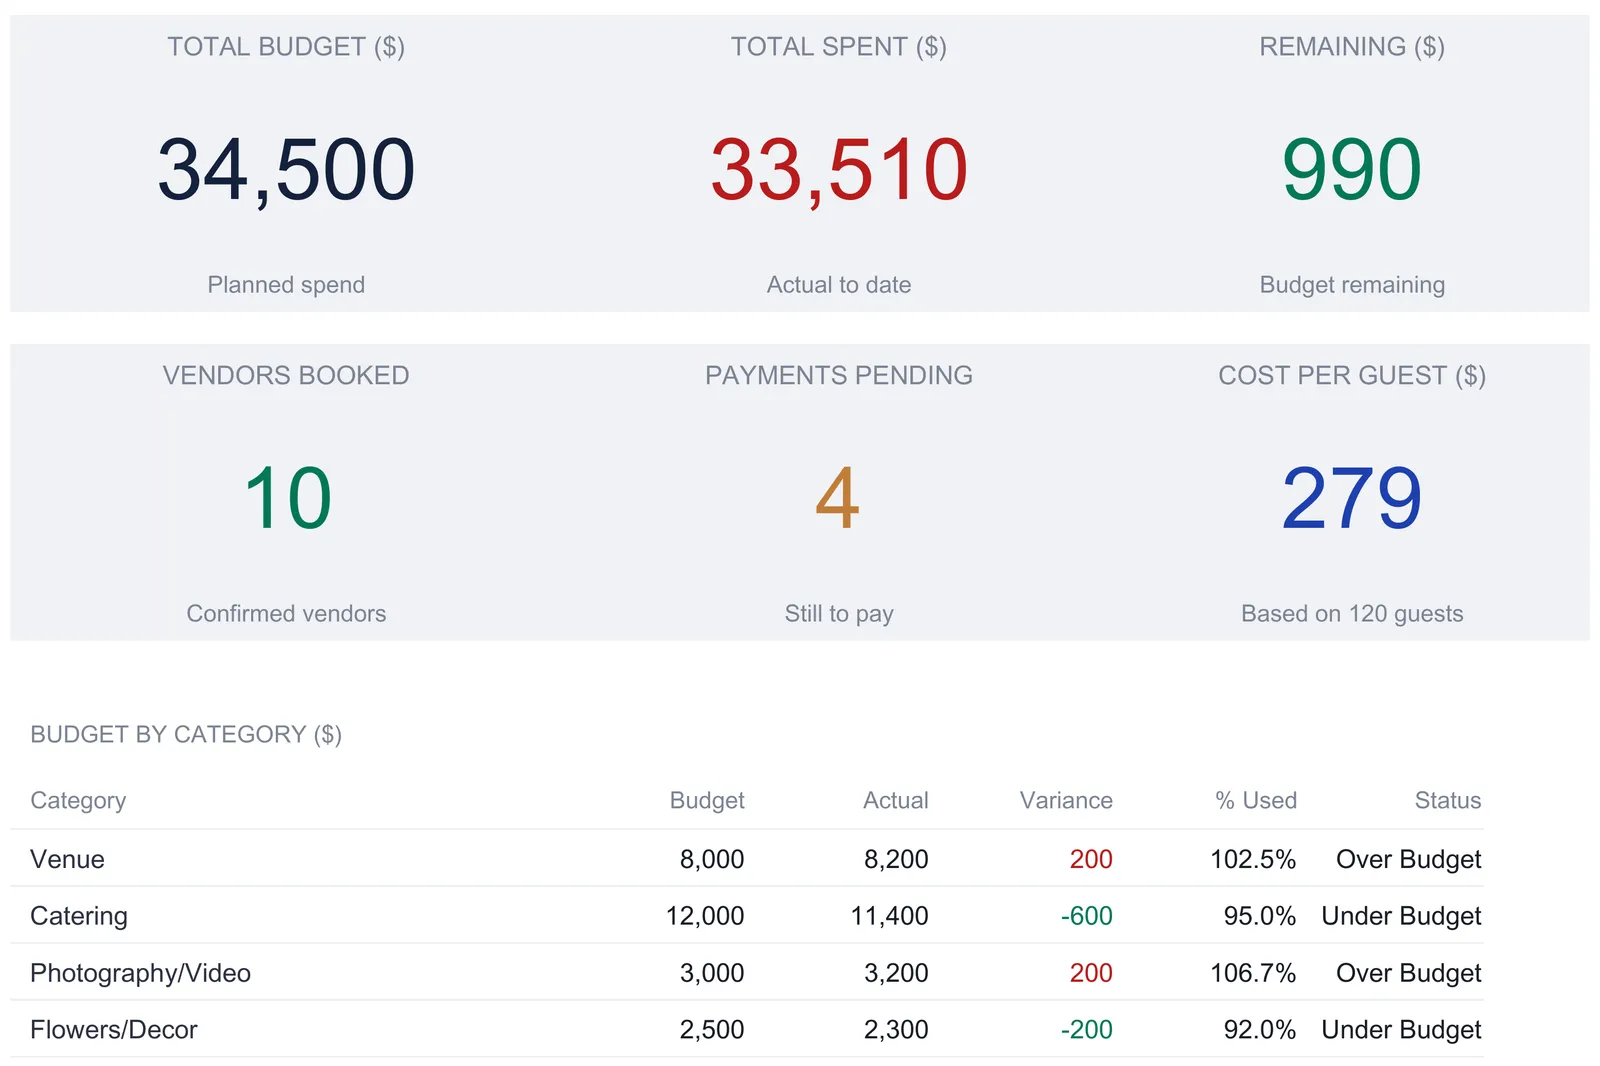
A wedding budget spreadsheet keeps every number in one workbook: 14 planned categories with actual costs beside them, a vendor list with deposits and balances, a dated payment log, a per-guest breakdown, and a dashboard that reads them all back. This walkthrough follows the Wedding Budget Ultimate template ($29) sheet by sheet with a worked sample, a $34,500 plan, $33,510 spent, 10 booked vendors, and a $279 cost per guest, and shows where each figure comes from in Excel and Google Sheets.
A wedding generates a surprising amount of financial data for something that happens in a single day. A dozen or more vendors, each with a deposit at booking and a balance due weeks before the date, sit on top of fourteen or so spending categories that all move at once. Most couples can answer “what has the venue cost so far?” Far fewer can answer “how much of the whole budget is already committed, which categories are running over, and what leaves the account next month?” The difference between those questions is structure, and a spreadsheet handles it well.
That structure is a handful of connected pieces: a planned budget with actual costs beside it, a vendor list that tracks deposits and balances, a dated payment log, a per-guest breakdown, and a dashboard that reads all of it back. The examples below come from our Wedding Budget Ultimate Spreadsheet Template ($29), which ships the whole thing ready-made for Excel and Google Sheets. The layout is reproducible by hand if you would rather build your own, and the sample numbers here are the template’s editable placeholders, not targets to aim at.
What a wedding budget spreadsheet has to hold
Strip away the planning apps and the shared notes, and a wedding budget comes down to a few kinds of data:
- Planned spending by category. What you intend to spend on the venue, catering, photography, and the rest, entered once per category.
- Actual costs. What each category has actually run, sitting right next to the plan so the gap is visible.
- Vendor commitments. Who you have contracted, what they cost, what deposit is down, and what balance is still owed.
- Payment timing. Each payment as a dated line, so the months with heavy outflows are not a surprise.
- Per-guest cost. What the head count drives, both across the whole budget and across the categories that scale with guests.
- A summary. The headline numbers and the category detail on one screen, updating as everything else fills in.
The Wedding Budget Ultimate workbook spreads these across six working sheets, with the plan and the actuals sharing one table. There are seven tabs in all: a Dashboard on top, then Budget Overview, Vendor Tracker, Payment Schedule, Guest Cost Analysis, and Budget vs Actual, with a How to Use sheet carrying the instructions. Everything is formula-driven, with no macros, so the tabs stay in sync without any manual copying between them.
The order you fill it in
The How to Use sheet lays out a working sequence, and it runs opposite to the tab order, from the input sheets up to the Dashboard rather than the other way around. The first step is Budget Overview: set the guest count, then work down the 14 categories entering a budget and an actual for each. As those go in, the variance, % used, and status columns calculate themselves, and the running total at the top climbs with them. From there the vendors get logged in the Vendor Tracker as each one is booked, with the balance owed updating the moment a deposit is entered. Then each payment is recorded in the Payment Schedule with its date, amount, method, and status. Budget vs Actual needs no entry at all, since it reads from what is already there. Guest Cost Analysis is almost the same, with one typed line: Drinks/Bar, which the sheet flags as an entry because it is not its own Budget Overview category. The Dashboard sits at the end of that chain even though it appears first, reflecting every change in real time. Nothing on it is ever typed twice, which is the single habit that keeps a home-built budget from drifting out of agreement with itself.
Start with the plan: the Budget Overview sheet
Budget Overview is where the wedding takes shape as numbers. Two cells sit at the top, and only one of them is an entry. Guest Count is a single figure, 120 in the sample, and it feeds the per-guest math on the other sheets. Above it is Total Budget, which reads $34,500 in the sample, but that cell is worth understanding: it is a running sum of the categories below, labeled “Sum of the categories below,” not a ceiling you type in. The plan is built from the bottom up, category by category, and the total is whatever those lines add to.
Below the inputs is the heart of the sheet, a table of 14 categories. Each row has a budget you enter and an actual you enter, and three columns calculate from them:
- Variance = actual minus budget, so a positive number means over budget and a negative number means under.
- % Used = actual divided by budget.
- Status reads Not Started, Under Budget, On Budget, or Over Budget, based on how the actual compares to the plan.
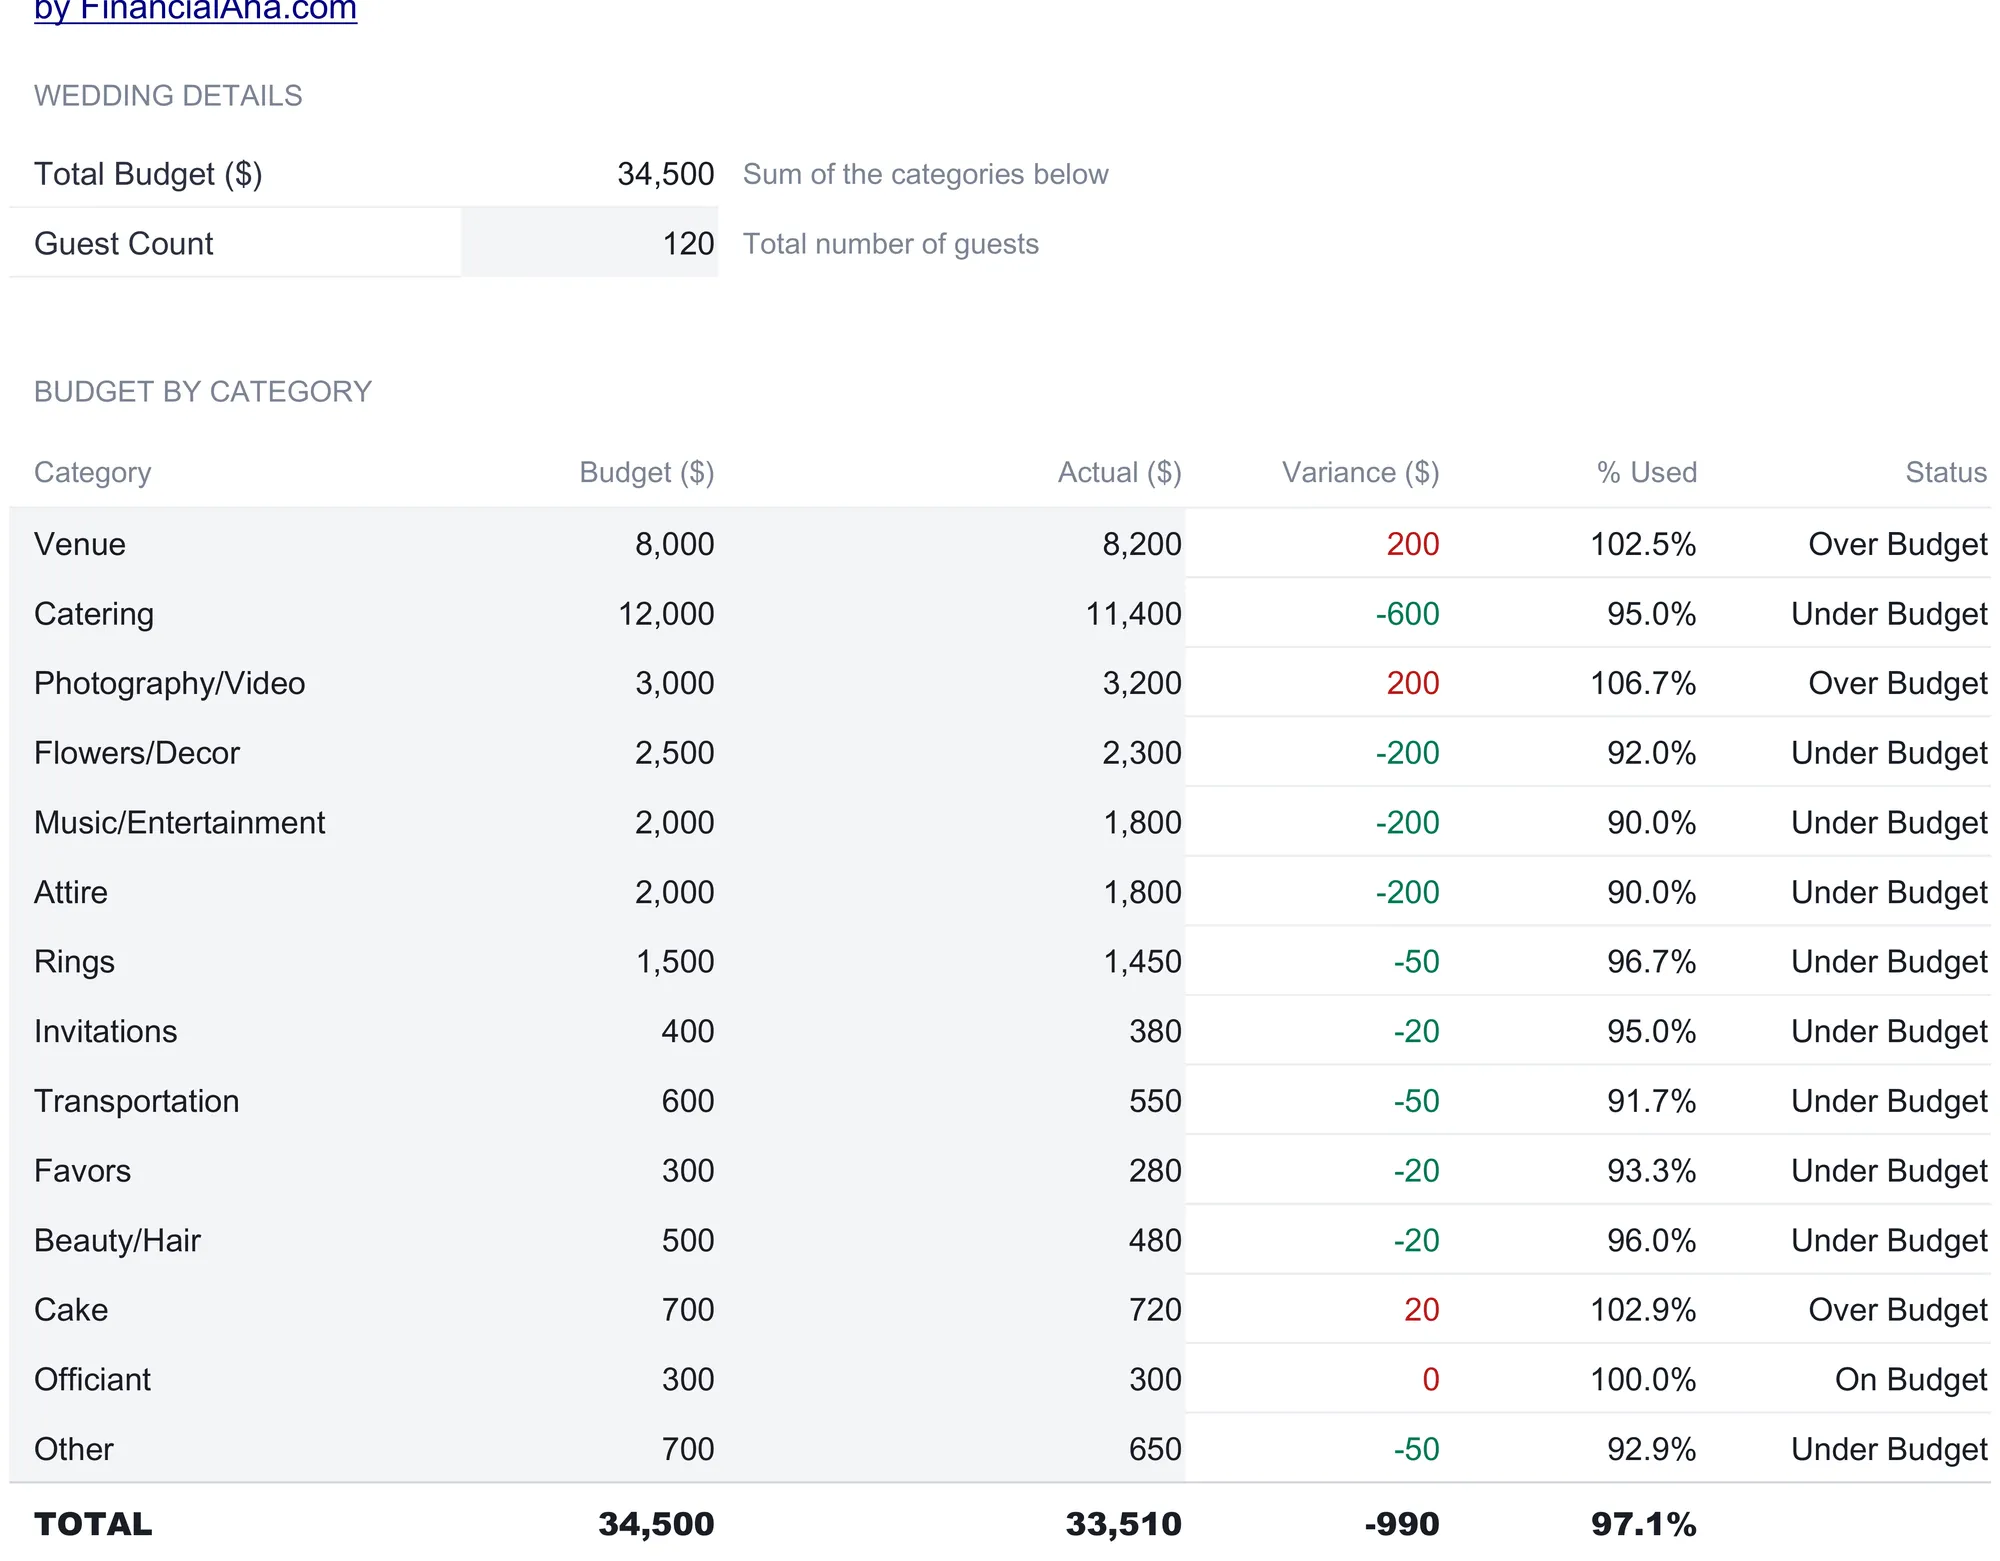
The sample fills the table like this:
| Category | Budget ($) | Actual ($) | Variance ($) | Status |
|---|---|---|---|---|
| Venue | 8,000 | 8,200 | 200 | Over Budget |
| Catering | 12,000 | 11,400 | -600 | Under Budget |
| Photography/Video | 3,000 | 3,200 | 200 | Over Budget |
| Flowers/Decor | 2,500 | 2,300 | -200 | Under Budget |
| Music/Entertainment | 2,000 | 1,800 | -200 | Under Budget |
| Attire | 2,000 | 1,800 | -200 | Under Budget |
| Rings | 1,500 | 1,450 | -50 | Under Budget |
| Invitations | 400 | 380 | -20 | Under Budget |
| Transportation | 600 | 550 | -50 | Under Budget |
| Favors | 300 | 280 | -20 | Under Budget |
| Beauty/Hair | 500 | 480 | -20 | Under Budget |
| Cake | 700 | 720 | 20 | Over Budget |
| Officiant | 300 | 300 | 0 | On Budget |
| Other | 700 | 650 | -50 | Under Budget |
| TOTAL | 34,500 | 33,510 | -990 | 97.1% used |
The total tells one story and the rows tell another, which is the point of keeping both. In aggregate the sample is $990 under plan, at 97.1 percent of budget used. Look down the rows, though, and three categories are over: venue by $200, photography by $200, and cake by $20, while catering came in $600 light. An aggregate that reads comfortably under budget can still hide category-level overruns, and the variance column is what surfaces them one line at a time. Catering carrying the biggest single number, at $12,000 planned, means a small percentage swing there moves the total more than a full overrun on favors ever could.
The tinted cells are the ones you fill in; the white cells are formulas. All 14 category rows arrive named, so reworking the list is a rename rather than an append. Change a label here and the Dashboard table picks the new name up, because every line of that table reads its category straight from this sheet. The variance sheet keeps its own typed labels but pulls the planned and actual figures across, so the numbers stay in step either way.
Track who you have booked: the Vendor Tracker
Budget Overview thinks in categories. Vendor Tracker thinks in contracts. This is where each vendor gets a row with their total cost, the deposit already paid, a due date, a booking status, contact details, and a notes field. One column calculates: Balance Due is total cost minus deposit paid, so it shows exactly what is still owed to each vendor the moment a deposit goes in.
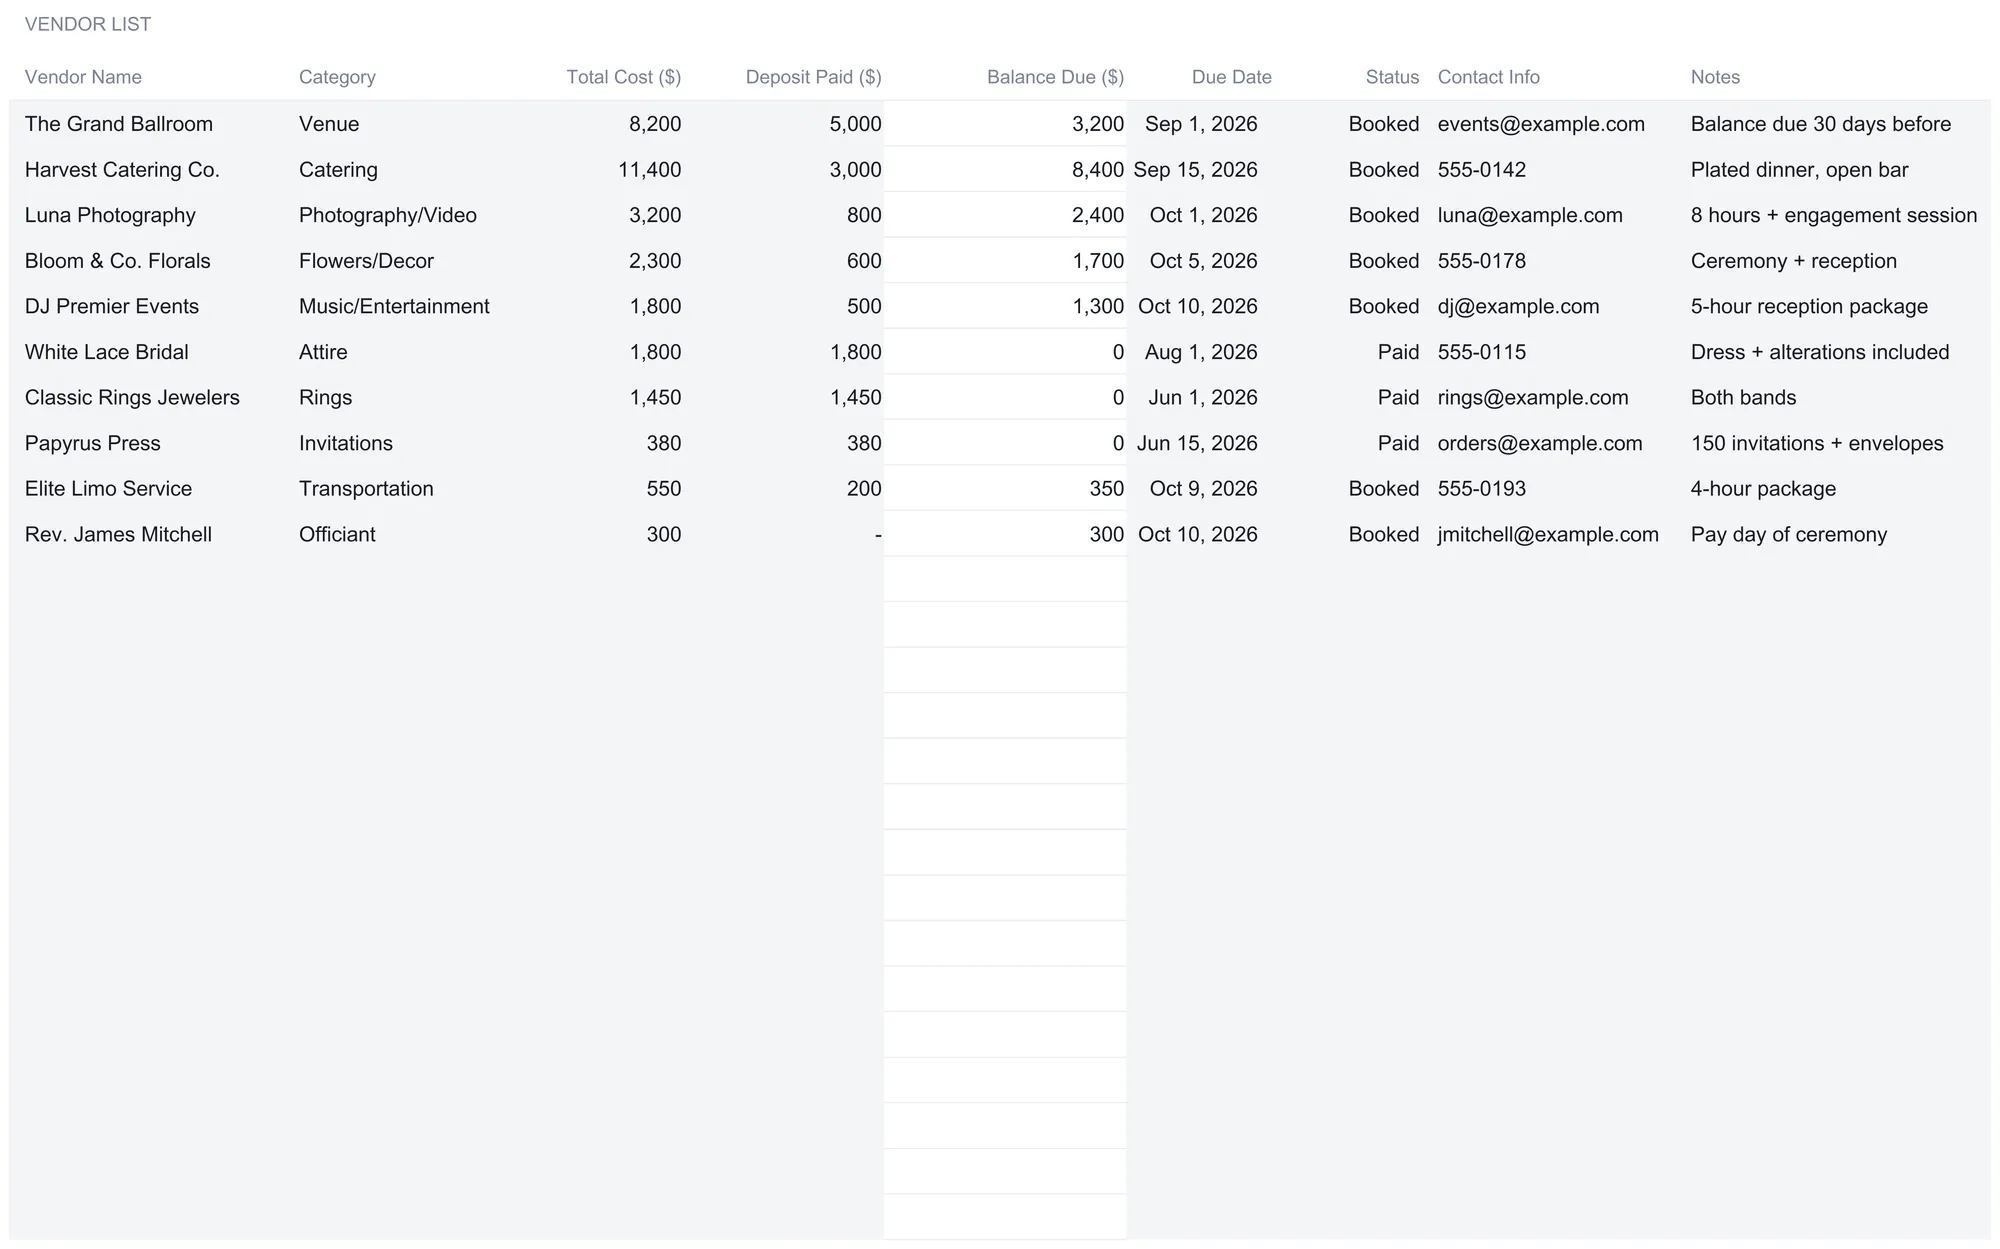
The sample logs 10 vendors, from The Grand Ballroom at $8,200 with a $5,000 deposit down and $3,200 still owed, to Rev. James Mitchell at $300 with nothing paid yet and the note “Pay day of ceremony.” Each vendor carries a status from a dropdown: Booked, Pending, Paid, or Cancelled. In the sample, seven are Booked and three are Paid, the three whose balance has reached zero, White Lace Bridal, Classic Rings Jewelers, and Papyrus Press.
At the bottom, a Summary by Status block rolls the list up with COUNTIF and SUMIF, so the numbers move as statuses change:
| Status | Vendors | Total Value ($) | Deposits Paid ($) | Balance Remaining ($) |
|---|---|---|---|---|
| Booked | 7 | 27,750 | 10,100 | 17,650 |
| Pending | 0 | 0 | 0 | 0 |
| Paid | 3 | 3,630 | 3,630 | 0 |
Across all rows the tracker totals $31,380 in vendor cost, $13,730 in deposits paid, and $17,650 in balances still due. That vendor total of $31,380 is deliberately not the same as the $33,510 actual on Budget Overview. The gap of $2,130 is the four sample categories that have no vendor line, cake, favors, beauty and hair, and other, which together come to exactly that. It is a useful thing to see rather than a bug: not every dollar of a wedding goes to a contracted vendor, and the two sheets are meant to be independent tallies rather than mirror images. The tracker has room for up to 40 vendors, and the spare rows are already wired into the total and the summary.
Schedule the outflows: the Payment Schedule
A wedding budget that only shows totals hides the part that stresses a bank account most: the timing. Deposits land months ahead, balances cluster in the final weeks, and the same vendor often appears two or three times. The Payment Schedule is a dated log built for exactly that. Each row is one payment, with a date, the vendor, the amount, the method, a status, and a note.
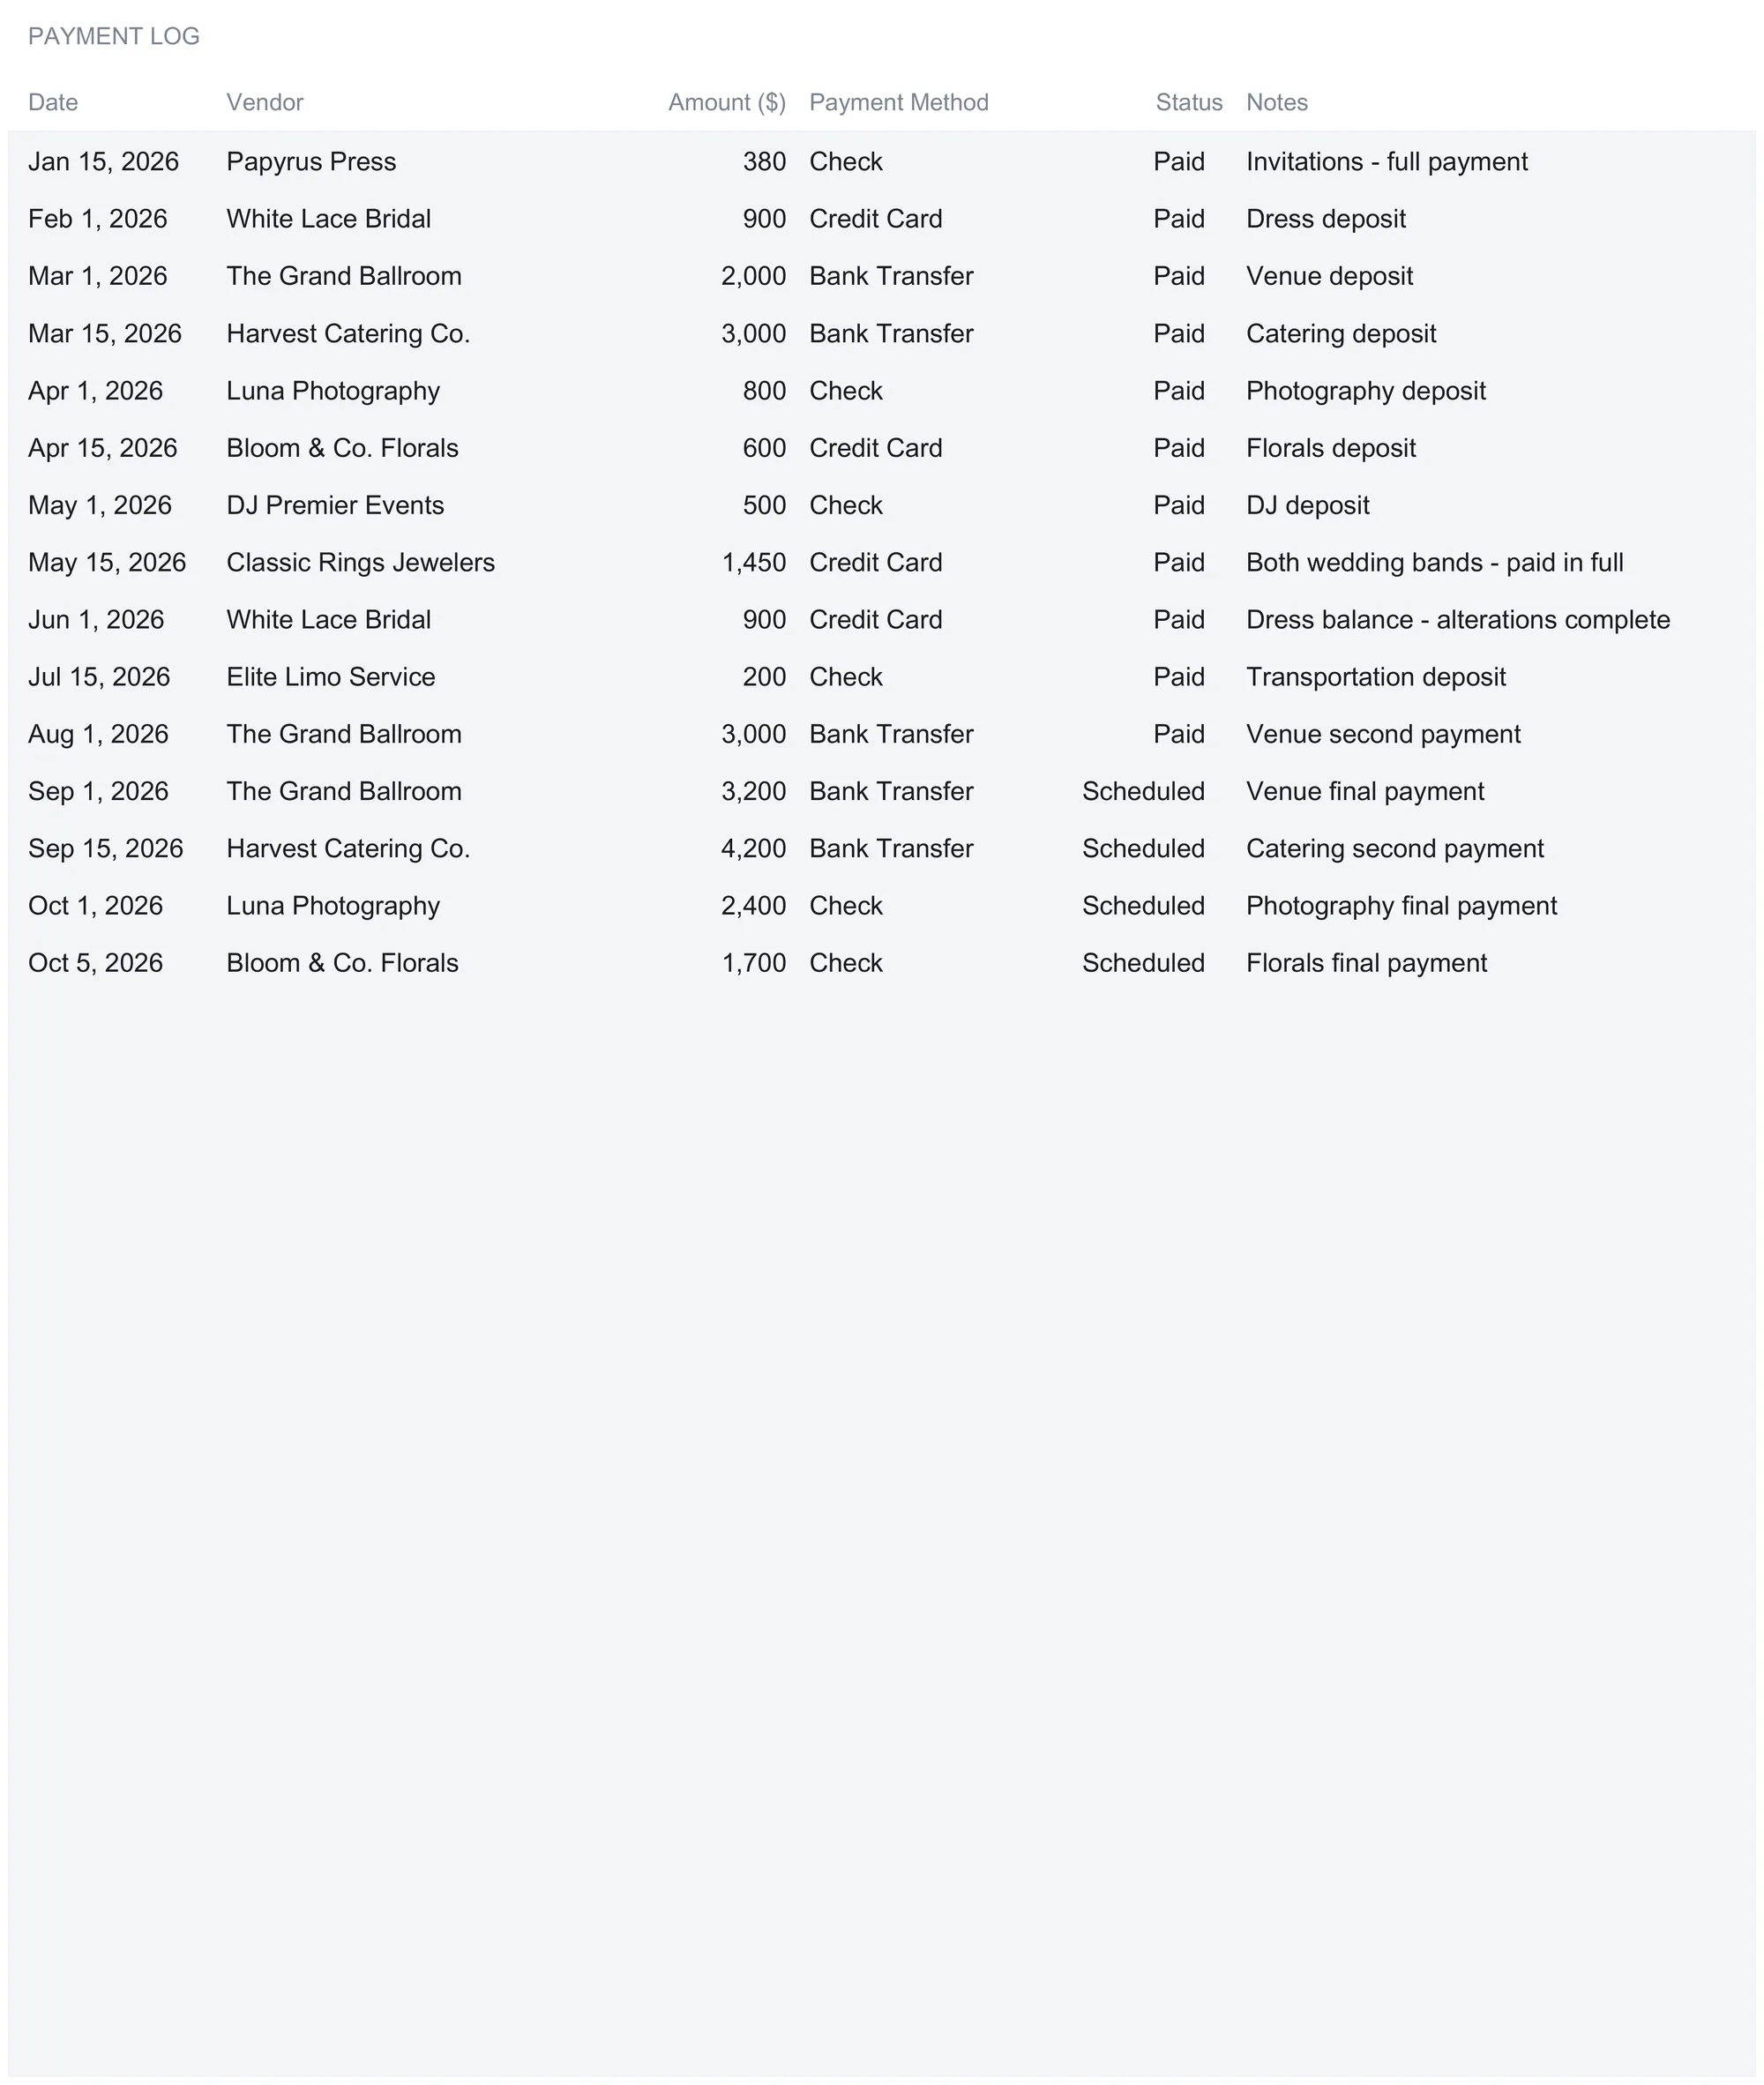
The sample runs 15 payments across the year, and reading them in order shows the shape of the spend. It opens with a $380 check to Papyrus Press for invitations in January, moves through a string of vendor deposits in the spring paid by check, credit card, and bank transfer, and then loads up in the autumn: the venue’s $3,200 final payment on September 1, a $4,200 catering payment on September 15, a $2,400 photography balance on October 1, and a $1,700 florals balance on October 5. Every row also carries a status from a Paid, Scheduled, or Overdue dropdown, and a Payment Totals by Status block at the bottom uses COUNTIF and SUMIF to summarize:
| Status | Count | Total Amount ($) |
|---|---|---|
| Paid | 11 | 13,730 |
| Scheduled | 4 | 11,500 |
| Overdue | 0 | 0 |
Two things tie the sheets together here. The $13,730 already paid matches the deposits-paid total on the Vendor Tracker to the dollar, because the deposits logged as vendor payments are the same money. And the four Scheduled payments, worth $11,500, are the near-term outflows still ahead, the number a couple watching cash flow in the final months actually cares about. The log holds up to 50 payment rows, so a wedding with more staggered payments than the sample has plenty of room. This kind of dated tracking is the mechanical side of the general budgeting habit the Consumer Financial Protection Bureau describes in its guide to creating a budget and sticking with it: write the outflows down before they arrive rather than reconstruct them after.
Break it down by head: the Guest Cost Analysis
Guest count drives more of a wedding budget than any other single number, and the Guest Cost Analysis sheet is where that leverage becomes visible. Its guest count is not typed here; it pulls from Budget Overview, so the 120 in the sample is the same 120, and changing it in one place recalculates every per-guest figure on this sheet.
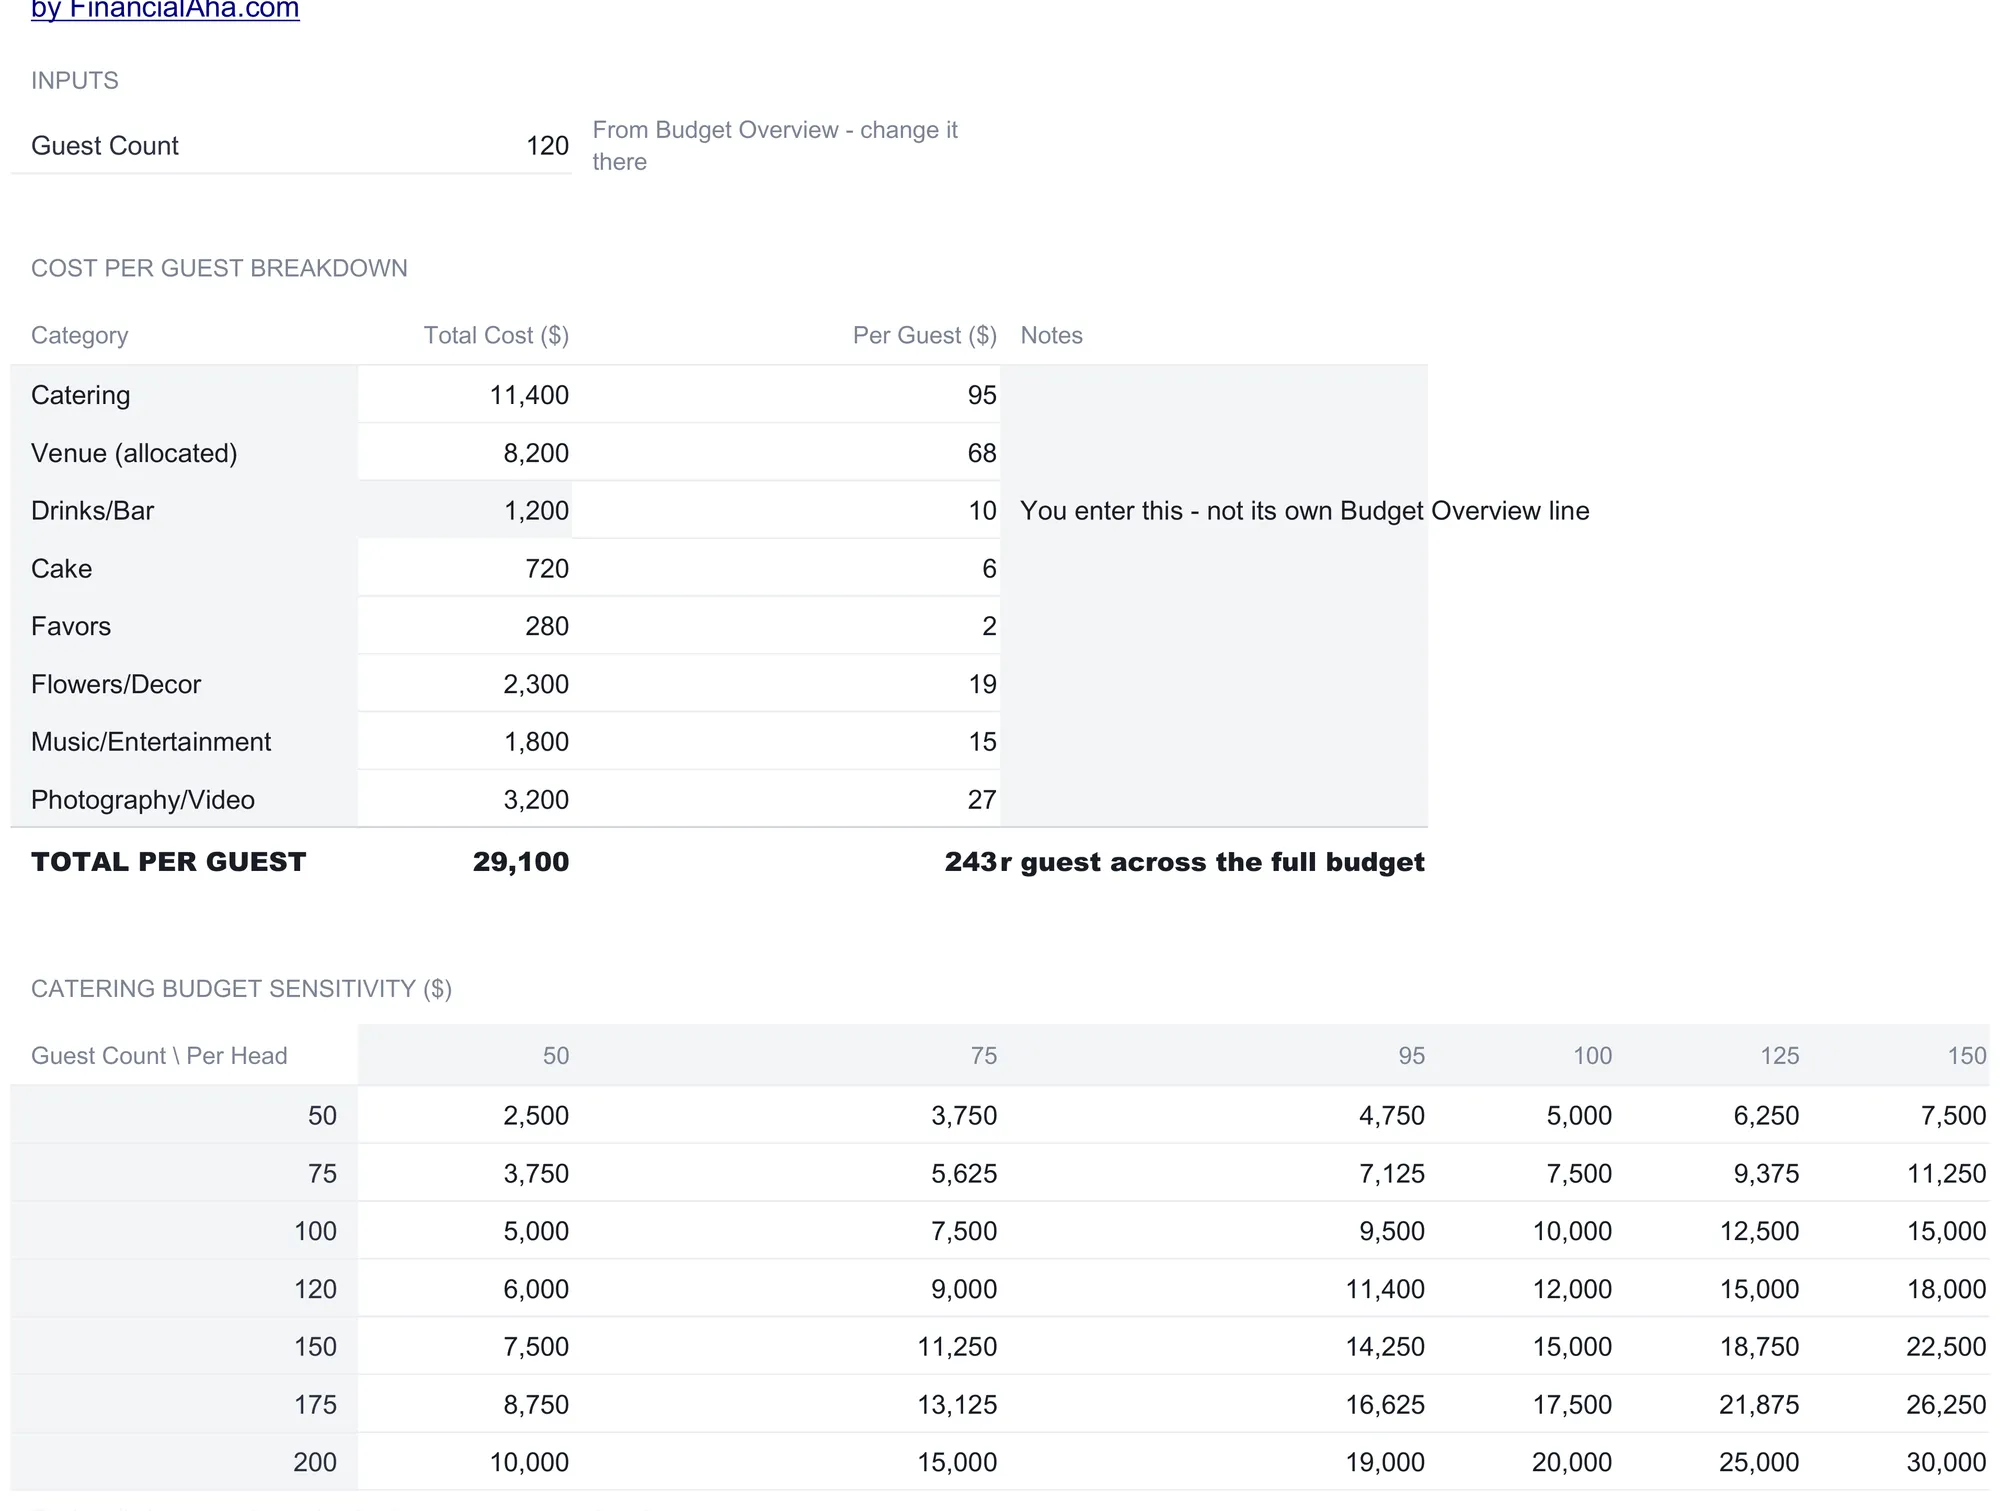
The top block is a per-guest cost breakdown for the categories that scale with the head count. Each line takes a category’s actual cost and divides by the guest count, rounded to the dollar:
| Category | Total Cost ($) | Per Guest ($) |
|---|---|---|
| Catering | 11,400 | 95 |
| Venue (allocated) | 8,200 | 68 |
| Drinks/Bar | 1,200 | 10 |
| Cake | 720 | 6 |
| Favors | 280 | 2 |
| Flowers/Decor | 2,300 | 19 |
| Music/Entertainment | 1,800 | 15 |
| Photography/Video | 3,200 | 27 |
| TOTAL PER GUEST | 29,100 | 243 |
Most of these figures pull straight from Budget Overview, with one exception worth flagging: Drinks/Bar, at $1,200, is entered directly on this sheet because it is not its own Budget Overview category. The block sums to $29,100 of guest-scaling spend, or $243 a head. That is a different number from the $279 cost-per-guest tile on the Dashboard, and the difference is not an error. The FAQ below walks through it, but in short, $243 counts only the lines that move with the guest list, while $279 spreads the entire $33,510 across the same 120 guests, fixed costs included.
Below the breakdown is a sensitivity grid, the most useful part of the sheet for anyone still deciding on a guest list. It lays guest counts from 50 to 200 down the side and per-head catering prices from $50 to $150 across the top, and each cell shows the total catering cost as guests × per-head. The sample’s own case sits inside it: 120 guests at $95 a head reads $11,400, the exact catering actual. Reading across a row shows what a richer menu costs at a fixed head count; reading down a column shows what trimming or padding the list does at a fixed per-plate price. At the corners, 50 guests at $50 is $2,500 while 200 guests at $150 is $30,000, a twelvefold spread driven by two inputs.
Compare plan against reality: the Budget vs Actual sheet
Budget vs Actual is the variance view on its own dedicated sheet. It mirrors the 14 categories from Budget Overview, pulling planned and actual figures straight across so there is nothing to re-enter, and computes the variance for each line and for the total.
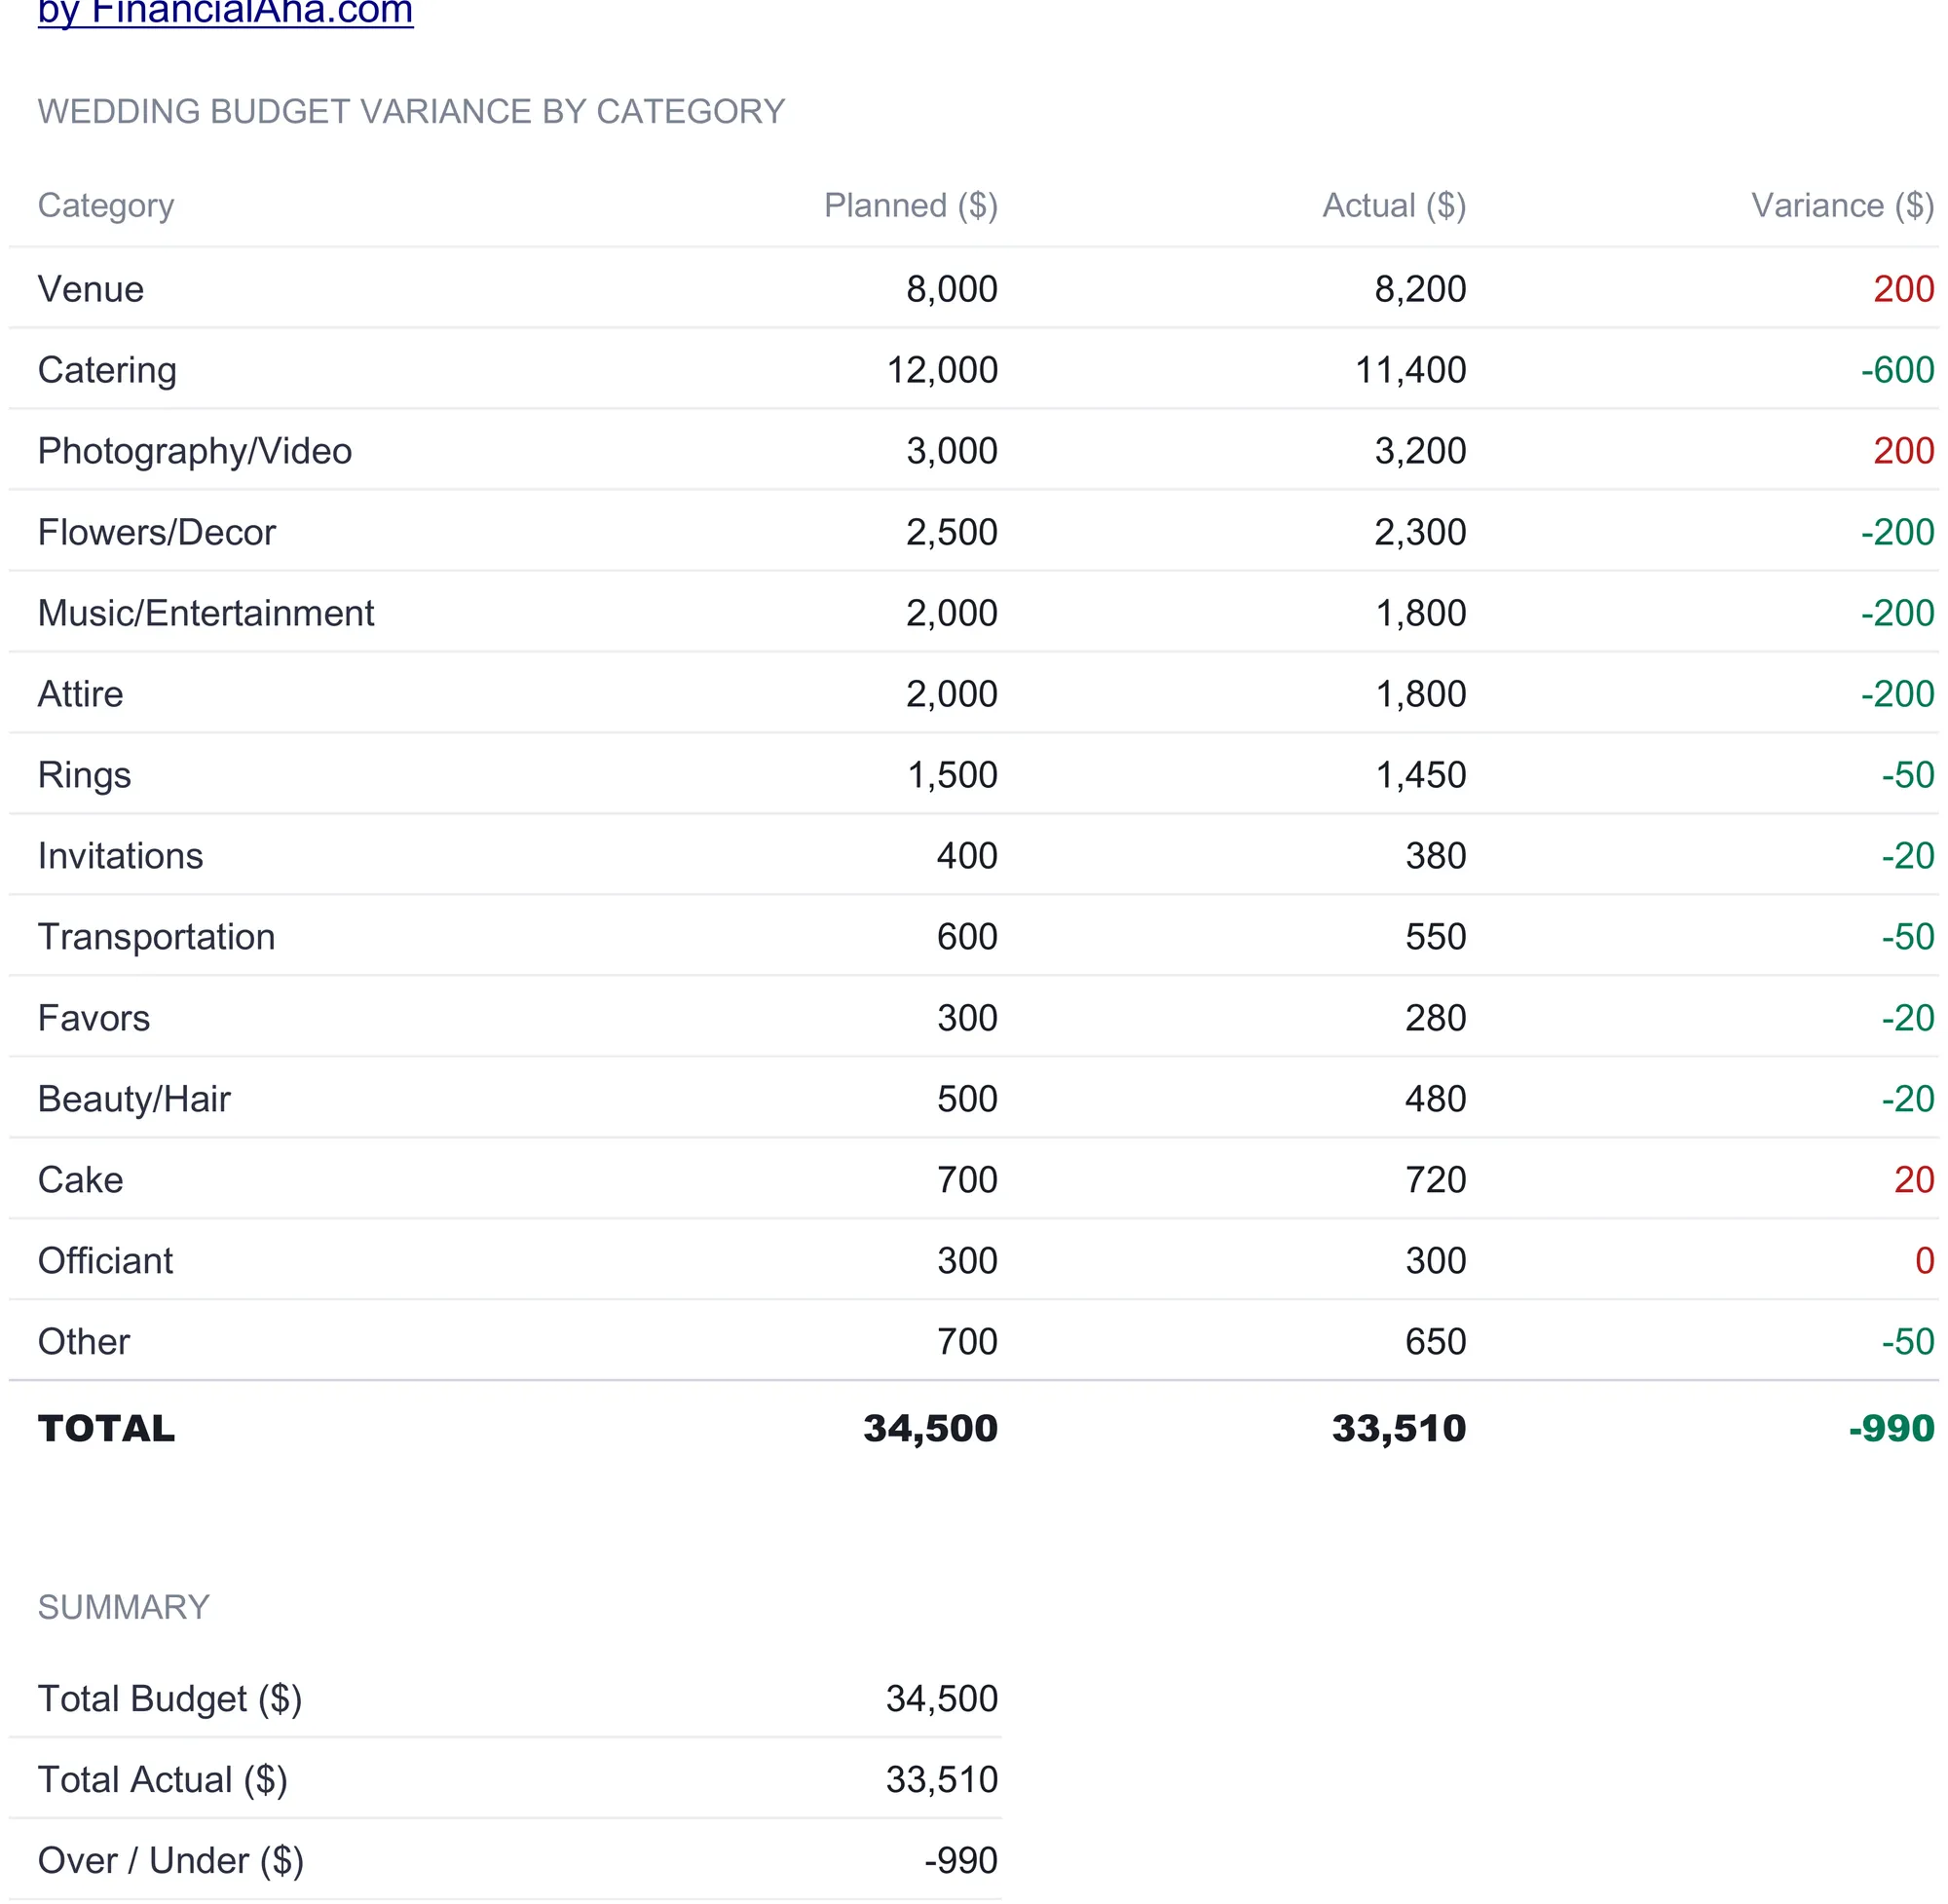
The totals land where Budget Overview said they would: $34,500 planned, $33,510 actual, and a variance of -$990. A small summary block underneath restates it as Total Budget, Total Actual, and Over / Under, so the bottom line reads in one place. Positive variances show red for over budget and negative variances show green for under, which is why the sample’s mostly green column, broken by red on venue, photography, and cake, tells the story at a glance.
Having variance on its own sheet, separate from the data-entry table on Budget Overview, is a deliberate split. Budget Overview is the working surface where numbers get typed and edited; Budget vs Actual is a clean derived comparison you can scan or print without the input columns in the way. Both show the same truth because both draw from the same source rows, so they cannot drift apart.
The Dashboard: six numbers and two charts
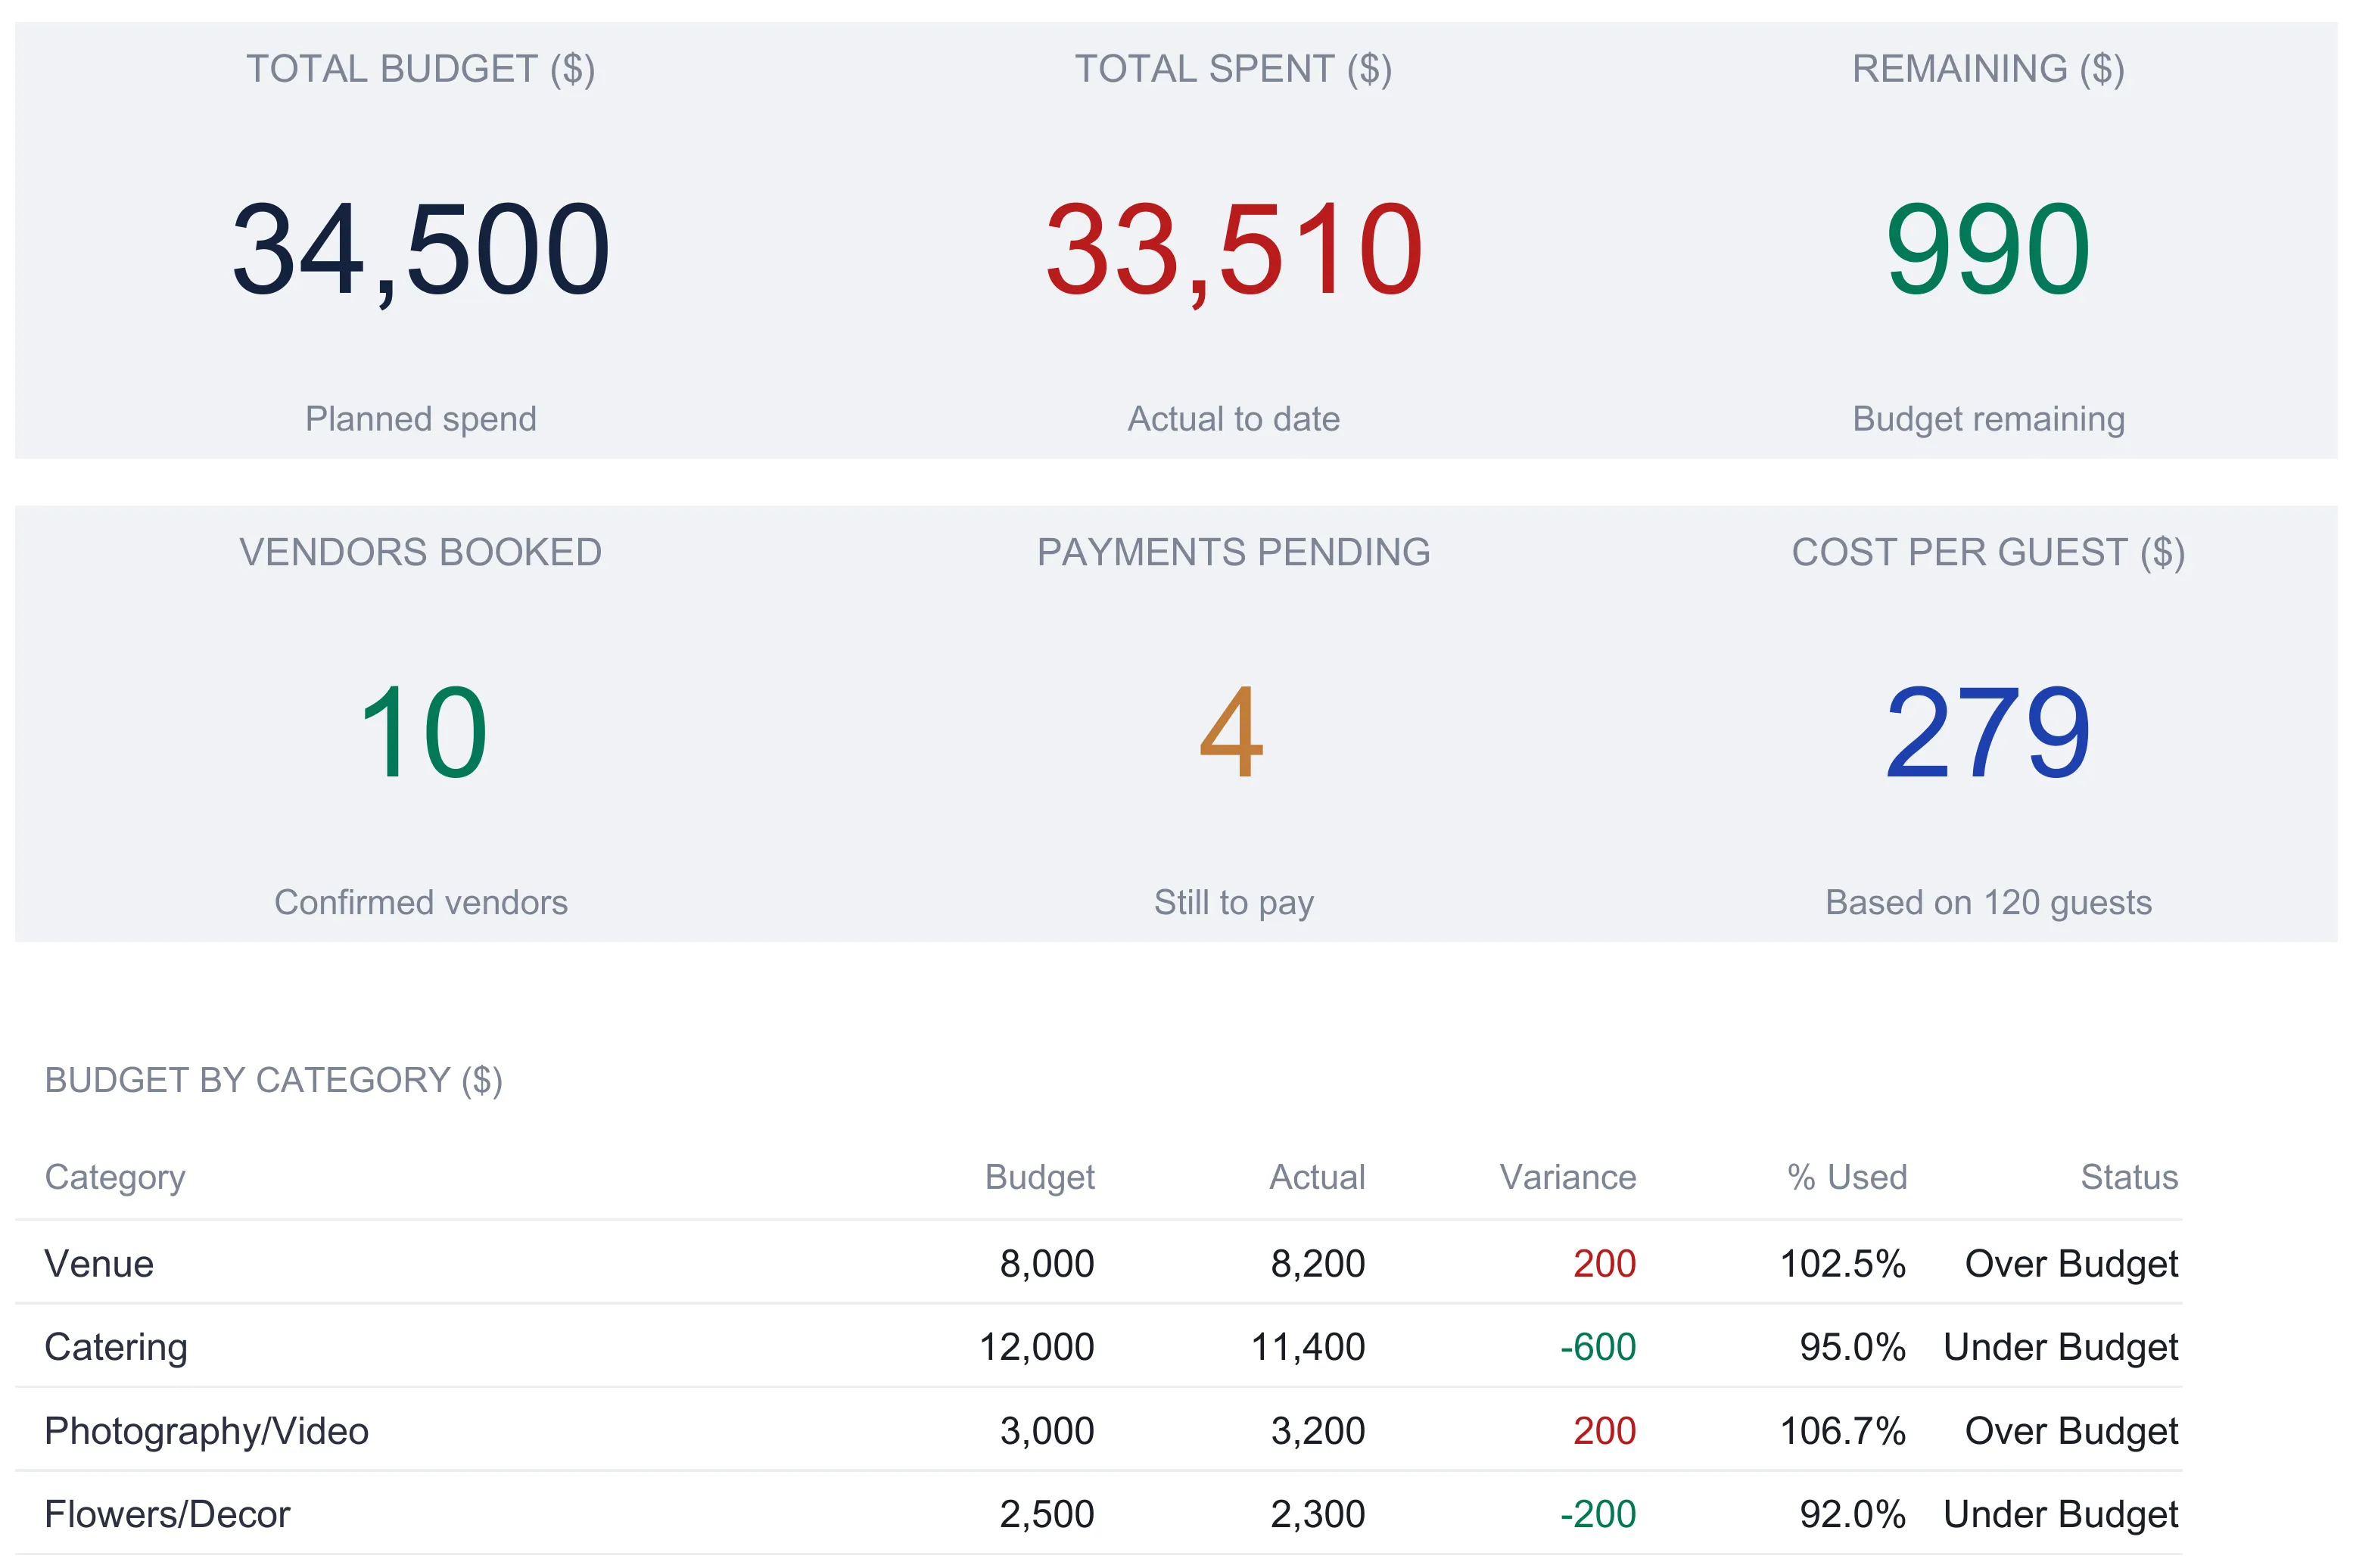
With the input sheets filled, the Dashboard computes the whole wedding at the top of the workbook. Six KPI tiles carry the headline figures:
| Tile | Sample value | What it is |
|---|---|---|
| Total Budget | $34,500 | Planned spend, summed from the categories |
| Total Spent | $33,510 | Actual to date |
| Remaining | $990 | Total budget minus total spent |
| Vendors Booked | 10 | Vendors marked Booked or Paid |
| Payments Pending | 4 | Payments marked Scheduled or Overdue |
| Cost per Guest | $279 | Actual spend divided by 120 guests |
Every tile is a formula pointing at another sheet, so the Dashboard is a genuine roll-up rather than a place anything is typed. Four of the six read Budget Overview, Cost per Guest among them, since it divides the actual total there by the guest count above it. Vendors Booked counts every vendor whose status is Booked or Paid, which is why the sample reads 10 even though only seven are strictly “Booked.” Payments Pending counts the Scheduled and Overdue rows on the Payment Schedule, the four autumn payments still to clear. Remaining is simply what is left of the plan, $990 in the sample, and it turns on nothing more than the two totals above it.
Below the tiles, the Dashboard repeats the full 14-category table with budget, actual, variance, % used, and status, and then plots two charts: a column chart comparing budget against actual by category, and a pie chart breaking spending down by category. The column chart is where the three over-budget lines stand out against the plan; the pie chart is where catering and venue visibly dominate, together more than half of every dollar. Seeing the committed total, the remaining balance, and the category mix on one screen is most of the reason to keep the workbook at all.
One quiet feature carries across every sheet: color is used consistently, so the workbook reads the same way wherever you land. Variance is green when a line is under budget and red when it is over, on both Budget Overview and Budget vs Actual. Statuses follow their own scheme, green for paid or on track, blue for booked, amber for pending or scheduled, and red for overdue or cancelled, so a glance down the Vendor Tracker or Payment Schedule sorts the settled from the outstanding without reading a single number. And the tinted input cells against white formula cells make it obvious at all times which cells are yours to fill and which will take care of themselves.
Worth noting for anyone building in a buffer: the template’s own tips mention that some couples add a 10 to 15 percent contingency buffer to each category for surprises. There is no separate contingency row among the 14 categories, so a cushion like that sits inside the category budgets you enter. Where that cushion comes from is a separate question, and the CFPB’s guide to building an emergency fund covers the general mechanics of setting cash aside for unplanned costs.
Excel or Google Sheets for a wedding budget
The template is an .xlsx file built on plain formulas, COUNTIF, SUMIF, and simple arithmetic, with no macros and no add-ons, so it runs the same way in Microsoft Excel, Google Sheets after upload, and LibreOffice Calc. Google Sheets suits couples planning together from different devices, since sharing a link lets both partners, and any contributing family, see the same live numbers. Excel suits those who prefer a local file on one machine. Formula cells warn before they are overwritten but stay editable, so the structure described here holds up whichever platform you open it in, and it is equally buildable by hand in either.
Which wedding budget template fits
The three tiers in this family serve different stages of planning, and none of them replaces the others so much as picks up where the last leaves off.
- The free Wedding Budget template covers the major categories with budgeted-versus-actual columns and a buffer line, which fits couples who want a single planning sheet and nothing more for now.
- The Essentials Wedding Budget template ($19) breaks the wedding into ten sections of named line items, each with its own subtotal, and gives every line an estimated, actual, paid and remaining figure plus a notes column, with a dashboard on top. It answers what is still owed item by item, without the vendor list or the dated payment log.
- The Wedding Budget Ultimate Spreadsheet Template ($29) is the workbook this walkthrough follows: the 14-category plan, the vendor tracker, the dated payment schedule, the guest cost analysis, the variance sheet, and the six-tile dashboard, for couples juggling many vendors and staggered payments who want all of it in one place.
For a celebration that is not a wedding, the same machinery reappears in the Event Budget Ultimate Spreadsheet Template ($29), which trades the wedding-specific categories for event setup, attendee analysis, and a revenue-versus-cost comparison, useful when an event has ticket income to weigh against its costs rather than a single household footing the bill.
Related
- Wedding Budget Planning: A Complete Guide - category percentages, hidden service charges, and a payment timeline before you open a spreadsheet
- Wedding Budget Spreadsheet: 80 Rows That Cover the Whole Day - the line-item view, and how 80-plus items group into workable sections
Frequently asked questions
Why does the template show two different cost-per-guest numbers?
They divide different totals. The Dashboard tile reads $279, the full actual spend of $33,510 divided by 120 guests, so it spreads every category, including fixed costs like rings and the officiant, across the head count. The Guest Cost Analysis sheet reads $243, which sums only the categories that genuinely scale with guests (catering, venue, drinks, cake, favors, decor, music, and photography) at $29,100 and divides that by 120. One answers "what did the whole wedding cost per head?" and the other "what do the guest-driven lines cost per head?"
Should the Vendor Tracker total match the budget total?
Not necessarily, and in the sample it does not. The Vendor Tracker adds up to $31,380 across 10 vendors, while the Budget Overview actual is $33,510. The gap of $2,130 is the four categories with no vendor row in the sample, cake, favors, beauty and hair, and other. The two sheets are independent tallies: Budget Overview records category spending, and the Vendor Tracker records who you have contracted and what deposits are down. A line can exist in one without the other.
Can the workbook show a currency other than dollars?
Yes. The Dashboard has a currency selector next to the title. Choosing a symbol relabels every money column header and KPI label across the workbook. It changes the label only and does not convert the underlying numbers, so a figure of 34,500 stays 34,500 whether it is shown with a dollar, pound, or euro symbol.
How many vendors and payments can it hold?
The Vendor Tracker has room for up to 40 vendor rows and the Payment Schedule up to 50 payment rows. The sample fills 10 and 15 of those. Every blank vendor row already carries the balance-due formula, and on both sheets the totals and the status summaries are written across the full range, so a new vendor or payment goes on the next free row and the summaries update on their own.
If I change the guest count, does my total budget change?
No. The total budget is the sum of the 14 category budgets you enter, so it moves only when a category budget changes. Guest count feeds the per-guest math instead: change it on Budget Overview and every per-guest figure on Guest Cost Analysis recalculates, along with the Dashboard's cost-per-guest tile, while the category totals stay put. The catering sensitivity grid below that breakdown is fixed at guest counts of 50 to 200 and does not move with it.
Sources
- Budgeting: How to create a budget and stick with it - Consumer Financial Protection Bureau
- An essential guide to building an emergency fund - Consumer Financial Protection Bureau
About this article
Sheets, inputs, formulas and sample figures checked on 2026-09-10 against the shipped Wedding Budget Ultimate workbook (Dashboard, Budget Overview, Vendor Tracker, Payment Schedule, Guest Cost Analysis, Budget vs Actual, How to Use), plus the free and Essentials Wedding Budget workbooks for the tier comparison. Both Consumer Financial Protection Bureau references checked against the live pages at writing time. Last reviewed September 2026.