An expense tracker spreadsheet keeps every transaction in one log and derives everything else from it: a category summary, budget vs actual variance, a 12-month roll-up, spending trends by category and payment method, and a dashboard. This walkthrough follows the structure with a worked month of 41 transactions totalling $3,209.93, housing at $1,400, and 83.7% of a $3,835 budget used. The Expense Tracker Ultimate ($29) ships the whole thing ready-made for Excel and Google Sheets.
Most people can answer “how much is in my account?” without thinking. Far fewer can answer “how much did I spend on food last month, and was that more or less than I planned?” The gap between those two questions is the whole reason expense tracking exists. A bank balance is a single number that moves for reasons it never explains. Tracking turns that one number into a story: where the money went, how often, and against what you expected. A spreadsheet is unusually good at telling that story, because the moment you record a transaction once, it can be counted, categorized, ranked, and charted without you touching it again.
The structure that makes this work is smaller than it looks. There is one place you type, a set of sheets that summarize what you typed, and a dashboard that reads the summaries. The examples below come from our Expense Tracker Ultimate Spreadsheet Template ($29), which ships the entire structure ready-made for Excel and Google Sheets. The layout is reproducible by hand if you would rather build your own, and everything here traces back to real cells in that workbook.
What an expense tracker spreadsheet has to hold
Strip away the apps and the bank feeds and an expense tracker only ever holds four kinds of data:
- Per-transaction records. The date, description, category, amount, and payment method of everything you spent. This is the raw material, and it is the bulk of the typing.
- Category summaries. The same transactions rolled up so each category shows its total, its count, and its share of the month.
- A plan to compare against. A planned amount for every category, so the actual figures have something to be measured against.
- Derived views and metrics. The month-by-month roll-up, the rankings, and the dashboard tiles. These are worked out from the three kinds of data above rather than added up by hand.
The Expense Tracker Ultimate gives each of these its own sheet. An Expense Log holds the transactions, a Monthly Summary and a Spending Trends sheet roll them up, a Budget vs Actual sheet carries the plan, a 12-Month Overview stretches the view across the year, and a Dashboard sits on top with a How to Use sheet carrying the instructions. The order below follows the order you actually work in, from the one sheet you type into out to the views that read it.
Log every transaction once: the Expense Log
The Expense Log is the only place a transaction is ever entered, and getting comfortable with it is most of the work. Each row is one purchase, and it has six columns: date, description, category, amount, payment method, and an optional note. The category and payment method are dropdowns rather than free text, which matters more than it seems. Every summary later in the workbook groups by the exact text in those two columns, so a dropdown that always spells “Food & Dining” the same way is what keeps the totals from splitting a category in two.
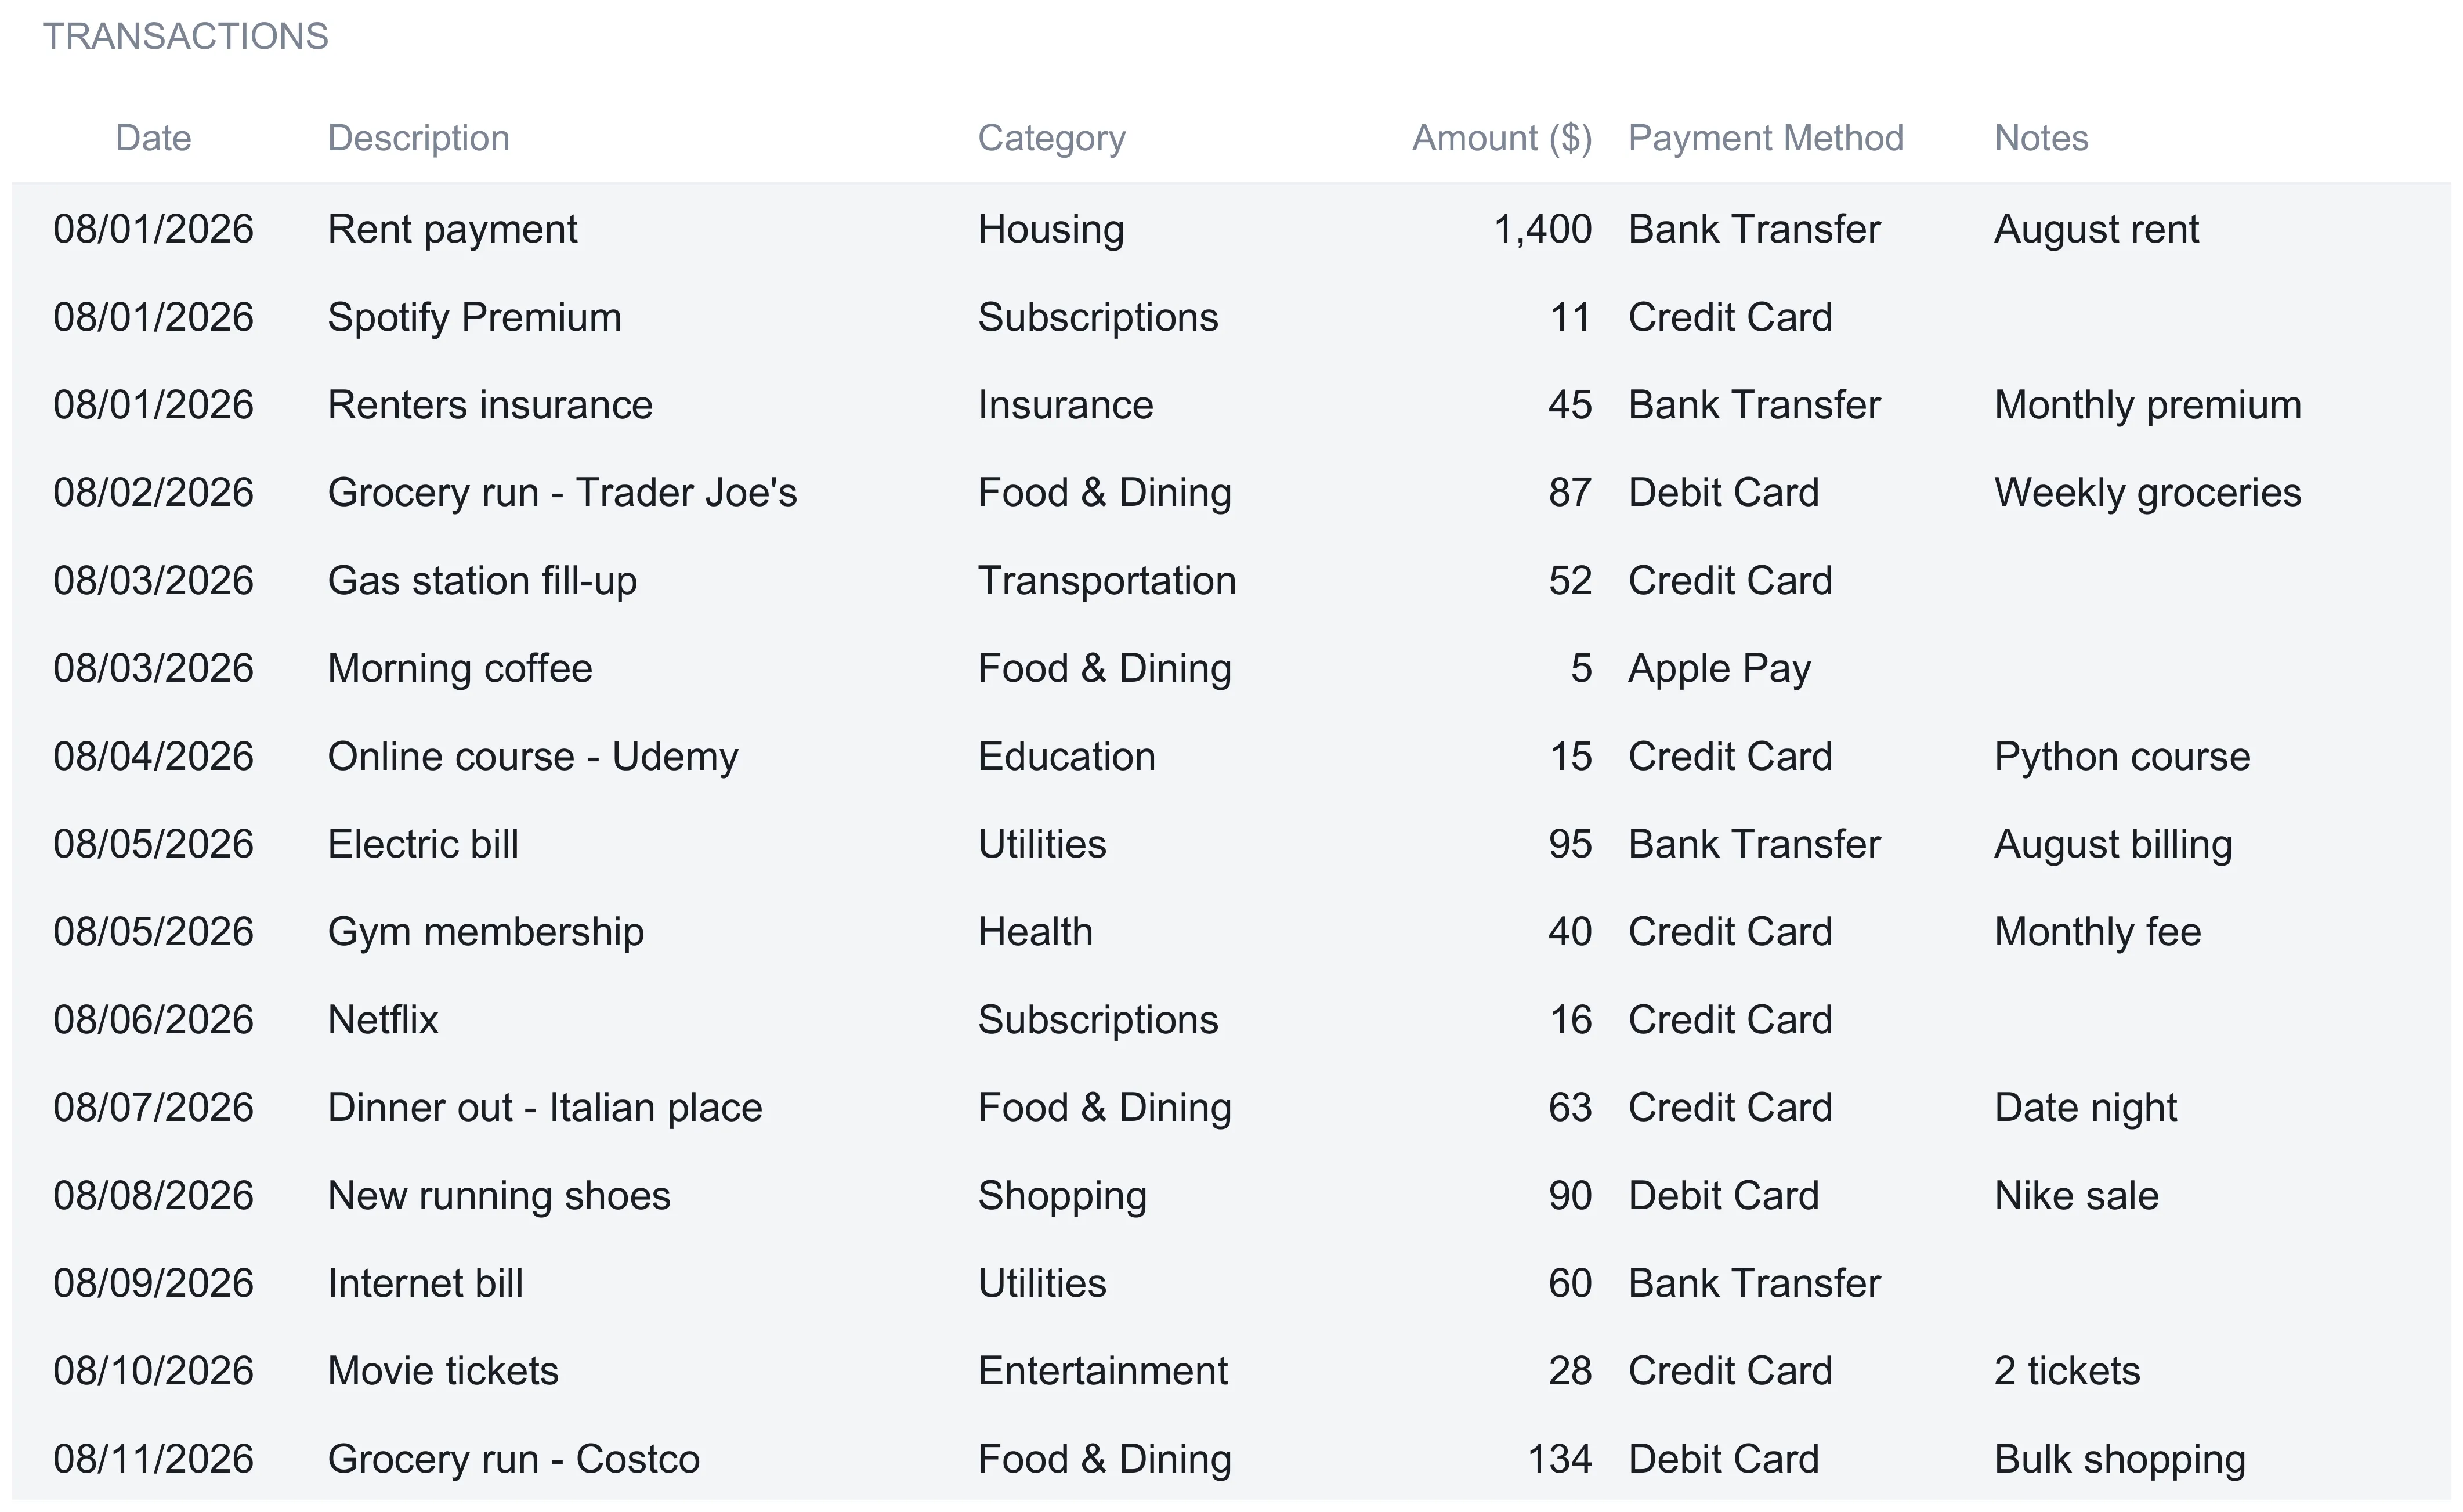
One row makes the flow concrete. The first entry in the sample month is an August 1 rent payment of $1,400, filed under Housing, paid by bank transfer, with a note reading “August rent.” The next line is a $10.99 Spotify Premium charge under Subscriptions on a credit card. Nothing about these rows is calculated; they are simply what was spent, typed once. The sample month runs to 41 transactions, from that $1,400 rent line down to a $4.50 ATM fee filed under Other, and the log totals them at the bottom to $3,209.93 across 41 entries.
Two design details are worth copying into any version you build yourself.
Spare rows are pre-wired. The log is built for up to 200 entries per month, and the totals at the bottom already reach across that whole range. The count uses a formula that tallies every row with a category filled in, and the amount total sums the entire amount column, so a blank row simply adds nothing until you use it. There is no range to extend and no total to redraw.
Everything downstream reads this one log. The Monthly Summary, the Actual column on Budget vs Actual, the August column of the 12-Month Overview, the Spending Trends rankings, and every dashboard tile all pull from these same rows. That is the single most important property of the whole design. Spreadsheets that drift out of sync tend to break exactly where a number gets typed into one summary but not another. The only other cells that take typing are the planned amounts and the totals for months already closed, and neither of those restates a figure the log holds.
The two optional columns earn their place quietly. The note column is free text and holds the detail a category can never carry. A grocery run at Trader Joe’s noted “Weekly groceries” reads differently from a “Date night” dinner out, even though both sit under Food & Dining, and the note is where that difference is kept. The date column does more than sort the rows. The dashboard reads the earliest date in the log to work out which calendar month the file is describing. That is how a per-day figure knows whether to divide by 28, 30, or 31, so filling the date on every row keeps the detection right. Together the six columns capture enough to answer both “what was this?” and “how did I pay for it?” without ever leaving the log.
What the log does not do is fill itself. There is no bank connection and no import, so every transaction is a handful of typed cells. At 41 entries a month that is a few minutes here and there, and the trade is deliberate: a connected app removes the typing but hands you its own categories and keeps your data on its servers, while a spreadsheet keeps every formula visible, every category yours to rename, and the file on your own machine.
Let the categories total themselves: the Monthly Summary
Once the log has rows in it, the Monthly Summary reads them and answers the “where did it go?” question one category at a time. Nothing on this sheet is typed. Each of the thirteen categories gets four figures: total spent, number of transactions, average per transaction, and share of the month.
The totals use a sum that adds up every amount whose category matches the row, and the counts use a matching tally, so the two always describe the same set of transactions. The average is simply the total divided by the count, and the share is the category total over the grand total. Reading down the sample month, Housing leads at $1,400 from a single transaction, which is 43.6% of everything spent. Food & Dining follows at $444.99 spread across eight transactions, a $55.62 average and 13.9% of the month. Utilities come in at $243 across four bills, then a run of mid-sized categories: Savings at $200, Shopping at $167.49, Health at $167, Insurance at $160, Transportation at $155.50, and Entertainment at $123. The tail is small and frequent, with Personal, Subscriptions, and Education each under $60, and Other at $4.50. The grand total row confirms the whole month: $3,209.93 across 41 transactions, an average of $78.29 per transaction, and 100% of the total.
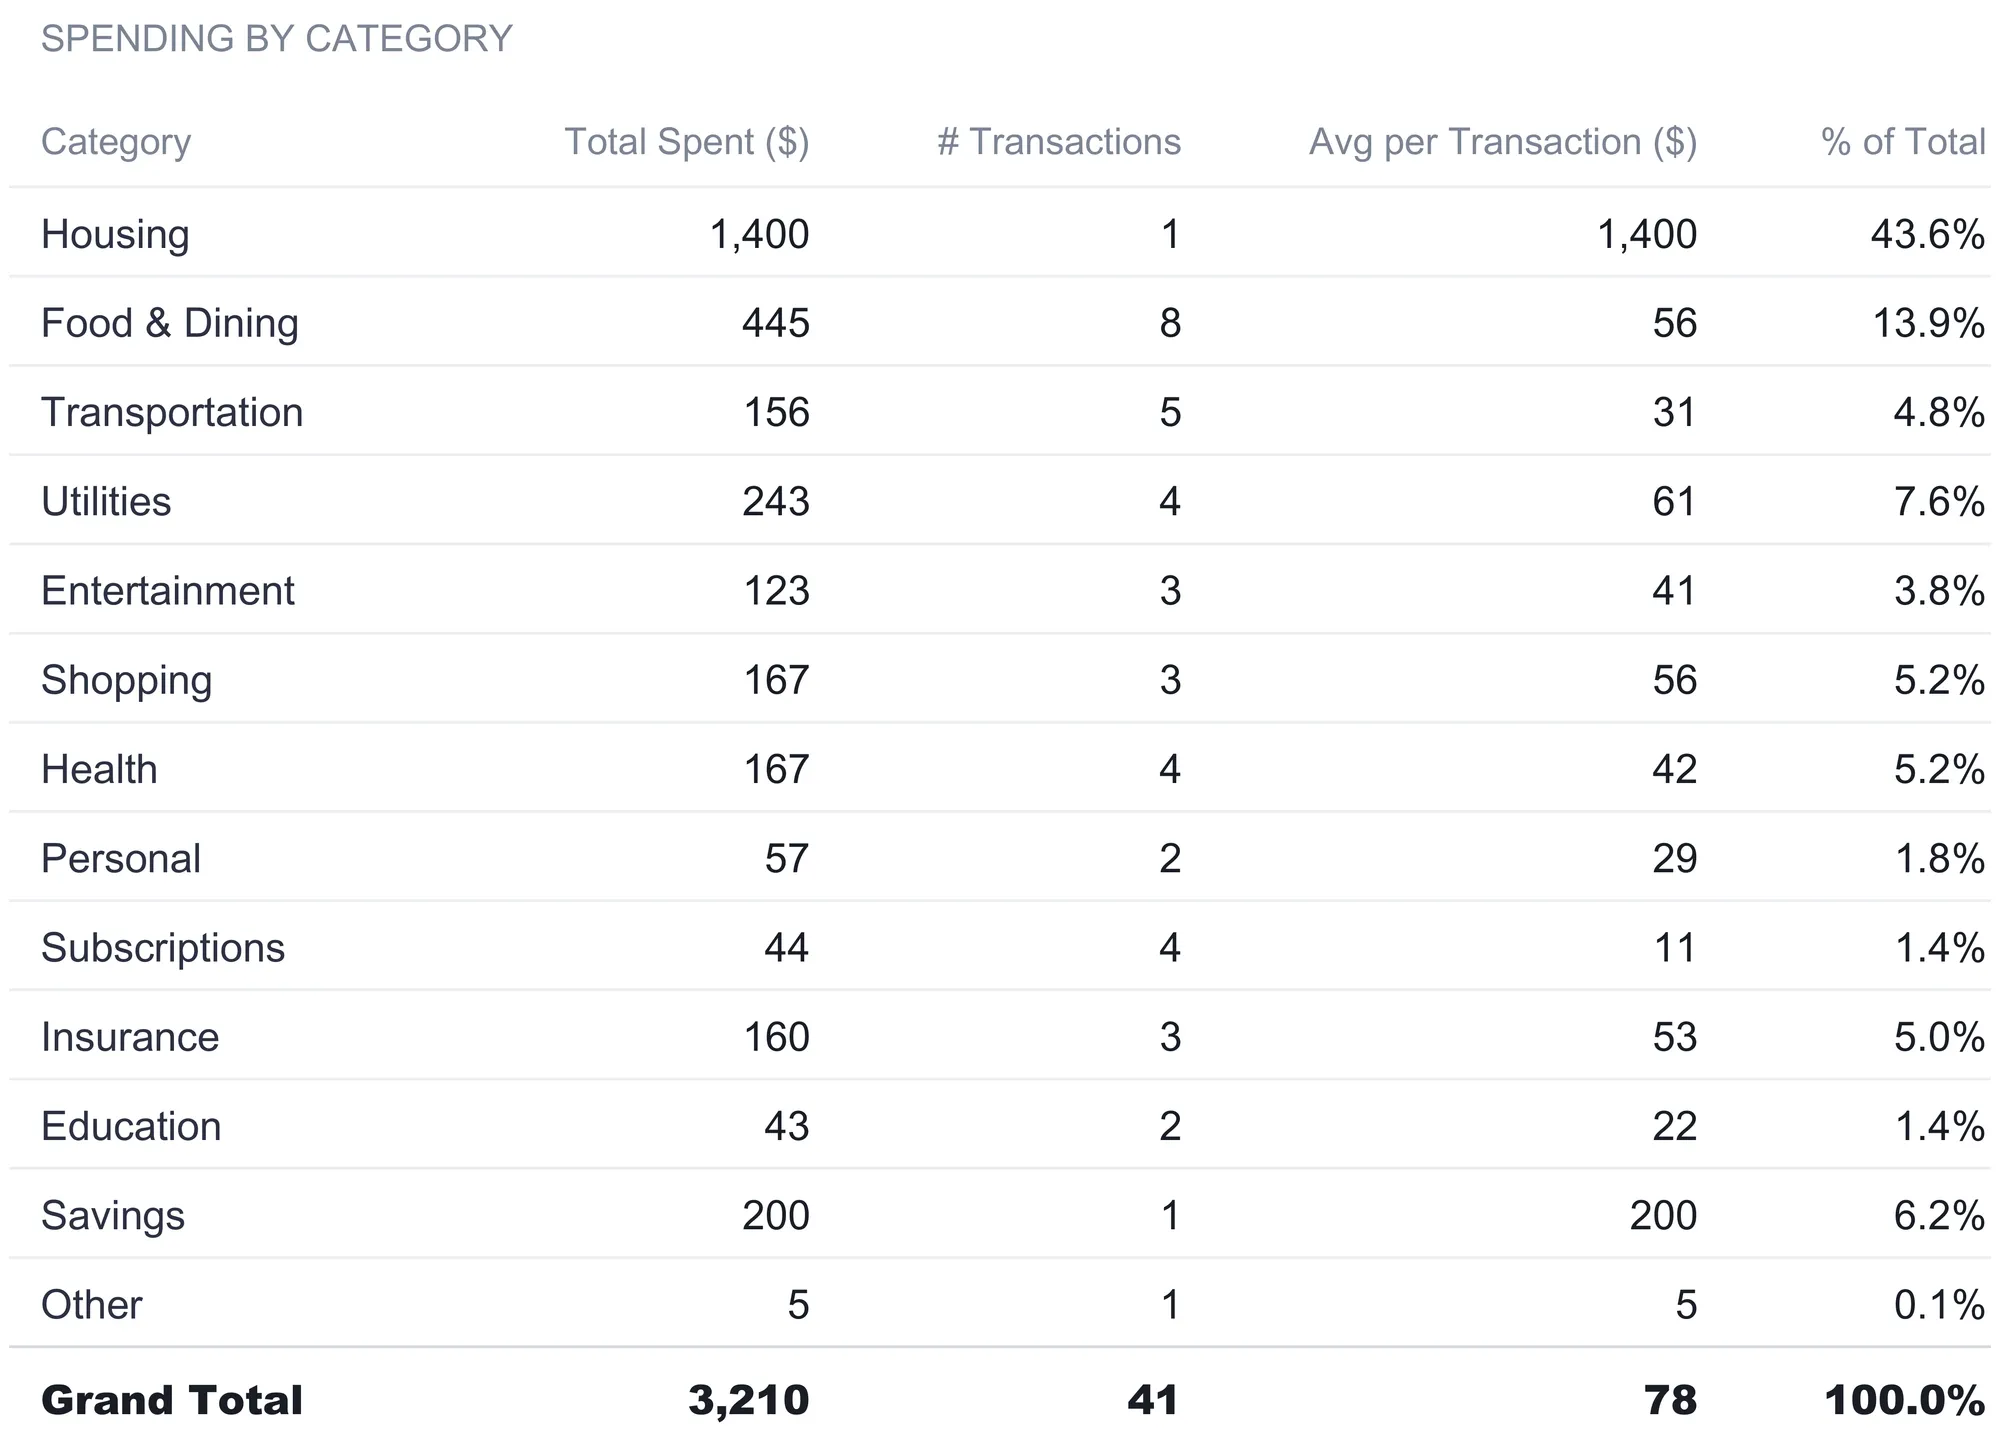
One row on this sheet works differently from the rest, and it is worth understanding. The Other row does not sum a category by name the way the twelve rows above it do. Instead it takes the log’s full total and subtracts everything the named categories already captured, and its count works the same way, taking the total number of categorized transactions and removing the ones the named rows counted. That makes Other a genuine catch-all: anything logged under a label the summary does not have a dedicated row for still lands somewhere and still shows up in the grand total. In the sample that leaves a single $4.50 ATM fee sitting in Other, which is exactly where an out-of-network bank charge belongs when it fits no cleaner heading.
The transaction count is the column people underrate. A category can be large because one thing was expensive or because many small things added up, and only the count tells them apart. Housing is $1,400 from one payment, so its average per transaction is the whole $1,400. Food & Dining is nearly the same size in habit terms but arrives as eight separate visits averaging $55.62 each. The two behave completely differently even when their monthly totals are close, and the average-per-transaction column is where that difference becomes readable.
Compare the plan to reality: Budget vs Actual
A total on its own is neutral. Two hundred dollars of shopping is only high or low against what you meant to spend, and the Budget vs Actual sheet is where that comparison lives. The Planned column is yours to set for each category, while the Actual column reads straight from the Monthly Summary. Two more columns fall out automatically, the variance in dollars and the variance as a percentage.
The variance is actual minus planned, so a negative number means you came in under the plan. In the sample month every category runs under, which is why the whole variance column reads in the negative and shows in green. Housing was planned at $1,500 and came in at $1,400, a variance of -$100 or -6.7%. Food & Dining was planned at $500 against $444.99 actual, -$55.01 or -11.0%. Some of the largest percentage gaps sit in the smallest categories, where Other was planned at $50 and spent $4.50 for a -91.0% swing, a reminder that a big percentage on a tiny base is not the same as a big dollar miss. The total row sums it all: $3,835 planned against $3,209.93 actual, a variance of -$625.07 or -16.3% for the month.
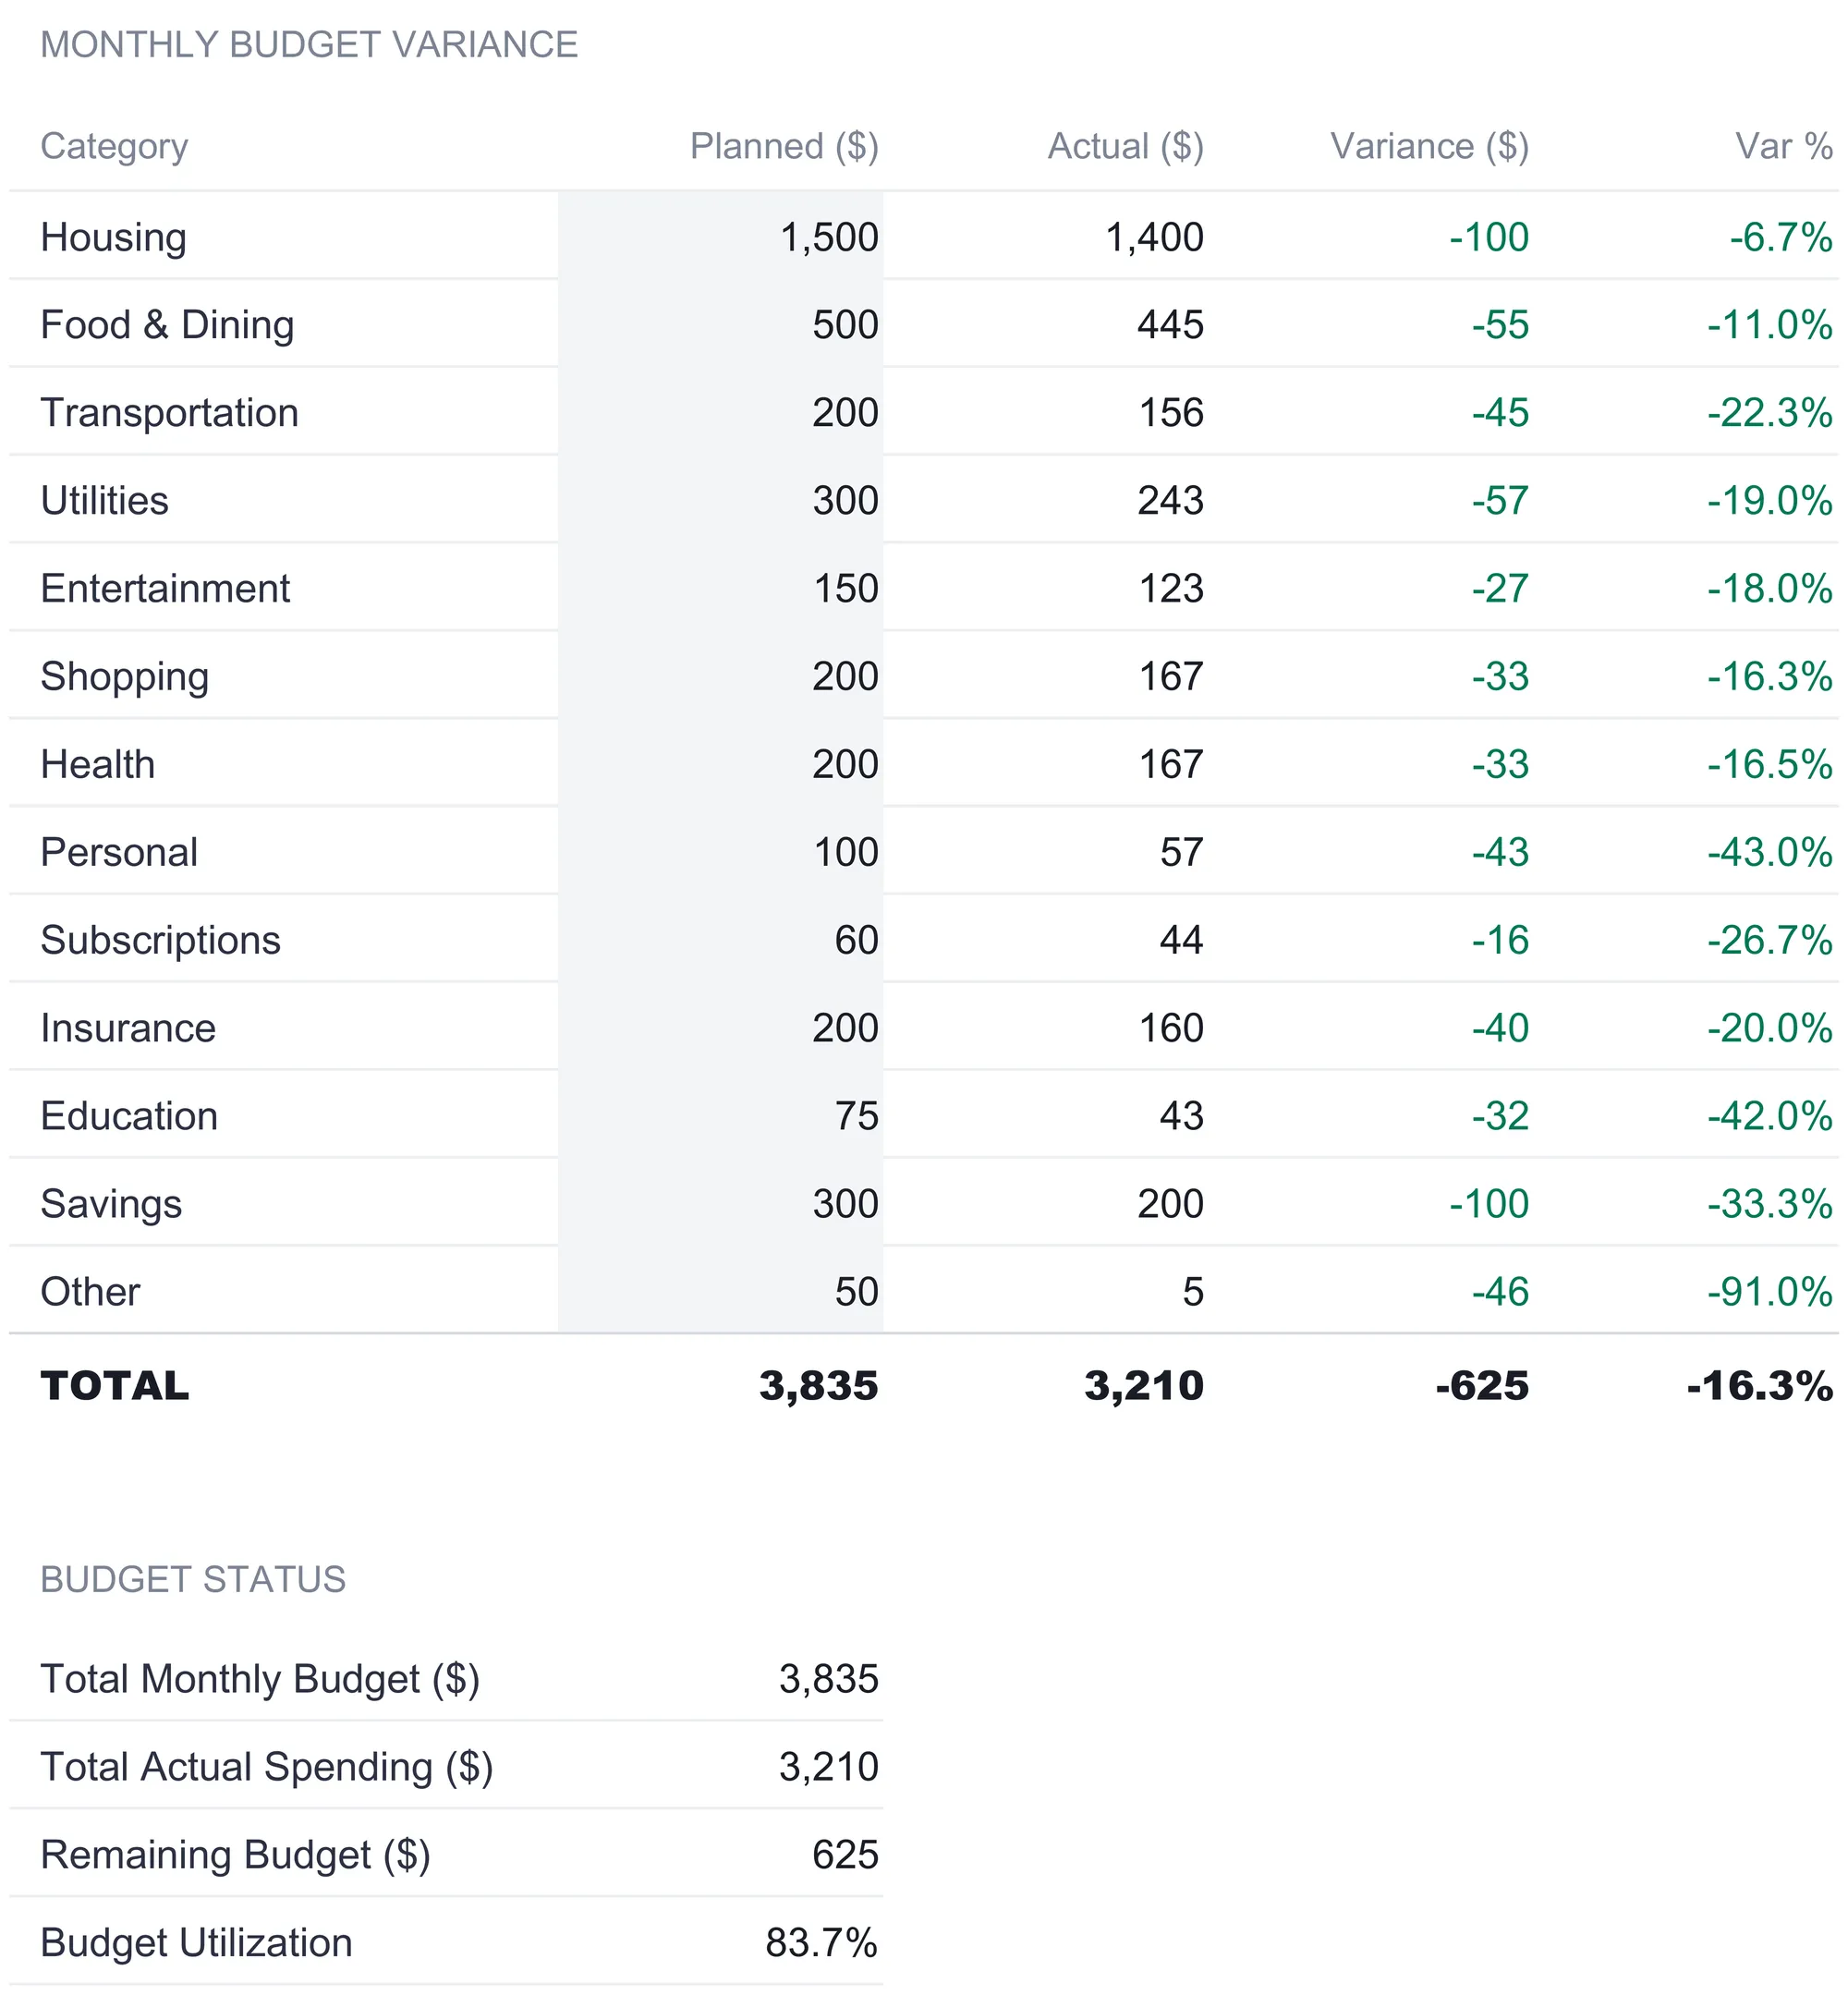
Below the category table sits a compact Budget Status block that restates the month in four lines: total monthly budget of $3,835, total actual spending of $3,209.93, remaining budget of $625.07, and a budget utilization of 83.7%. Utilization is actual over planned, the mirror image of the remaining figure, and it is the number that travels most reliably between months because it is a percentage rather than a dollar amount. A month at 83.7% and a month at 101% tell you something at a glance that two raw totals would not.
Roll the year up: the 12-Month Overview
Everything so far describes a single month. The 12-Month Overview stretches that same category breakdown sideways, with a column for every month from January to December and an Annual Total column on the right. This is the sheet that turns a habit of monthly tracking into a year you can actually look at.
Only one column is calculated. The August column reads live from the Monthly Summary, so in the sample it shows the familiar figures: Housing $1,400, Food & Dining $444.99, and so on down to Other at $4.50, with the month totalling $3,209.93. Every other month is a set of cells you type a total into as the year goes, which the sheet states plainly in its own header note. The design choice here is honest about its limits: the workbook calculates the month you are living in and lets you carry forward the months you have already closed, rather than pretending to hold twelve months of transaction-level detail in one file.
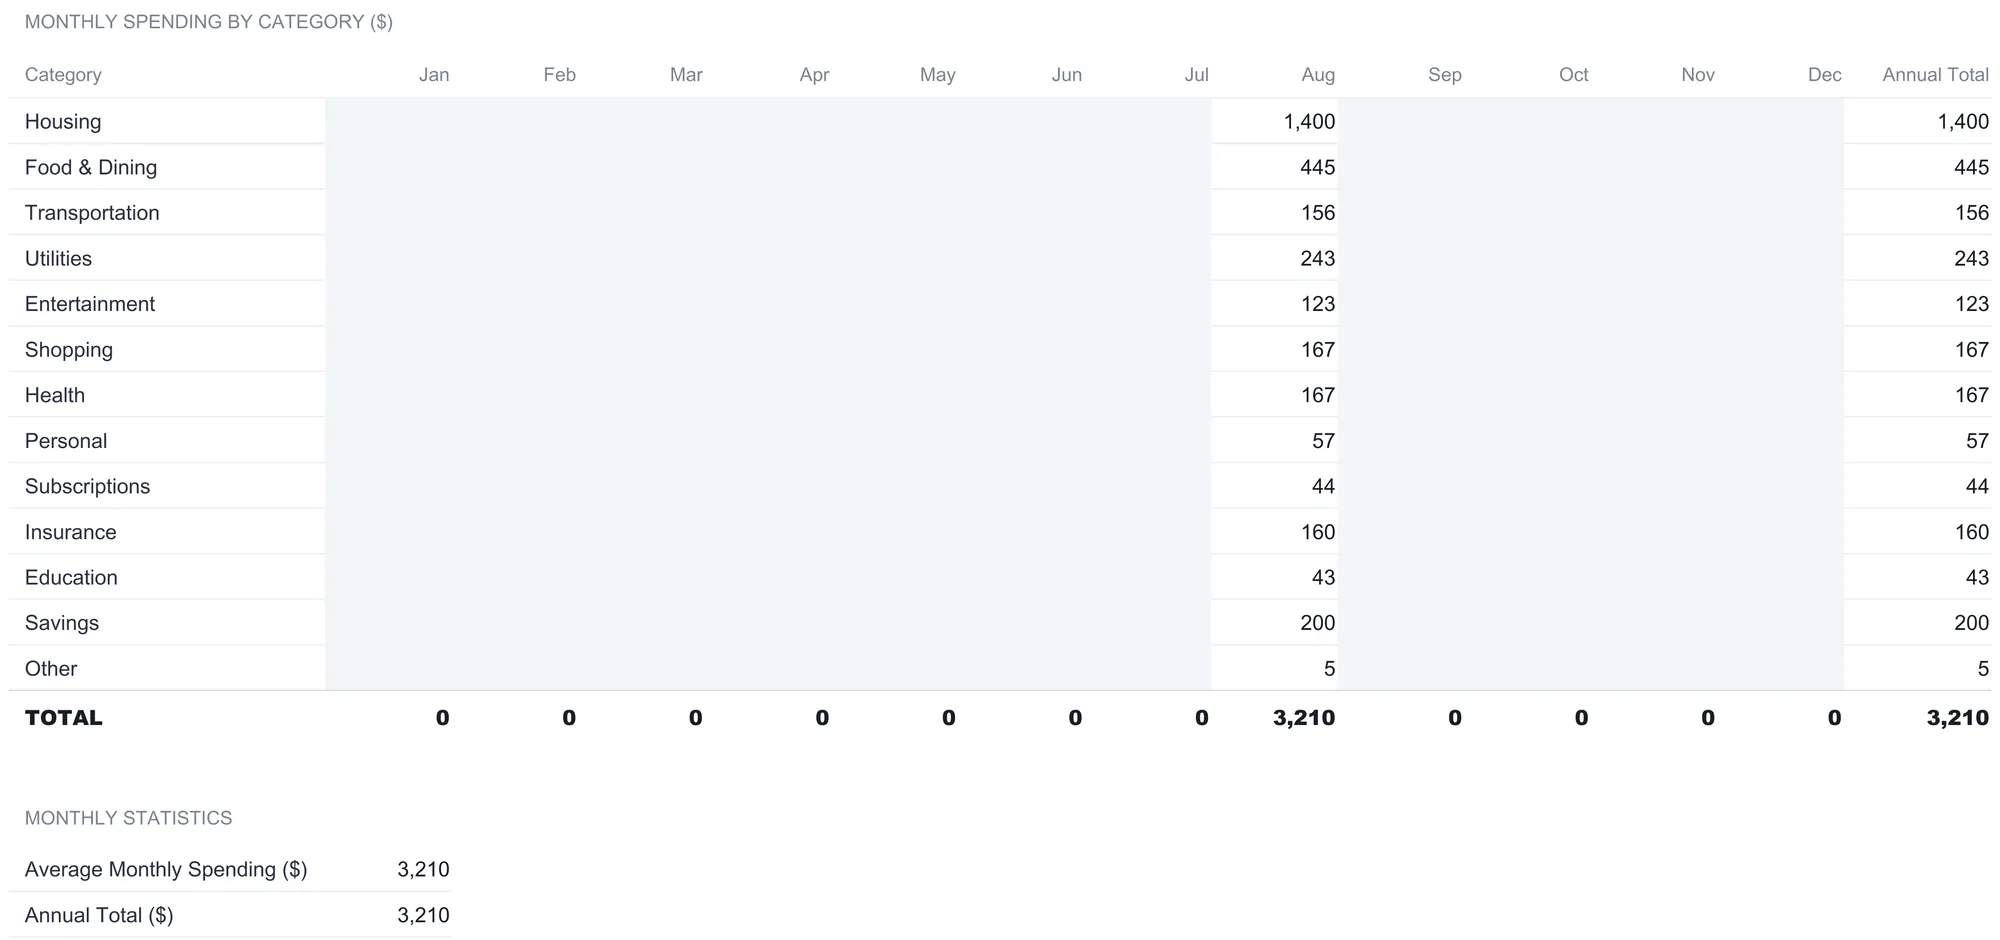
Two statistics sit below the grid. Average Monthly Spending divides the annual total by the count of months that have any spending in them, so it stays honest early in the year when only one or two months are filled; with just August populated it reads $3,209.93. The Annual Total simply carries the year-to-date figure, which is also $3,209.93 in the sample. As more months get filled, both numbers move on their own, and the annual view starts to show whether spending is drifting up, holding flat, or swinging with the seasons.
Rank what actually moves the total: Spending Trends
The Monthly Summary lists categories in a fixed order. The Spending Trends sheet asks a sharper question: which categories are actually moving the total, and how are you paying for all of it? It answers with two ranked tables, both pulled live from the log.
The first table ranks the thirteen categories from largest to smallest, numbering them one through thirteen and repeating the amount, the share of the total, and the average per transaction alongside each. In the sample, the ranking reads Housing first at $1,400 and 43.6%, Food & Dining second at $444.99 and 13.9%, Utilities third at $243, then Savings, Shopping, Health, Insurance, Transportation, Entertainment, and a small tail of Personal, Subscriptions, Education, and Other. Ranking rather than listing changes what you notice. The top two categories alone are more than half the month, and seeing them sorted makes that concentration obvious in a way an alphabetical list hides.
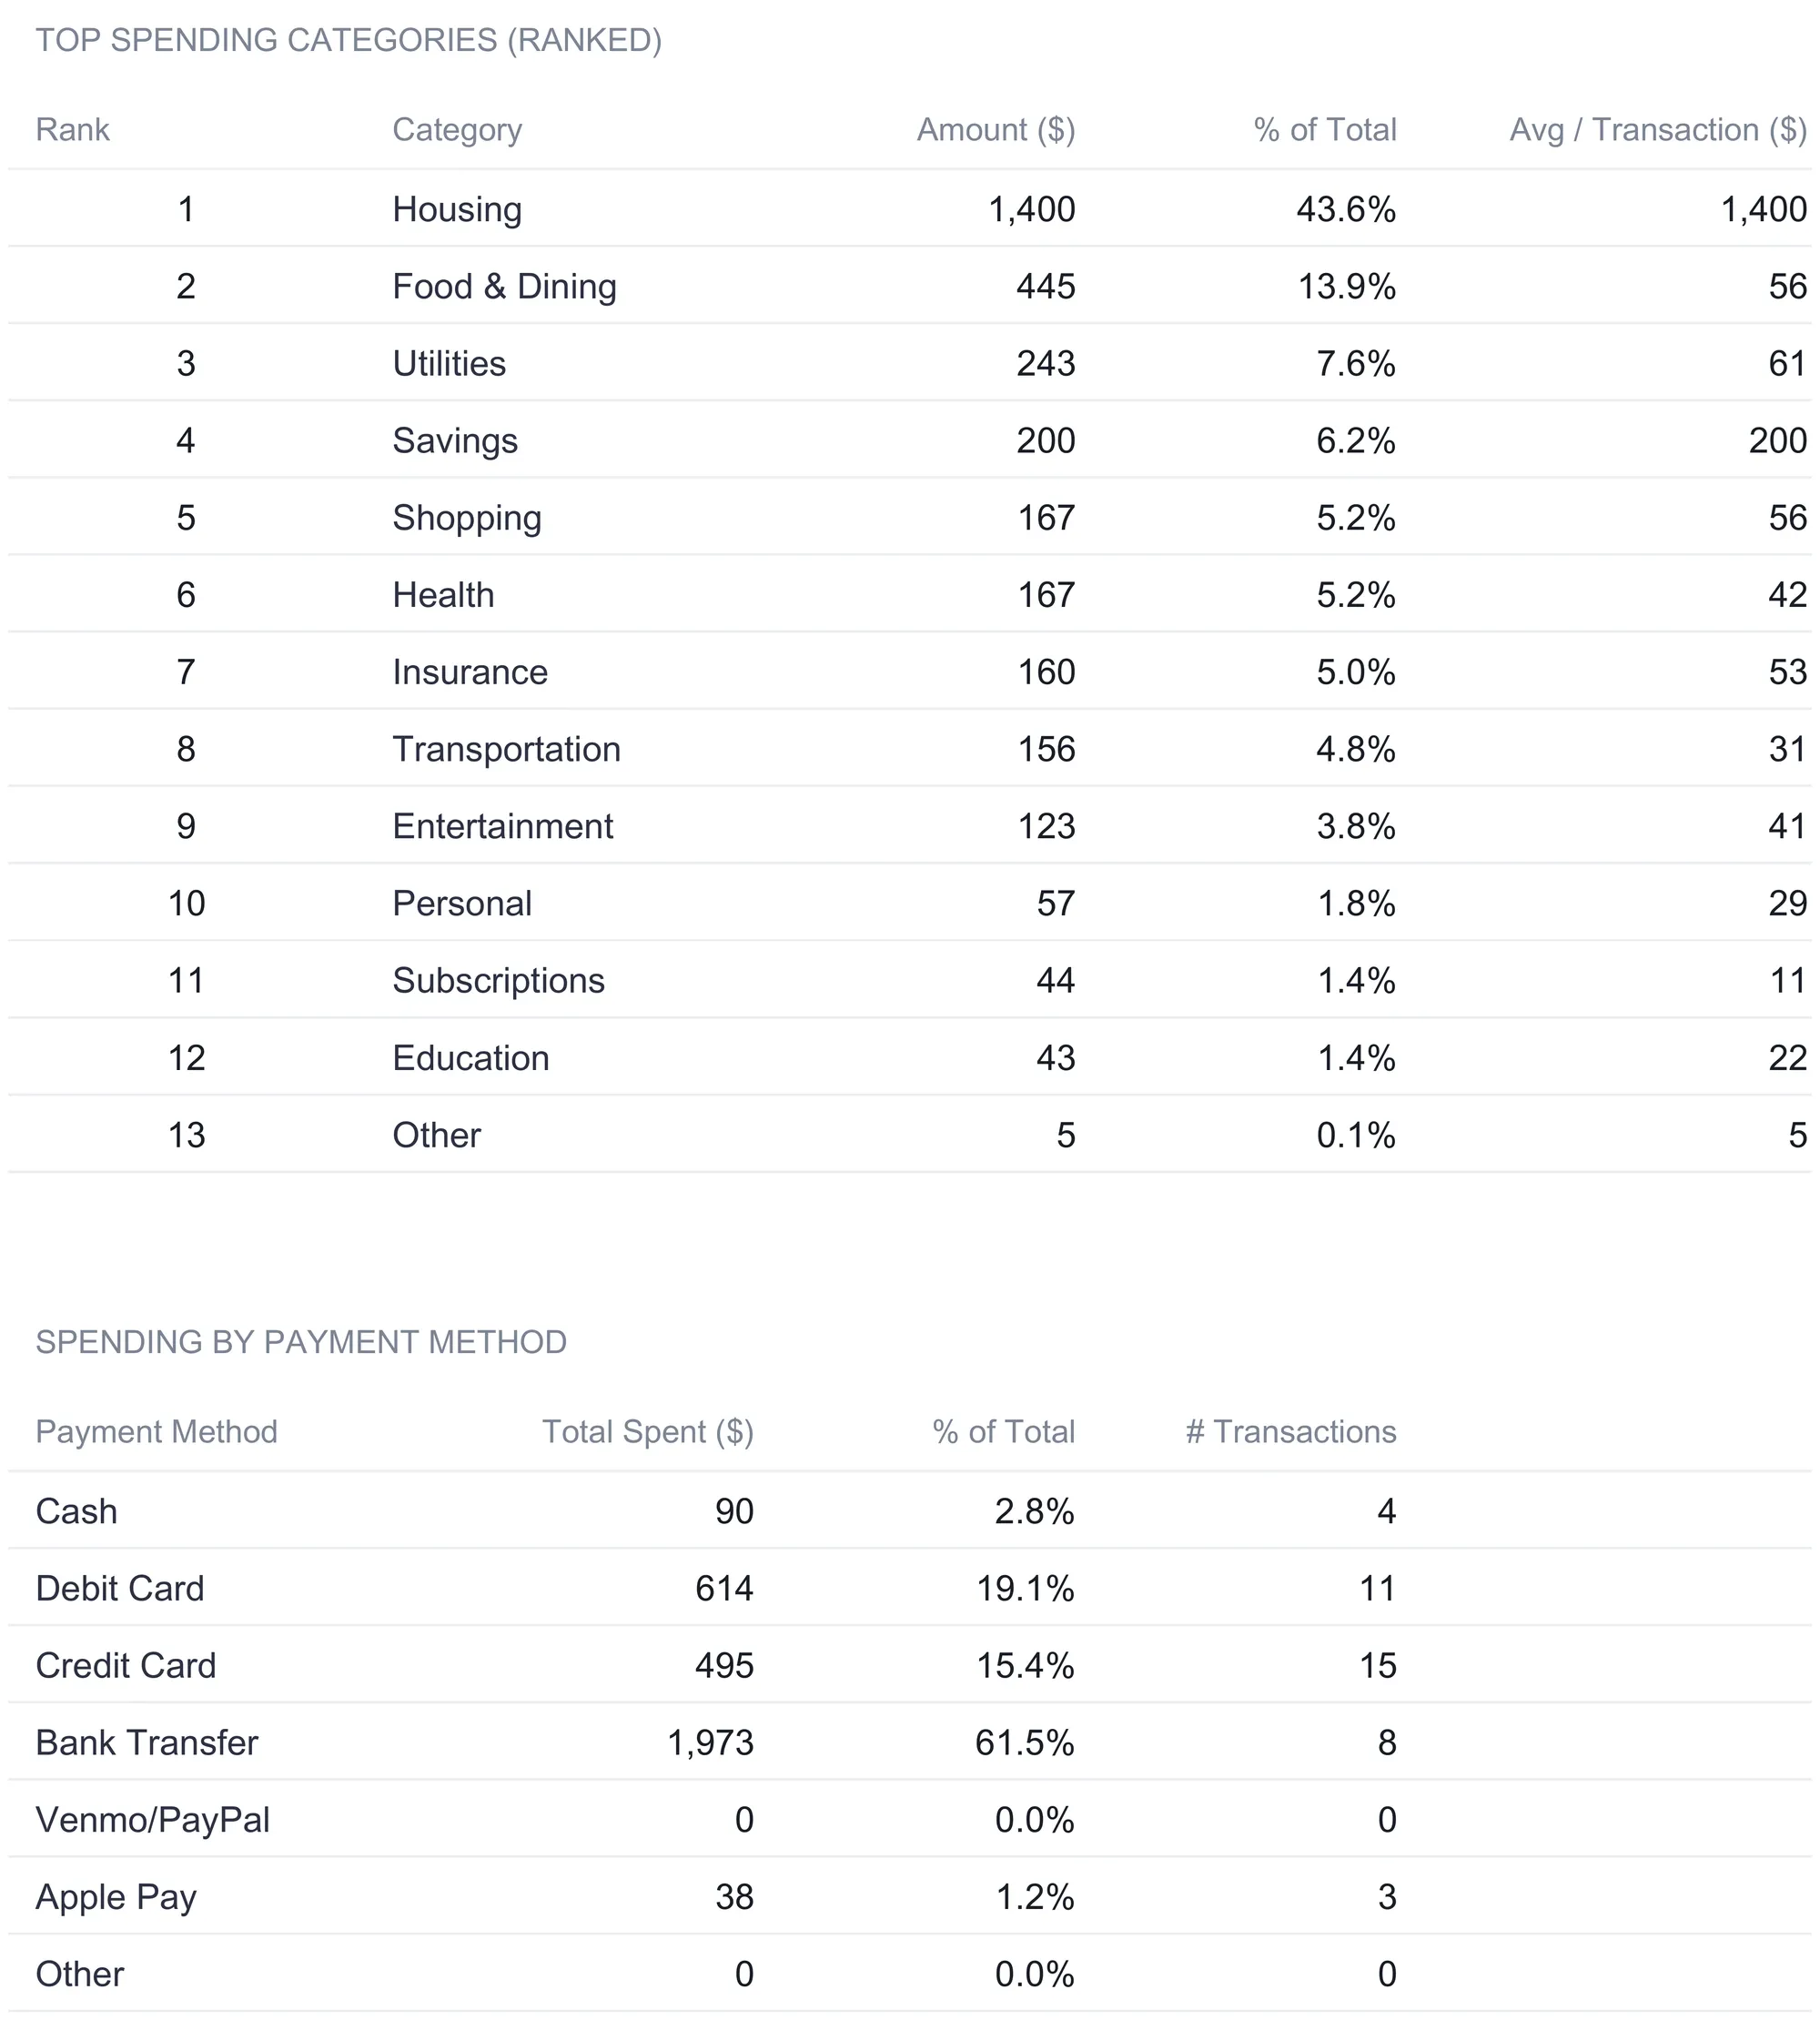
The second table is the one no category summary shows: spending by payment method. It sums the amount column by the payment method chosen in the log, so it reveals not what you bought but how it was funded. The sample splits across seven methods, and the shape is telling. Bank Transfer carries $1,973, or 61.5% of the month, across just eight transactions, because the largest recurring bills like rent, utilities, and insurance are paid that way. Credit Card handles the most transactions at fifteen for $495.45, Debit Card covers eleven for $613.73, and the small remainder runs through Cash at $90 across four transactions and Apple Pay at $37.75 across three, with Venmo/PayPal and Other unused this month. A payment-method view is useful precisely because it cuts across categories. A single card or account that turns out to carry most of the month is worth knowing about, and this table is where that shows up.
The dashboard: six numbers and a chart
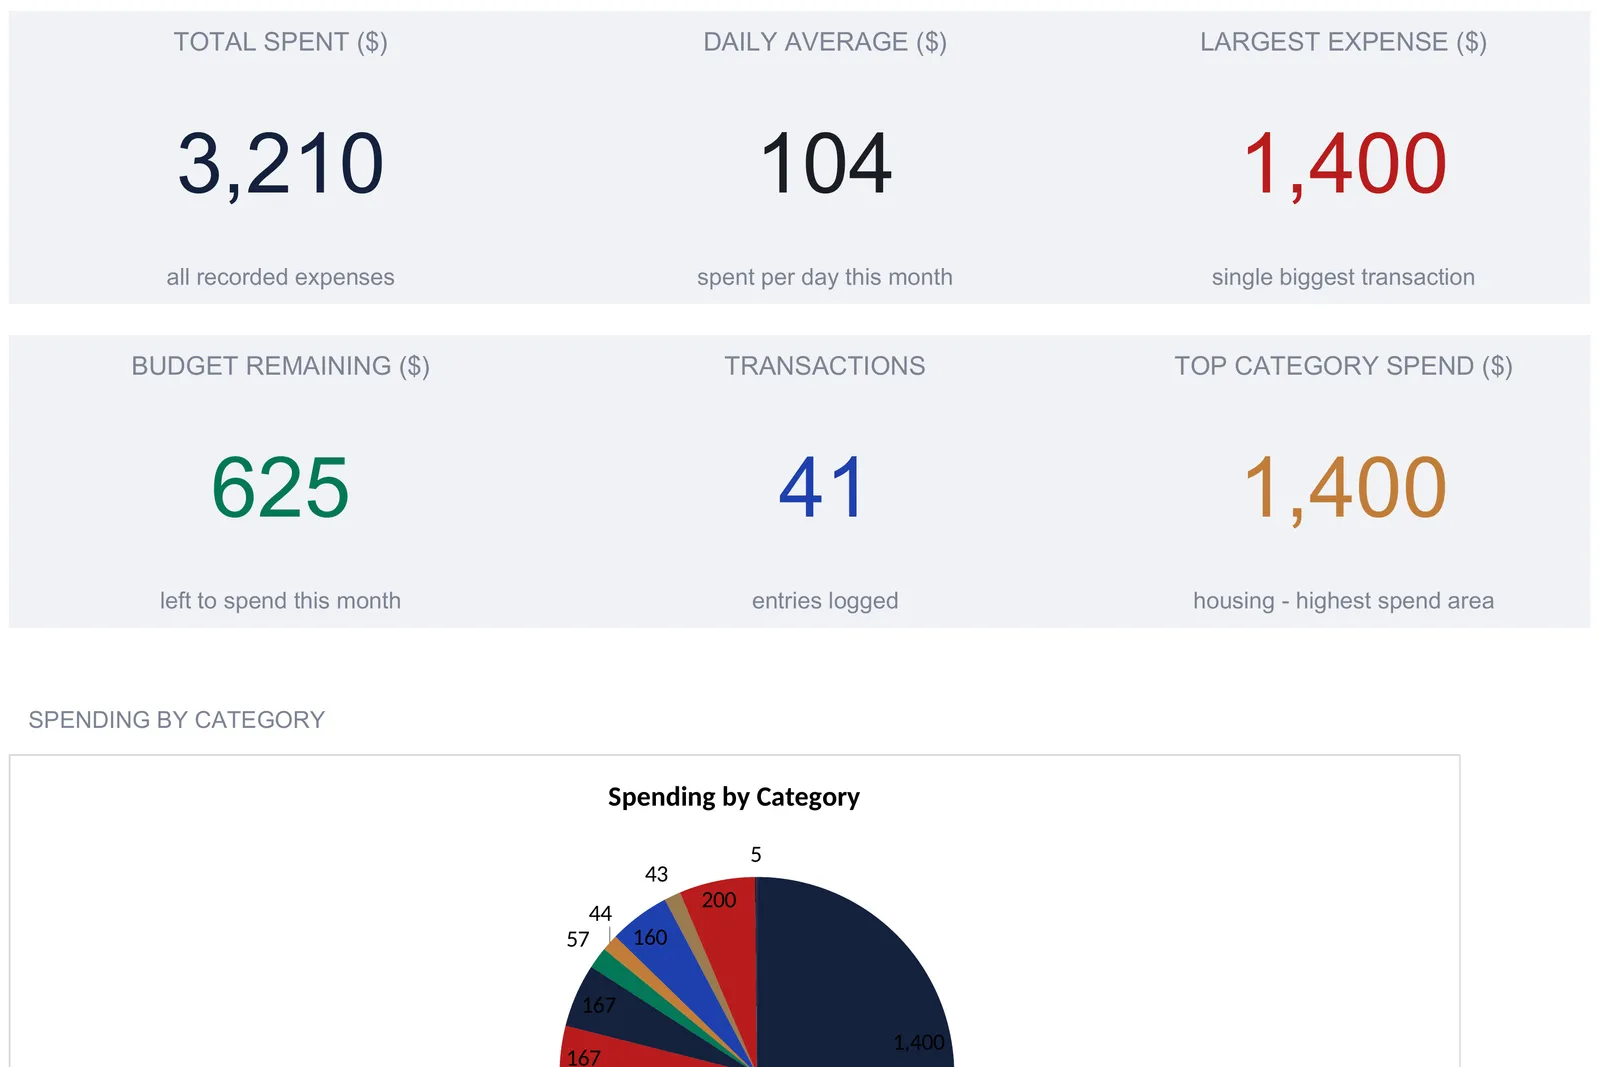
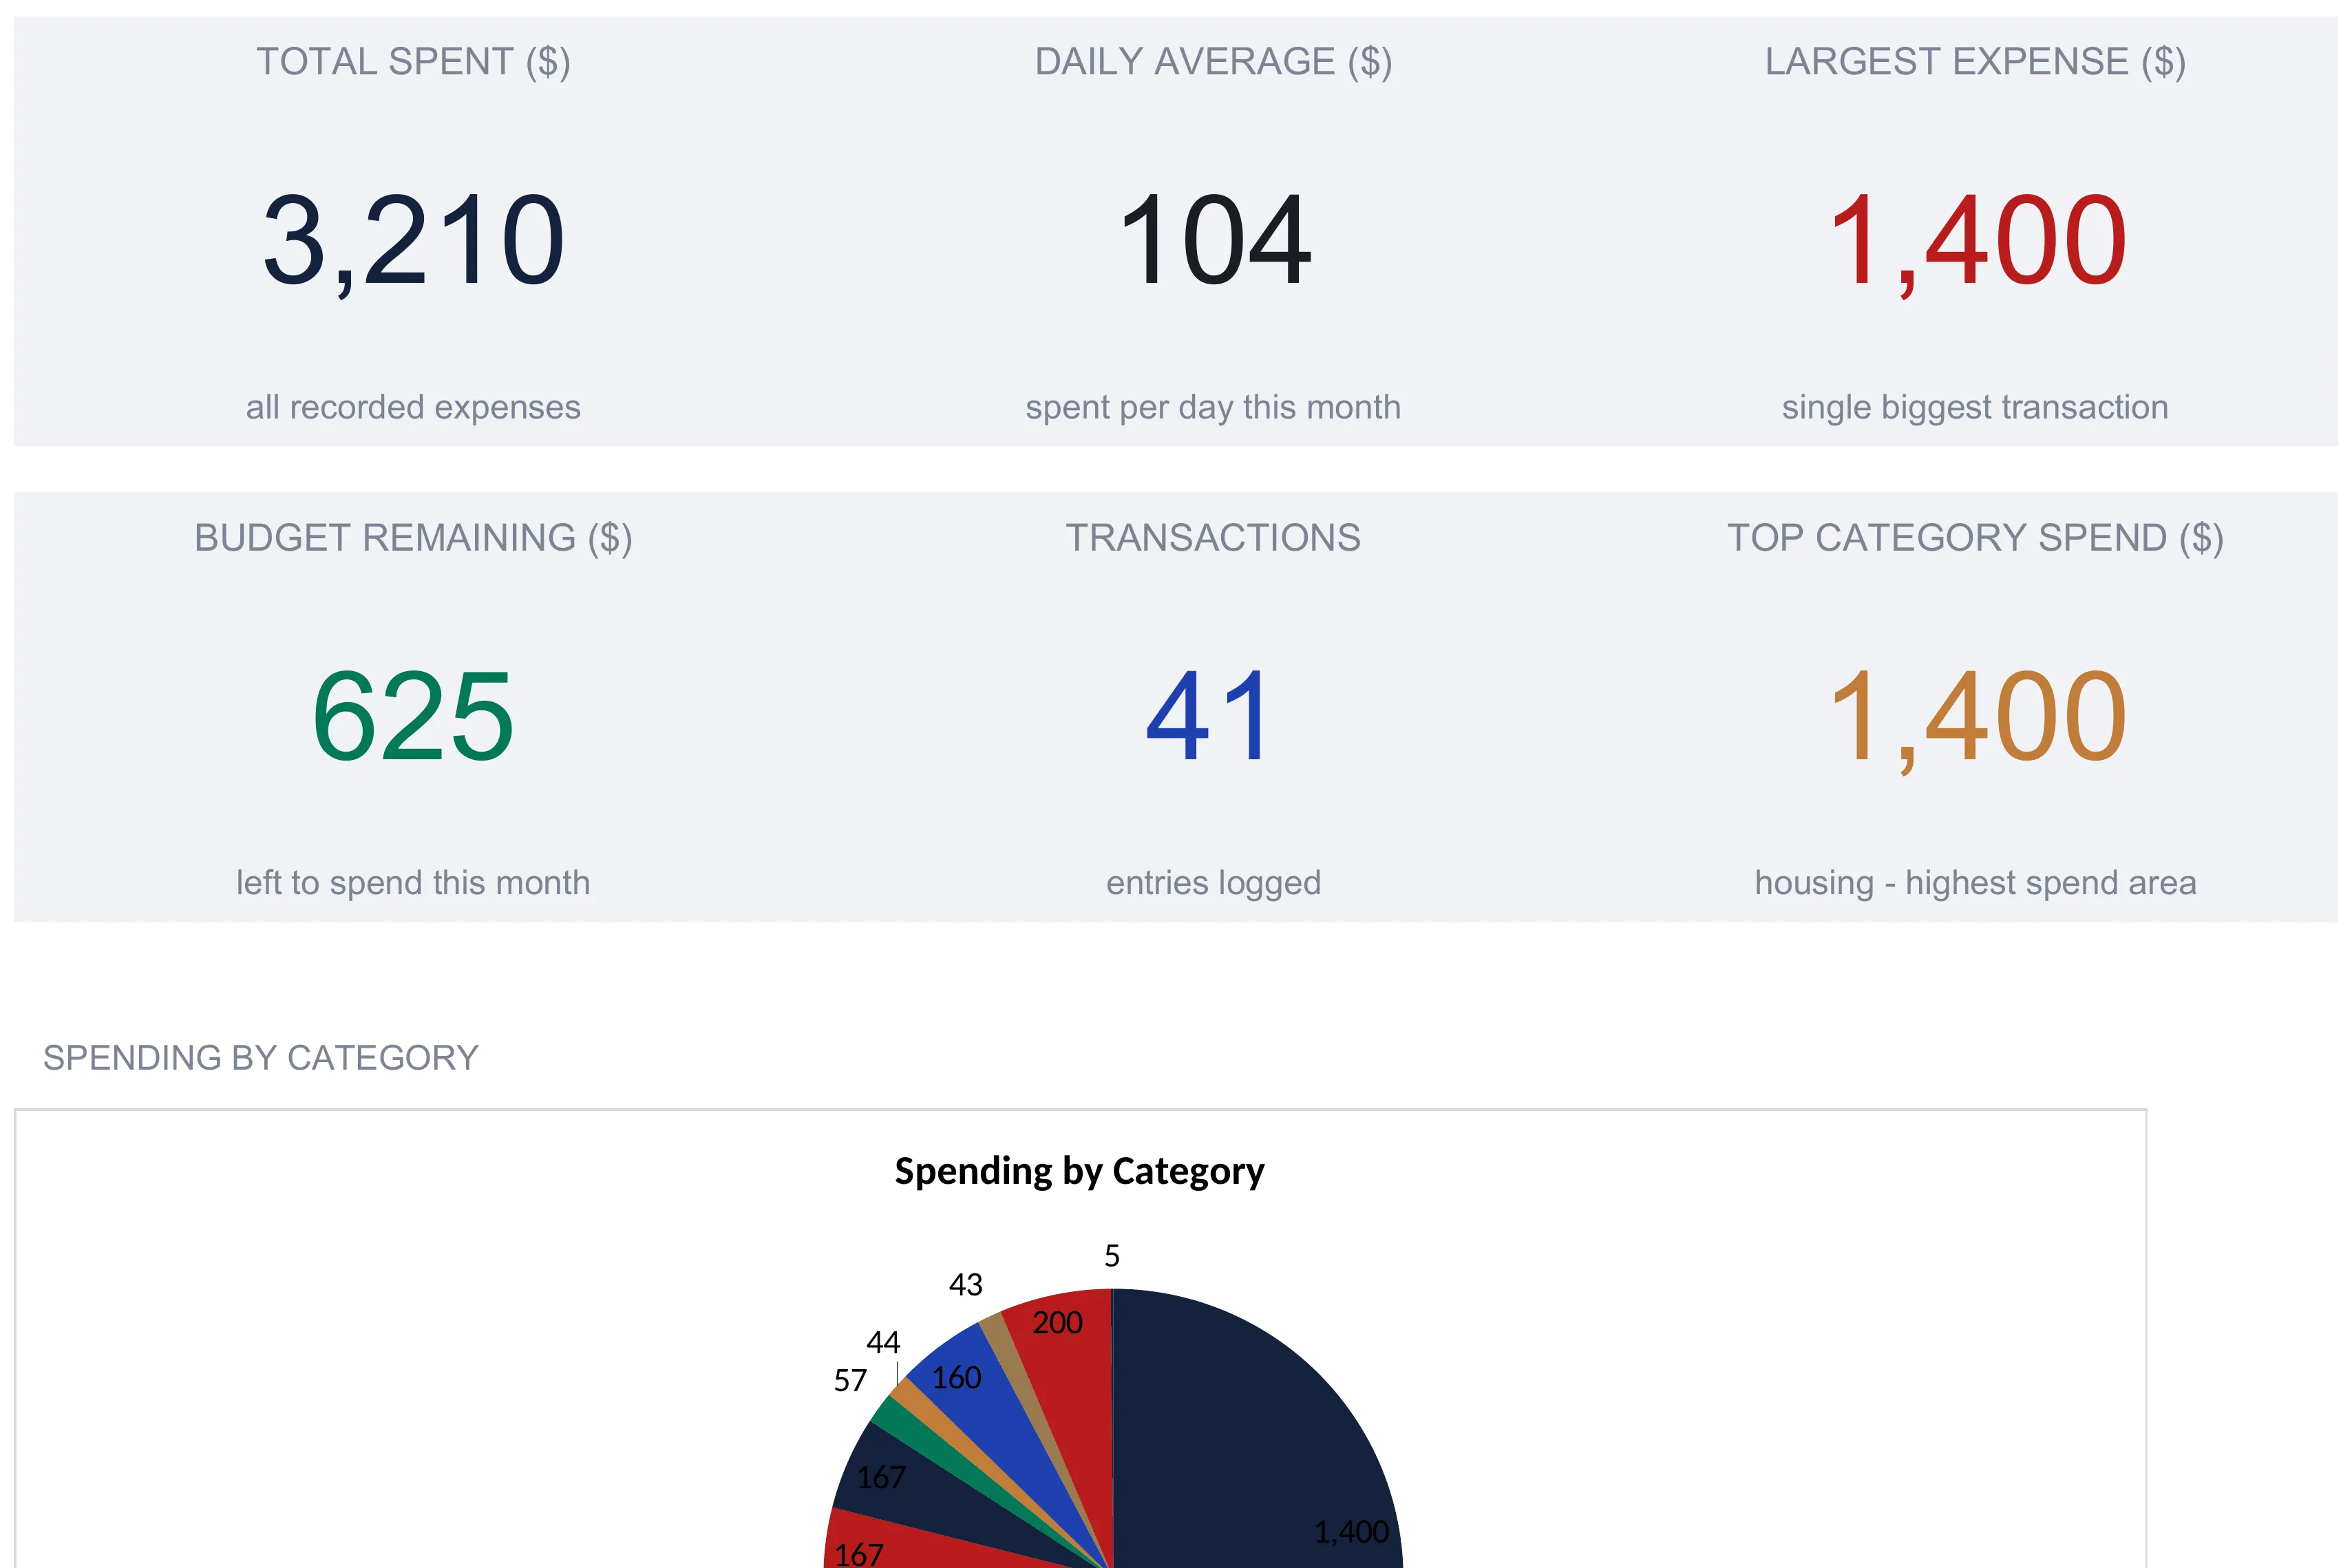
With the log filled and the summaries reading from it, the Dashboard states the month in a single screen. Six tiles run across the top, each one a live formula, not a typed figure.
| Tile | Sample value | What it reads |
|---|---|---|
| Total Spent | $3,209.93 | The log’s amount total |
| Daily Average | $103.55 | Total divided by days in the month |
| Largest Expense | $1,400 | The biggest single amount in the log |
| Budget Remaining | $625.07 | Planned total minus actual spending |
| Transactions | 41 | The count of logged entries |
| Top Category Spend | $1,400 | The largest category total |
The Top Category tile does one extra thing worth noting: it names the category as well as the amount, reading “housing - highest spend area” underneath the figure, because it looks up which category holds that largest total rather than just reporting the number. Below the tiles, a Spending by Category pie chart plots each category’s share, with Housing’s slice dominating the circle exactly as its 43.6% would suggest, and a second chart compares planned against actual by category. The dashboard is not introducing new data here. Every tile and both charts trace back to the log and the summary sheets, gathered in the one place you would look first.
The value of putting these six on one screen is that they answer different questions at once. Total Spent and Transactions describe volume, Daily Average and Largest Expense describe shape, and Budget Remaining and Top Category describe whether the month is going to plan. A single balance can hide all of that. Six tiles cannot.
Total spent, daily average, and budget utilization in plain terms
A few of the figures carry names that sound more technical than the math behind them. All of them are divisions or subtractions of numbers the log already holds.
Total Spent ($3,209.93) is just the sum of every amount in the log. It is the anchor every other figure divides or subtracts from.
Daily Average ($3,209.93 ÷ 31 = $103.55) is total spending spread over the days in the month. The sample month is August, so the divisor is 31 rather than the number of days that actually had a purchase, which keeps the figure steady from month to month.
Budget Remaining ($3,835 - $3,209.93 = $625.07) is what is left of the planned total after actual spending, the same figure the Budget vs Actual sheet reports as remaining budget.
Budget Utilization ($3,209.93 ÷ $3,835 = 83.7%) is the share of the plan that has been spent. It and Budget Remaining are two views of one fact, one in dollars and one as a percentage, and the percentage is the one that compares cleanly across months where the planned totals differ.
None of these require you to do the arithmetic. They are here so that when a tile reads 83.7% or $103.55, it is clear where the number came from and what it is measuring. The Consumer Financial Protection Bureau’s own budgeting guidance describes the same basic loop, sorting spending into categories like housing and utilities and then reviewing it, which is exactly the loop these sheets automate.
Excel or Google Sheets for expense tracking
The tracker is a single .xlsx file built on ordinary formulas, with no macros and no add-ons, so it behaves the same in Microsoft Excel and in Google Sheets after an upload. The dropdowns, the category sums, the rankings, and the charts all carry across intact. Google Sheets suits anyone who logs a purchase from a phone on the way out of a shop, since the file syncs and the log is a few taps to update. Excel suits anyone who prefers a local file and a desktop keyboard for a monthly catch-up session. The structure described here, one log feeding a stack of summaries, is equally buildable in either program, and the spreadsheet template ships in a form that opens in both.
Which expense tracker fits the way you track
The same idea comes in three tiers, and they differ by how much the file does once the log is full.
- The free Expense Tracker is the log with two cards above it, total spent and the number of rows filled in, which fits anyone who wants to record transactions and read the raw list for now.
- The Expense Tracker Essentials ($19) adds a dashboard and a monthly summary on top of the log, so the categories total themselves without the fuller budget and trend machinery.
- The Expense Tracker Ultimate Spreadsheet Template ($29) is the workbook this walkthrough follows: the log, the Monthly Summary, Budget vs Actual, the 12-Month Overview, Spending Trends, and the six-tile dashboard, for the reader who wants the plan-versus-actual comparison and the yearly view as well as the record.
A close companion in the same family is the Bill Tracker Ultimate Spreadsheet Template ($29), which handles the other half of the picture. An expense tracker is built around variable, one-off spending logged after the fact, while a bill tracker is built around recurring, dated obligations you want to see before they arrive. Some people run both, one for the fixed bills and one for everything else, since the two describe money that behaves in genuinely different ways.
Related
- Expense Tracker vs Budget Template - What’s the Difference?, on when tracking alone is enough and when a planned target earns its place
- Free Expense Tracker Google Sheets Template (5-Minute Setup), covering the free routes into spending tracking and the signs you have outgrown a plain log
- How to Build a 50/30/20 Budget in a Spreadsheet, the same log-and-summarize structure applied to a needs, wants, and savings split
Frequently asked questions
How is the Monthly Summary different from the Spending Trends sheet?
Both summarize the same category totals, but they answer different questions. The Monthly Summary lists all thirteen categories in a fixed order with a transaction count, an average per transaction, and a share of the total, so it reads like an itemized statement. Spending Trends re-sorts those same categories from largest to smallest and adds a second table that breaks the month down by payment method, so it reads like a ranking. One is the ledger view, the other is the leaderboard view.
How many transactions can the Expense Log hold?
The sheet is built for up to 200 entries, which its own header note states, and the totals formulas already cover the full range. The worked month uses 41 of those rows. The next transaction goes on the first empty row and every summary, chart, and dashboard tile updates on its own, with no formula to copy down and no range to extend.
Why does the daily average divide by the days in the month rather than the days I actually spent?
The Daily Average tile divides total spending by the number of days in the calendar month of the earliest logged date, not by the count of days that had a transaction. In the worked month that is August, so $3,209.93 is divided by 31 to give about $103.55. Dividing by a fixed month length keeps the figure comparable from one month to the next rather than swinging with how many days happened to have an entry.
Can one file track more than a single month?
The 12-Month Overview sheet holds a column for every month from January to December. The August column reads live from the Expense Log, and the remaining months are cells you type a total into as the year progresses, which the sheet says directly in its header. The Annual Total column and the average-monthly-spending figure build from whatever months are filled, so a full year lives in one file even though only the current month is calculated automatically.
Does changing the currency convert the amounts?
No. The dashboard carries a currency selector with 35 symbols, and choosing one relabels every money column and tile across the workbook at once. It changes the symbol shown, not the numbers themselves, so a $1,400 figure becomes a 1,400 figure in the new symbol with no exchange-rate math applied.
Sources
- Budgeting: How to create a budget and stick with it - Consumer Financial Protection Bureau
About this article
Every figure, sheet name, column heading, formula, and dashboard tile checked on 2026-09-10 against the shipped Expense Tracker Ultimate workbook (Dashboard, Expense Log, Monthly Summary, Budget vs Actual, 12-Month Overview, Spending Trends, How to Use), and the free and Essentials tiers checked against their own shipped workbooks. The Consumer Financial Protection Bureau budgeting reference was checked against its live page at writing time. Last reviewed September 2026.