
A Q3 financial review runs the same seven-section checkup as a mid-year review, done two and a half months later against 8 months of data with 4 months of runway left. That shorter runway is the point: Q3 is the last window where 401(k), IRA, and HSA contribution pacing, W-4 withholding, and open-enrollment choices still change year-end numbers before their deadlines. This checklist walks YTD vs targets, net worth, a tax check-in ahead of the September 15 estimate, contribution-pace math against the 2026 limits, insurance, goals, and a pre-November list worth saving.
Mid-year reviews catch drift. Q3 reviews catch what’s still fixable.
A Q3 review is the same exercise as the mid-year review, run two and a half months later on the same spreadsheet and similar table layouts. The framing is what changes. In June, you have 6 months of runway and 6 months of past. By August, the runway is shorter than the past, and the decisions that move year-end numbers, contribution pacing, withholding, and open enrollment, all have deadlines three to four months out. The Annual Budget Template holds the YTD data; the sections below give the questions to ask in each part of the review and a pre-November checklist worth saving.
Plan on 45 to 75 minutes if data is already in a tracker. Longer the first time, when you’re pulling 8 months of statements together.
Why Q3 timing matters
Three reasons the August-September window is different from June.
Contribution-limit math becomes real. With 8 months elapsed, the per-paycheck rate needed to hit a 2026 annual cap is either on pace or not. Closing a gap in the last 4 months requires actual changes to payroll elections. The earlier those changes happen, the smaller each per-paycheck adjustment.
Open enrollment is on the calendar. Most employer benefits enrollment runs mid-October to mid-November. ACA Marketplace open enrollment is typically November 1 to January 15. Decisions now (HSA vs PPO, FSA, life and disability) lock in for next year.
Q3 estimated tax is a known number. The September 15 deadline (the Q3 Estimated Tax Prep worksheet covers the math) means by mid-August, the YTD picture is clear enough to size the payment.
Mid-year reviews are pattern recognition. Q3 reviews are decisions on actual dates.
Pull these six files before you sit down
Gathered up front so you’re not jumping back and forth later.
| Input | What it tells you |
|---|---|
| Bank and credit card statements, Jan through Jul or Aug | YTD spending by category |
| Investment and retirement account statements (Jan 1 and most recent) | Net worth change, contribution totals |
| Most recent paystub | YTD income, YTD federal/state withholding, retirement deferrals |
| Most recent tax return | Prior-year tax liability, baseline for safe harbor math |
| Health plan summary (current year) | YTD deductible, out-of-pocket spend |
| Mid-year review notes, if any | What was flagged to watch in the second half |
If the mid-year review didn’t happen, that’s fine. The Q3 review still works with one checkpoint instead of two; the “what changed since June” comparison is replaced with “what does the YTD picture say.”
Section 1: YTD vs annual targets
The first pass. For each category, compare what was planned for 8 months with what was spent, January through August.
| Category | YTD plan (8 mo) | YTD actual | Variance | Variance % | Year-end projection |
|---|---|---|---|---|---|
| Housing | 19,200 | 19,200 | 0 | 0% | On plan |
| Groceries | 7,600 | 8,820 | +1,220 | +16% | ~13,200 (plan: 11,400) |
| Dining | 2,240 | 3,360 | +1,120 | +50% | ~5,000 (plan: 3,360) |
| Subscriptions | 760 | 1,180 | +420 | +55% | ~1,770 (plan: 1,140) |
| Travel | 2,000 | 2,950 | +950 | +48% | ~4,400 (plan: 3,000) |
| Transportation | 1,920 | 1,720 | -200 | -10% | ~2,580 |
The projection column is what’s new for Q3. Categories trending over by 15 to 50 percent at month 8 usually hold the trajectory through December unless something changes. A 50 percent overage on dining projected forward lands about $1,640 over annual plan - that’s the size of the next-quarter decision in dollars.
A target running 50 percent over for 8 months rarely closes by under-spending the rest of the year. The honest options are usually: re-baseline the category, accept the overage and find offsetting room elsewhere, or change the underlying behavior.

The Key Metrics band on the Summary tab of the Premium Annual Budgeting Planner reports savings rate and true savings rate against plan, expense ratio, emergency fund coverage in months, and the year’s best and worst month. The per-category YTD plan versus actual comparison sits on the Annual Plan tab.
Section 2: net worth change since January
A single number with composition. Same shape as the mid-year version, eight months of data.
Net worth, Jan 1:        285,400
Net worth, current:      318,700
Change:                  +33,300  (+11.7%)
Decompose by source:
- Cash and checking: +4,800
- Brokerage and retirement: +21,500 (contributions: 14,200; market: +7,300)
- Home equity (if owned): +5,200
- Vehicles: -1,800 (depreciation)
- Debt principal paid down: +3,600
Total: +33,300.
Contribution-driven growth is repeatable; market growth is partly luck; home equity is paper until sale. The Q3 angle: the contribution number (14,200 here) is the lever still movable in the next 4 months. The market portion can do anything between now and December.
If net worth is down YTD, the same decomposition shows whether it’s the market doing market things, a planned withdrawal, or a slower leak worth understanding.
Section 3: tax check-in
Q3 is the tax checkpoint where adjustments still fit before year-end.
Pace check. Take YTD federal withholding from the latest paystub. Divide by 8, multiply by 12. Compare to last year’s total federal tax (Form 1040, line 24). If projected withholding falls more than 5 percent below last year’s tax, the next-quarter question is whether to true up via a W-4 update or via a Q3 or Q4 estimated payment.
Safe harbor math. The IRS underpayment safe harbor is the smaller of 90 percent of current-year tax or 100 percent of prior-year tax (110 percent if prior-year AGI was over $150,000). At 8 months in, YTD data projects current-year tax with reasonable accuracy. The penalty is calculated per quarter, so a Q3 estimated payment by September 15 closes more of the gap than the same dollars paid in January.
Deduction tracking. YTD charitable giving, mortgage interest, state and local taxes, medical expenses for itemizers. If the year is shaping up to itemize, low-running categories matter. If standard deduction is the cleaner path, the tracking matters less.
The Q3 Estimated Tax Prep worksheet walks through the September 15 calculation in detail. The Annual Tax Planner holds the inputs that calculation starts from: income logged by type with an editable rate on each, deductions and credits netted down to a tax liability, and a quarterly sheet carrying the four due dates for recording what was paid. The safe harbor comparison itself stays a manual calculation.
Section 4: retirement contribution pace
The section that’s specifically different at Q3 vs mid-year. With 8 months elapsed, the math on annual contribution limits is concrete.
The 2026 limits, from the IRS retirement release for 401(k) and IRA figures and Revenue Procedure 2025-19 for the HSA figures:
| Account | 2026 limit | Catch-up (50+) | Catch-up (60-63, 401k) |
|---|---|---|---|
| 401(k) / 403(b) / 457(b) | 24,500 | +8,000 | +11,250 |
| Traditional or Roth IRA | 7,500 | +1,100 | n/a |
| HSA (self only) | 4,400 | +1,000 (55+) | n/a |
| HSA (family) | 8,750 | +1,000 (55+) | n/a |
For each account, the Q3 question has the same shape: YTD contribution, gap to the annual cap if the cap is in scope, and the per-paycheck rate that closes the gap.
401(k) pace math (worked example). YTD deferrals: $14,800 on 16 of 24 paychecks. Annual limit: $24,500. Gap: $9,700 over 8 paychecks, or about $1,213 each. If the current rate is $925 per paycheck, closing the gap would mean about $288 more per paycheck. Whether that fits cash flow is a separate question; the math is just the math.
IRA pace math. YTD $4,200 contributed, $7,500 limit, $3,300 gap. Evenly spread, $825/month through December. IRA contributions can also be made in a lump sum up until the tax filing deadline the following April.
HSA pace math. A 2026 family HDHP with payroll contributions caps at $8,750. YTD $5,400 across 16 paychecks leaves $3,350 over 8 paychecks - about $419 per paycheck. Note: starting in 2026, catch-up contributions for participants with Social Security wages above a projected $150,000 threshold go in as Roth (after-tax) rather than pretax.
FSA reminder. Most FSAs are use-it-or-lose-it (limited carryover depending on employer). The 2026 healthcare FSA cap is $3,400; an election at that cap with $1,400 spent through August leaves $2,000 to use in 4 months, or $500/month in eligible expenses. Worth knowing for next year’s election: under OBBBA, the Dependent Care FSA cap rises to $7,500 per household (from $5,000) starting in 2026, the first material change to the DCFSA limit since the 1980s.
None of this is framed as a push to hit any cap. Whether maxing out a 401(k), IRA, or HSA fits a given year depends on cash flow, other priorities, and short-term goals. The Q3 review surfaces where the year is currently pointing.
Section 5: insurance review and open enrollment timing
The Q3 framing differs from mid-year. In June the question is “is anything out of date.” In August or September it adds “and what’s the open enrollment date for the change.”
- Employer open enrollment: typical mid-October to mid-November. Confirm exact dates with HR.
- ACA Marketplace open enrollment: typically November 1 through January 15.
- Medicare open enrollment (if applicable): October 15 through December 7.
- HSA-eligible plan vs PPO comparison done? YTD medical spend shows which plan would have worked this year.
- FSA election for next year, based on this year’s actual spend.
- Life insurance: still appropriate for current dependents and debt? Beneficiary still correct?
- Auto, home, umbrella: re-quote cycle. Every 2-3 years tends to surface savings without overdoing it.
Mid-year surfaces what to look at. Q3 schedules the decisions on actual dates.
Section 6: goals - on, off, or revised
Same structure as the mid-year version. Three columns: target, on-pace at month 8, actual at month 8.
| Goal | 2026 target | On-pace at Aug | Actual at Aug | Status |
|---|---|---|---|---|
| Emergency fund to 15,000 | 15,000 by Dec | 13,300 | 12,400 | Slightly behind |
| Roth IRA max | 7,500 by Dec | 5,000 | 4,200 | Behind, pace check |
| Pay off Card A | 0 by Sep | 0 by now | 350 | Slipped at end |
| Vacation savings | 3,000 by Aug | 3,000 | 3,000 | Hit on time |
| Annual giving | 4,800 by Dec | 3,200 | 1,900 | Behind |
For each off-track goal, the Q3 question is sharper than the mid-year one: revise the target, accept the miss, or change the next-4-months number. A goal that’s been behind for 8 months rarely catches up in 4. The honest moves are usually re-sizing or extending the timeline. Either works; carrying the original number into December without a behavior change tends to end in frustration.
Goals hit early are also informative. A vacation-savings goal hit in August either means the target was conservative or the year ran better than expected. Either is useful input for next year’s planning.
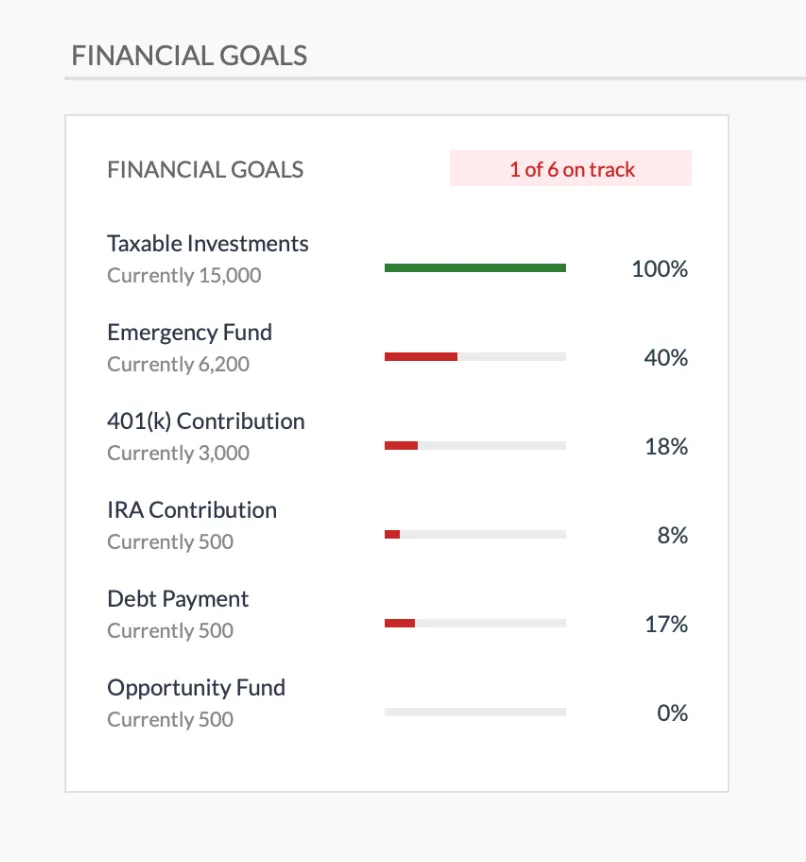
The Financial Goals panel on the Summary tab of the Premium Annual Budgeting Planner shows each target’s progress and counts how many are on pace. Goal names, targets, starting balances and current amounts go on the Annual Financial Goals tab, which works out how much is left and the monthly pace so far.
Section 7: Q4 planning items worth surfacing now
The section the mid-year review doesn’t have. Items visible at Q3 but easier to act on now than in late November.
- Charitable giving. Donor-advised fund contributions, appreciated-stock donations, and bunching strategies all clear faster in September or October than in December.
- Tax-loss harvesting. Brokerage losses can be harvested any time. November-December is when most retail investors look; earlier reviews surface candidates before the late-year crowd.
- Roth conversion math. A Roth conversion before year-end shifts that income into the current tax year. The size that makes sense depends on current marginal bracket and projected future bracket. Q3 still leaves time to model scenarios.
- RMD timing. Required Minimum Distributions for those 73+ have a December 31 deadline. Q3 surfaces what’s been taken and what’s still owed.
- 529 contributions. Some states tie a deduction to current-year contributions. Q3 is the check on whether YTD matches the cap.
- Annual gift-tax exclusion. For 2026, the per-recipient gift exclusion is $19,000. Tracking YTD through year-end is useful for anyone gifting near the limit.
These belong in the notes that come out of the review, with a target date on each.
The pre-November checklist
The piece worth saving. Items that fit better before Halloween than during the late-November and December holiday crush.
- 401(k) election adjusted if contribution pace is off and changing it is in scope. By late October, most plans process changes within 1-2 paychecks.
- W-4 updated if withholding is off pace for safe harbor or for tax-bill smoothing.
- Open enrollment decisions noted - HSA vs PPO, FSA election, life and disability coverage, dependent care FSA if applicable.
- Q3 estimated tax paid by September 15. One-line entry in the tracker.
- HSA contribution pace checked against annual cap and family plan rules.
- FSA balance measured against eligible spending plans for November-December.
- Charitable giving schedule for year-end finalized. If bunching, the DAF or direct stock transfer set up before December crowding.
- Loss harvesting candidates identified.
- Required Minimum Distributions checked and scheduled if 73+.
- 529 contribution topped up if state deduction applies.
- Beneficiary review on retirement accounts and life insurance, if any life event happened this year.
- Next review scheduled - the year-end version in late December or early January.
Twelve items. Most people action four or five. Skip the ones that don’t apply.
When the review hands off
Q3 reviews surface causes; they don’t fix them. A category running over for 8 months, a savings rate sagging across three quarters, a contribution pace that doesn’t add up to the retirement someone has in mind - the spreadsheet can name those, then it’s done.
A completed Q3 review is also useful as input for a fall conversation with a CPA or advisor. The numbers in the sheet (projected tax, safe harbor gap, contribution pace) are exactly the inputs those conversations tend to start from.
The templates that hold this review’s data
The three files that hold the data this review needs.
- Annual Budget Template - The 12-month structure that makes a Q3 review take an hour. Plan and actual columns for every category in all 12 months, with monthly averages, YTD totals and the variance against plan, rolled up on a Summary tab. For people who want one place to plan, track, and look back.
- Annual Tax Planner - Income logged by type with the tax withheld on each entry, deductions and credits netted into a tax liability, and a quarterly log for the four payment dates. Pairs with the Q3 estimated tax worksheet and the year-end picture.
- Monthly Budget Template - One month at a time: budget and actual by category, with the actual side summed from the transaction log and a Summary dashboard on top. For people who want category targets set a month at a time rather than a year at once.
The two budgeting templates ship with the same category lists, so adding one after the other doesn’t mean rebuilding the category structure. The tax planner works from its own income types and deduction categories.
Related
- Mid-Year Financial Review: A Template for Checking In - The June or July version of the same exercise, run 2-3 months earlier with more runway.
- Q3 Estimated Tax Prep 2026 (Sept 15 Deadline Worksheet) - The dedicated worksheet for the September 15 estimated tax payment.
- End-of-Year Budget Review Template: A 12-Month Retrospective - The November or December version, run on a full calendar year of data.
- Year-End Financial Review: 10 Questions to Ask Yourself - A reflective companion piece for the December version of this review.
- Q2 Financial Check-In: Are You On Track? - The lighter spring checkpoint that this review builds on.
- How to Set Financial Goals for the Rest of the Year - What to do with the goal gaps Section 6 surfaces.
Frequently asked questions
Why a Q3 review on top of mid-year?
The mid-year review (June) and Q3 review (August/September) are different - mid-year is the half-time snapshot; Q3 is the year-end runway view. With 4 months left, Q3 is when contribution-limit, tax, and insurance decisions still have time to take effect.
How long does this take?
About 45 to 75 minutes if you already have a tracker running. Longer if you're pulling 8 months of statements together for the first time.
What changed since mid-year?
Q3 economic data, the actual Q3 estimated tax payment (Sept 15), updated open-enrollment dates, and the realization of whether YTD numbers are tracking ahead or behind the annual targets.
Should I share this with my CPA or advisor?
Many people do. The completed checklist becomes a useful input for a fall planning conversation. A CPA can quickly tell you whether the YTD numbers suggest any specific year-end moves.
Sources
About this article
2026 401(k) and IRA contribution limits checked against the linked IRS release. HSA, FSA, and annual gift-exclusion figures checked against IRS Revenue Procedures 2025-19 and 2025-32. Template sheets, inputs and outputs checked on 2026-09-10 against the shipped Annual Budgeting Planner (Summary, Annual Plan, Annual Financial Goals), Annual Tax Planner (Dashboard, Income, Deductions, Quarterly) and Monthly Budgeting (Summary, Budget Plan, Transactions) files. Last reviewed September 2026.