
On $500,000, a 4.42% Treasury throws off about $22,100 a year and a 3.5% dividend ETF about $17,500, a $4,600 pre-tax gap. After tax that gap can shrink to near zero, because qualified dividends are taxed at capital-gains rates while bond interest is taxed as ordinary income. This walkthrough compares the two on after-tax income, price volatility, and income growth, then scales the same math to $1M and $2M targets. The numbers are illustrative, not picks.
An income-focused investor opens two browser tabs. One shows a 10-year Treasury yielding 4.42 percent. The other shows a dividend ETF yielding 3.5 percent. On $500,000, the first produces about $22,100 a year and the second about $17,500. A $4,600 gap. Done?
Not quite. That side-by-side has at least three columns the browser tabs hide: after-tax income (which moves with bracket), price volatility, and how the income stream grows over a decade. This walkthrough builds the comparison on a sample portfolio and scales the same math to higher income targets, so the trade-offs are visible rather than implied.
The two yield numbers most articles stop at
A bond’s yield to maturity (YTM) and a stock’s dividend yield are the headline numbers. Both are quoted as annual percentages. Both are easy to multiply by a portfolio balance.
As of early May 2026, the Federal Reserve H.15 release showed:
| Instrument | Yield |
|---|---|
| 3-month Treasury bill | 3.70% |
| 2-year Treasury | 3.95% |
| 10-year Treasury | 4.42% |
| 30-year Treasury | 4.98% |
| S&P 500 (broad market) | ~1.06% |
| Dividend-focused ETFs (e.g. SCHD-style) | 3.0% to 3.8% |
| High-yield (“junk”) bond ETFs | 6% to 8% |
The first column gives you pre-tax income on principal. Multiply by your position size; that’s the run-rate. The 10-year Treasury at 4.42 percent on $500,000 produces $22,100 a year. A dividend ETF at 3.5 percent on the same balance produces $17,500. The Treasury column produces $4,600 more in this comparison.
That is the first column, not the whole picture.
Setting up the spreadsheet
Two sheets, one summary. Same structure whether the portfolio is $500K, $1M, or $2M.
Bonds sheet - one row per holding:
| Column | Example |
|---|---|
| Instrument | 10Y Treasury |
| Position ($) | 200,000 |
| Coupon / YTM (%) | 4.42 |
| Annual interest ($) | =Position × Yield |
| Frequency | Semi-annual |
| Tax type | Federal ordinary, state-exempt for Treasuries |
| Federal bracket (%) | 32 |
| State bracket (%) | 5 |
Dividend stocks sheet - one row per holding or fund:
| Column | Example |
|---|---|
| Ticker | SCHD |
| Position ($) | 200,000 |
| Dividend yield (%) | 3.50 |
| Annual dividend ($) | =Position × Yield |
| Frequency | Quarterly |
| Tax type | Qualified |
| Federal qualified-div rate (%) | 15 |
| State bracket (%) | 5 |
Summary - eight rows tying the two together:
| Metric | Bonds | Dividend stocks |
|---|---|---|
| Position total | =SUM(bonds) | =SUM(stocks) |
| Pre-tax annual income | =SUMPRODUCT | =SUMPRODUCT |
| Federal tax | =income × fed_rate | =income × qualified_rate |
| State tax | =income × state_rate | =income × state_rate |
| After-tax income | =pre_tax - taxes | =pre_tax - taxes |
| Effective after-tax yield (%) | =after_tax / position | =after_tax / position |
| 5-year income growth assumption | 0% | 5% |
| Projected year-5 income | =income × (1+g)^5 | =income × (1+g)^5 |
Eight rows is enough to surface the gaps. A more detailed walkthrough of the portfolio-tracker structure underneath is in the investment returns tracker post.
Pre-tax math: where most comparisons end
A $500,000 portfolio split 50/50:
| Bonds (50% = $250K) | Dividend stocks (50% = $250K) | |
|---|---|---|
| Yield | 4.42% (10Y Treasury) | 3.50% (broad dividend ETF) |
| Annual income | $11,050 | $8,750 |
| Combined pre-tax | $19,800 |
Tilt 100% to bonds: $22,100. Tilt 100% to dividend stocks: $17,500. The 92 basis-point yield gap looks decisive at this stage. Most online comparisons stop here.
After-tax math: the column most articles skip
The IRS treats the two income streams differently. From IRS Topic 404: ordinary dividends are taxed at ordinary income rates. Qualified dividends, which most US large-cap stock dividends are, qualify for long-term capital gains rates (0, 15, or 20 percent federal depending on income). Bond interest is taxed as ordinary income. Treasuries add a quirk: their interest is federally taxable but exempt from state and local tax.
For a household with $250,000 in taxable income (32 percent federal marginal, 5 percent state):
Bond income ($22,100 from Treasuries):
- Federal tax: 22,100 × 32% = $7,072
- State tax: $0 (Treasuries exempt)
- After-tax: $15,028
- Effective after-tax yield: 3.01%
Dividend income ($17,500 from qualified-dividend ETF):
- Federal tax: 17,500 × 15% = $2,625
- State tax: 17,500 × 5% = $875
- After-tax: $14,000
- Effective after-tax yield: 2.80%
The pre-tax gap of $4,600 shrinks to $1,028. The qualified-dividend rate does most of the work. Replace the Treasury with a taxable corporate bond (not state-exempt) and the bonds line gets worse:
Corporate bond income ($22,100 at 4.42% on a corporate):
- Federal: $7,072
- State: $1,105
- After-tax: $13,923
- Effective after-tax yield: 2.78%
Now the two columns land within $80 of each other. The order has flipped from a $4,600 pre-tax gap to essentially a tie after tax, before any other factor.
To run this conversion on your own bracket and yield, the after-tax return calculator does the same arithmetic the spreadsheet’s tax rows do:
The same math at lower brackets goes the other way. A household with $80,000 of total income falls in the 12 percent federal bracket. Qualified dividends are taxed at 0 percent at that level; bond interest is taxed at 12 percent federal plus state. The dividend column gets a tax-free pass. Both extremes are illustrative - the bracket matters as much as the yield.
What about tax-advantaged accounts?
Inside an IRA, Roth, or 401(k), neither bond interest nor dividends are taxed until withdrawal (and qualified Roth distributions are tax-free). The after-tax penalty on bonds disappears. In a taxable account the annual tax bite compounds against you year after year, the erosion a tax-drag calculator isolates. One common tracker practice is to tag each holding with an account type and adjust the tax line per holding rather than per asset class. Whether the placement of bonds in tax-deferred and dividends in taxable matches a specific situation depends on cash-flow needs, withdrawal timing, and tax forecasts a generic article cannot know.
Volatility: the column dividend-yield charts hide
A 10-year Treasury yielding 4.42 percent has price risk too. If rates rise 1 percentage point, the bond’s price drops roughly 8 percent (using the modified-duration approximation for a 10-year). If rates rise 2 points, roughly 16 percent. Coupons keep paying, but anyone forced to sell mid-cycle realizes the price loss.
Dividend stocks are more volatile day to day. The S&P 500 has historically shown an annualized standard deviation around 15 to 18 percent. Dividend-focused ETFs run slightly lower than the broad market but well above investment-grade bond ETFs.
A useful tracker column: maximum drawdown over the past 10 years, by holding. For broad reference:
| Asset | Approximate max drawdown, 2015-2025 |
|---|---|
| 10-year Treasury | -15% (2022 rate cycle) |
| Investment-grade corporate bond ETF | -18% |
| S&P 500 | -34% (2020 pandemic) |
| Dividend-focused ETF (SCHD-style) | -27% |
| High-yield bond ETF | -22% |
The dividends themselves were less affected than the prices. SCHD continued paying through 2020. Most large-cap dividend stocks continued paying through the 2022 selloff. Coupon payments on investment-grade bonds continued through both. Income streams are sturdier than mark-to-market values; the trade-off is whose price column gets uglier in a given environment. The income column matters when principal stays put. The price column matters when principal might be sold mid-cycle.
Growth: the column bond coupons skip
A 10-year Treasury issued today pays 4.42 percent. In 2031 it still pays 4.42 percent on the original face value. The coupon does not grow.
A dividend stock’s payout often grows. The S&P 500 dividend growth rate has averaged roughly 5 to 7 percent annually over the past two decades; broad dividend-growth ETFs target companies with consistent annual raises. Past growth is not promised growth, and dividend cuts happen (most visibly in 2008-09 and the 2020 oil shock).
Project both forward five years on the same $500K:
| Bonds (100% = $500K) | Dividend stocks (100% = $500K) | |
|---|---|---|
| Year 1 income | $22,100 | $17,500 |
| Assumed annual growth | 0% | 5% |
| Year 5 income | $22,100 | $21,271 |
| Year 10 income | $22,100 | $27,148 |
The cross-over arrives around year 6. Past year 10, the dividend column compounds further; the bond column stays flat until reinvestment at the 2036 prevailing yield, which nobody knows.
Reverse the assumption and the order flips. If dividend growth halts at year 3 because of a recession, the bond column overtakes by year 4 and stays ahead. The growth assumption is the single largest lever in the long-horizon comparison, worth stress-testing rather than treating as fixed.
Sample portfolios at three income targets
Three illustrative portfolios. The income targets are arbitrary; the mix is shown to make the math concrete.
$500,000 portfolio aiming for $20,000 pre-tax annual income
| Holding | Allocation | Position | Yield | Income |
|---|---|---|---|---|
| 10-year Treasury | 50% | $250,000 | 4.42% | $11,050 |
| Dividend ETF | 35% | $175,000 | 3.50% | $6,125 |
| High-yield bond ETF | 15% | $75,000 | 6.50% | $4,875 |
| Total | $500,000 | avg 4.41% | $22,050 |
$1,000,000 portfolio aiming for $40,000 pre-tax annual income
| Holding | Allocation | Position | Yield | Income |
|---|---|---|---|---|
| 10-year Treasury | 40% | $400,000 | 4.42% | $17,680 |
| 30-year Treasury | 9% | $90,000 | 4.98% | $4,482 |
| Dividend ETF | 35% | $350,000 | 3.50% | $12,250 |
| Individual dividend stocks | 10% | $100,000 | 3.10% | $3,100 |
| Investment-grade corporate bond ETF | 6% | $60,000 | 5.20% | $3,120 |
| Total | $1,000,000 | avg 4.06% | $40,632 |
$2,000,000 portfolio aiming for $80,000 pre-tax annual income
| Holding | Allocation | Position | Yield | Income |
|---|---|---|---|---|
| 10-year Treasury | 30% | $600,000 | 4.42% | $26,520 |
| 30-year Treasury | 15% | $300,000 | 4.98% | $14,940 |
| Dividend ETF | 30% | $600,000 | 3.50% | $21,000 |
| Individual dividend stocks | 15% | $300,000 | 3.20% | $9,600 |
| Investment-grade corporate bond ETF | 10% | $200,000 | 5.20% | $10,400 |
| Total | $2,000,000 | avg 4.12% | $82,460 |
None of these are picks. They show how the spreadsheet rolls up. Swap weights, swap holdings, swap yields - the row math is the same. After applying a 32 percent federal bracket and 5 percent state to the $1M portfolio (with the Treasury portion state-exempt), after-tax income lands around $29,300, an effective yield near 2.93 percent. The same exercise on the dividend portion alone, at the 15 percent qualified rate, holds onto roughly 80 percent of the gross. That retention ratio is the more durable comparison.
The holding-level mechanics underneath the dividend column are a separate exercise. Yield on cost, DRIP cost-basis updates, and qualified vs ordinary classification all sit in the dividend income tracker walkthrough, which covers the column structure that feeds this summary.
What the spreadsheet does not decide
The math surfaces the trade-offs. It does not pick the mix. The columns expose questions they cannot answer. Volatility tolerance if equities drop 30 percent in a year. Whether income is needed in cash or reinvested. Current and expected future tax bracket. Holding horizon. Acceptable duration risk on the bond side. Different answers produce different mixes. The same $500K with the same yield curve produces $22,100 in pure Treasuries or $17,500 in pure dividend ETFs - 26 percent more income in one case, but flat for a decade. Past year 10 with dividend growth, the math reverses. Neither column leads on every metric.
Templates that fit this
Three different views of the same income math.
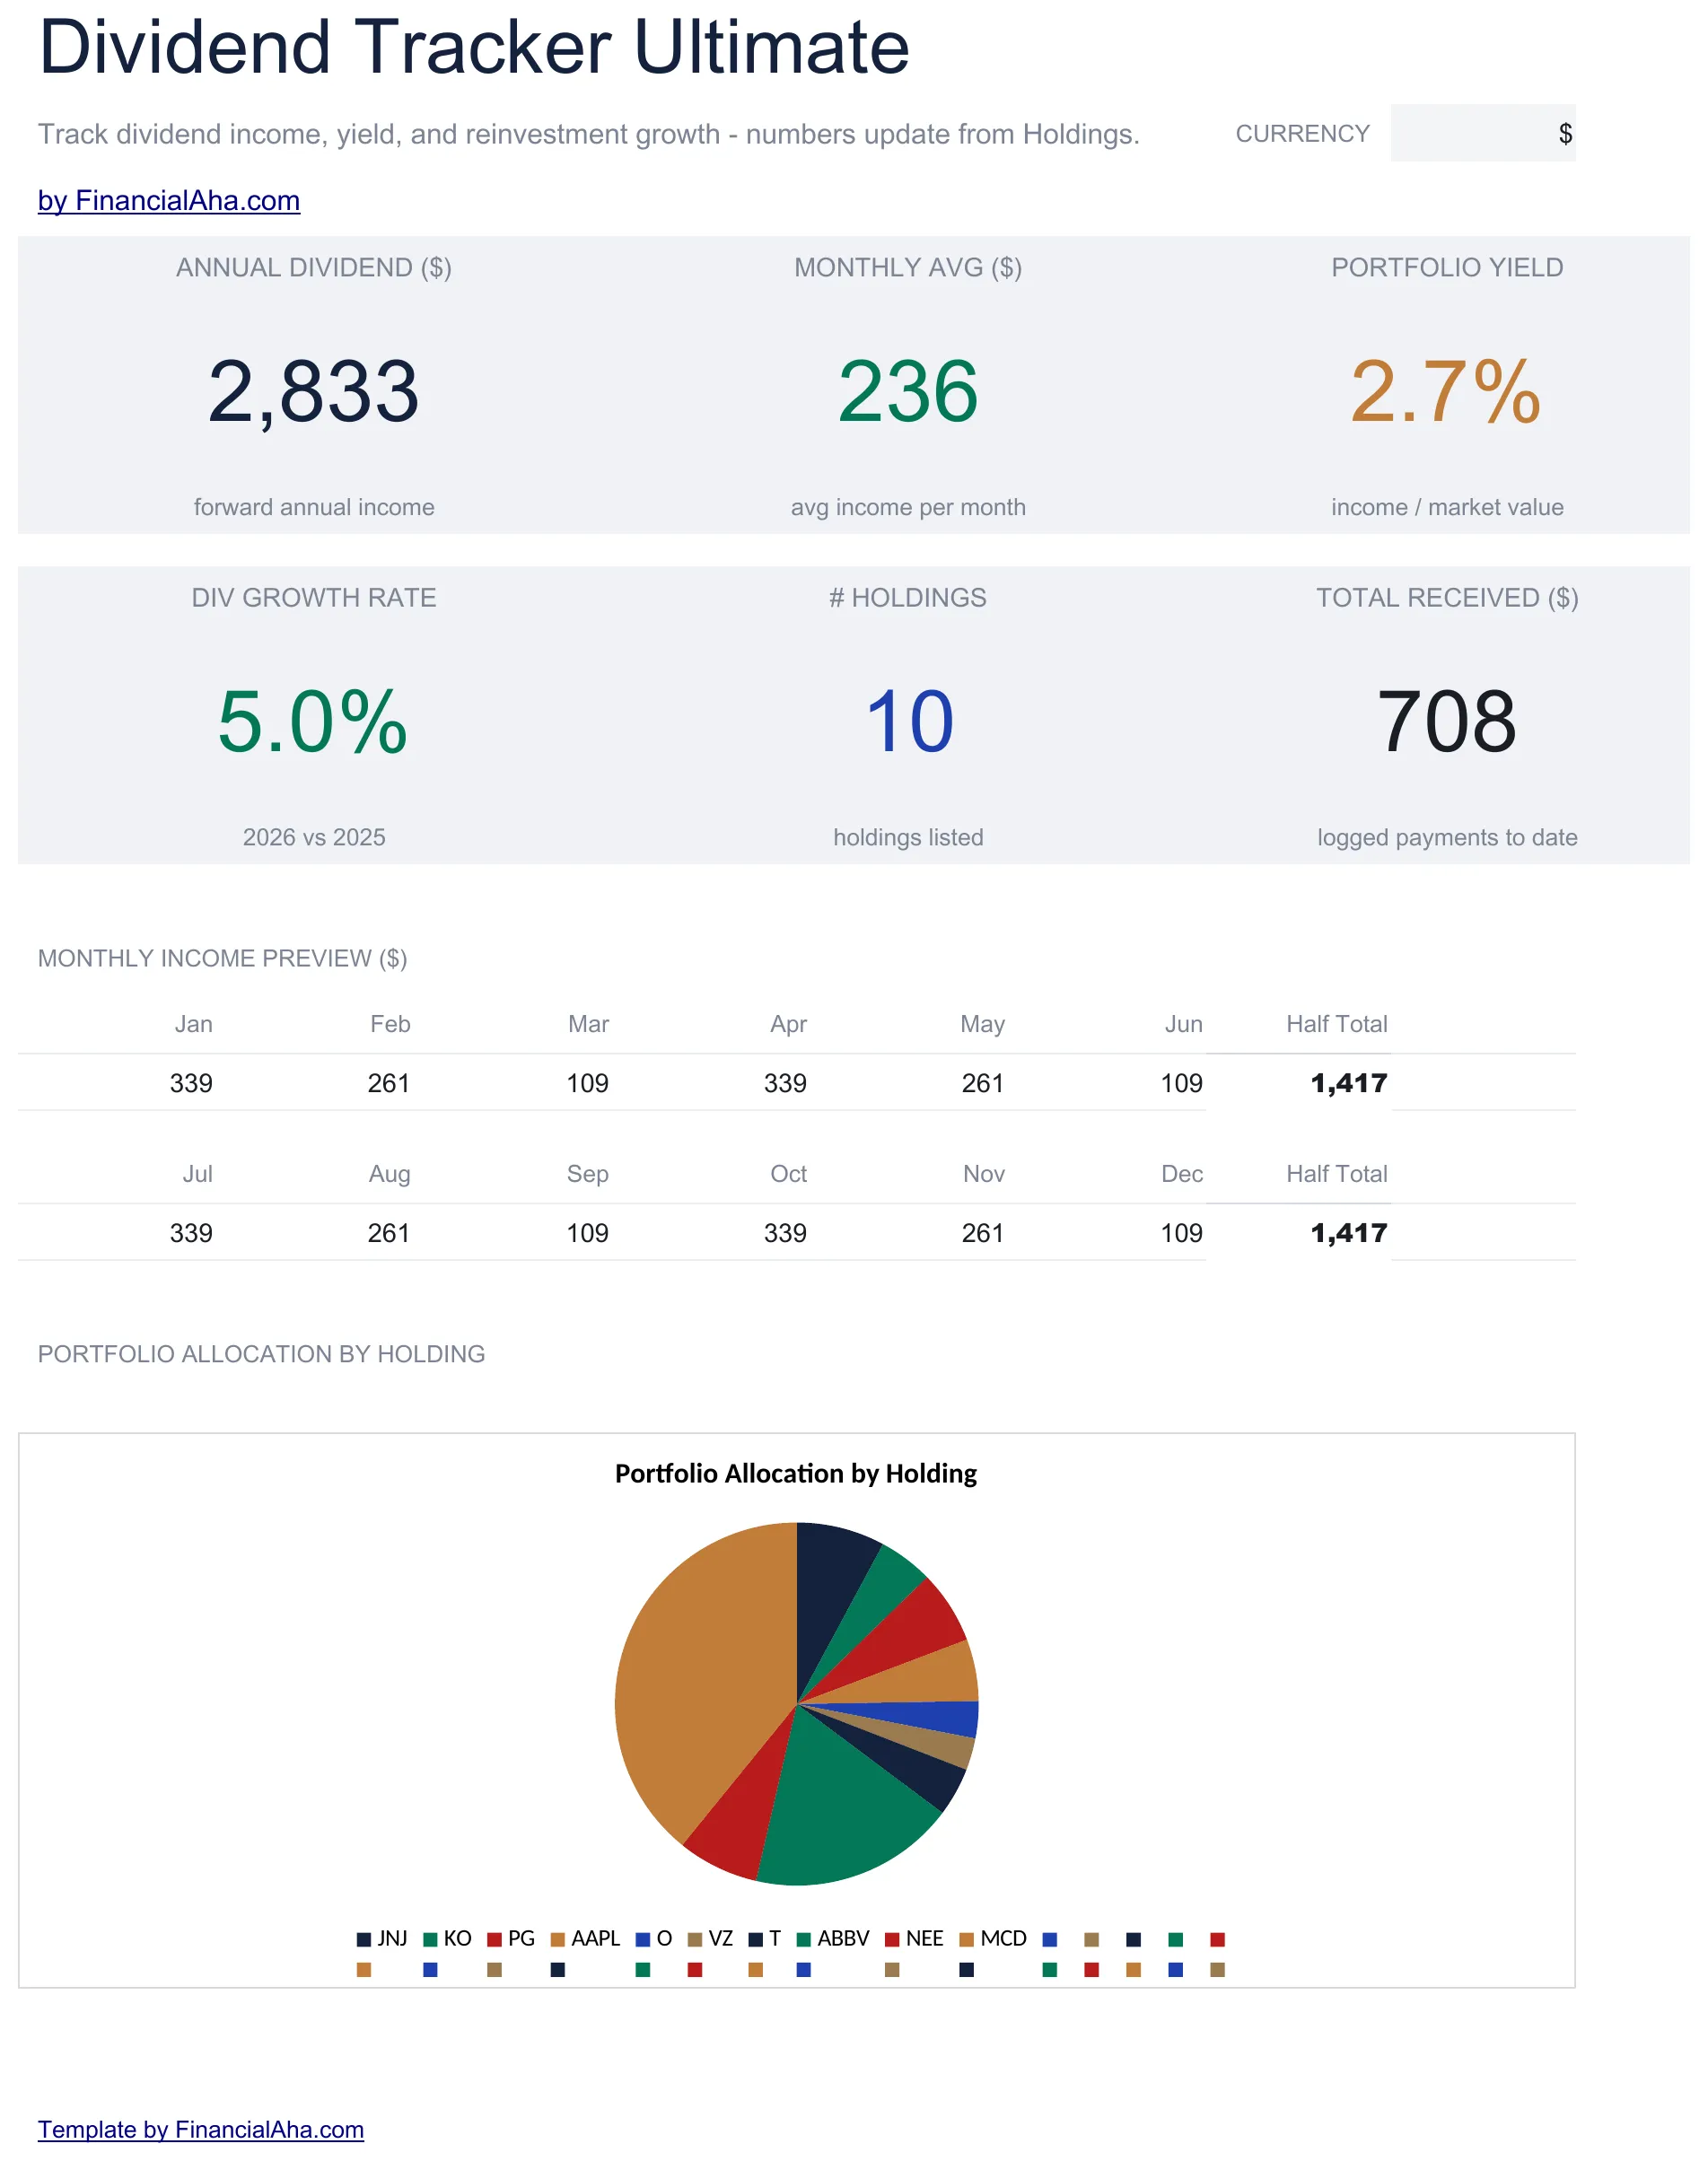 The Dividend Tracker Ultimate dashboard (Ultimate tier), surfacing the dividend column’s yield, growth rate, and monthly income preview.
- Dividend Tracker Ultimate - For the dividend side. Up to 30 holdings, a Yield on Cost sheet, a DRIP Calculator that models 10 years per holding, and a Monthly Income sheet spreading each payer across all 12 months.
- Investment Portfolio Tracker Ultimate - For the combined view. Up to 50 holdings with a Sector column that includes Fixed Income, target versus actual allocation, year-over-year performance by sector, and a Dividends sheet built from the same holdings table.
- Financial Planning Spreadsheet - Each asset carries an annual yield percentage, so bond and stock income lands in the Cashflow tab and rolls up into net worth and a projection that runs to an end year you set.
The two Ultimate trackers are .xlsx files that open in Excel, Google Sheets, and LibreOffice Calc. Financial Planning is a Google Sheets template. None of the three use macros.
Related
- Dividend Income Tracker in Google Sheets (Free + Paid Versions)
- How to Track Investment Returns in Google Sheets (TWR vs MWR)
- Investment Portfolio Tracker (Excel, With Dividend Log and ROI)
- How to Calculate ROI on a Rental Property (Spreadsheet)
- Tax Drag Calculator: The Hidden Cost of Taxes on Investments
Frequently asked questions
Which has higher income potential?
Depends entirely on the specific bonds and stocks. Treasury yields recently ran 4 to 5 percent; high-quality corporate dividend stocks 2 to 4 percent; high-yield bonds and dividend ETFs can reach higher with corresponding risk. Headline yield is the first number, not the whole picture.
How does after-tax income differ between bonds and dividend stocks?
Qualified dividends are taxed at long-term capital gains rates (0 to 20 percent federal). Bond interest is taxed as ordinary income (10 to 37 percent federal). For higher earners in taxable accounts, the after-tax gap can be significant. Treasury interest is also state-tax exempt, which narrows the gap further in high-tax states.
Which is less volatile?
Bonds, generally. Bond prices move with interest rates; investment-grade bonds have lower price swings than stocks. Dividend stocks fluctuate with the broader equity market, even when dividends themselves are stable.
Are bonds 'safer'?
Lower volatility, yes. 'Safer' depends on what you mean - inflation risk and default risk apply to bonds too. The spreadsheet helps quantify the trade-off rather than label one safer than the other.
Do the templates pull live bond and dividend yields automatically?
No. Yields are typed in either way, from your brokerage or a source like the Federal Reserve H.15 release. In Dividend Tracker Ultimate and Investment Portfolio Tracker Ultimate, current price and annual dividend per share are plain cells on the Holdings sheet, and every total recalculates the moment one changes. The Financial Planning Google Sheet does read share prices for listed tickers through GOOGLEFINANCE, but its annual yield column stays manual.
Sources
- Selected Interest Rates (H.15) - Federal Reserve
- Topic no. 404, Dividends - Internal Revenue Service
- Topic no. 409, Capital gains and losses - Internal Revenue Service
- Topic no. 403, Interest received - Internal Revenue Service
About this article
Yields shown are drawn from the Federal Reserve H.15 selected interest rates release. Tax treatment of dividends, bond interest, and the Treasury state-tax exemption is checked against IRS Tax Topics 404, 409, and 403. Template claims checked on 2026-09-10 against the shipped workbooks: Dividend Tracker Ultimate (Dashboard, Holdings, Dividend History, Monthly Income, Yield on Cost, DRIP Calculator), Investment Portfolio Tracker Ultimate (Dashboard, Holdings, Performance, Dividends, Allocation) and the Financial Planning Google Sheet (Summary, Goals, Assets, Debt, Cashflow, Projection). Last reviewed September 2026.