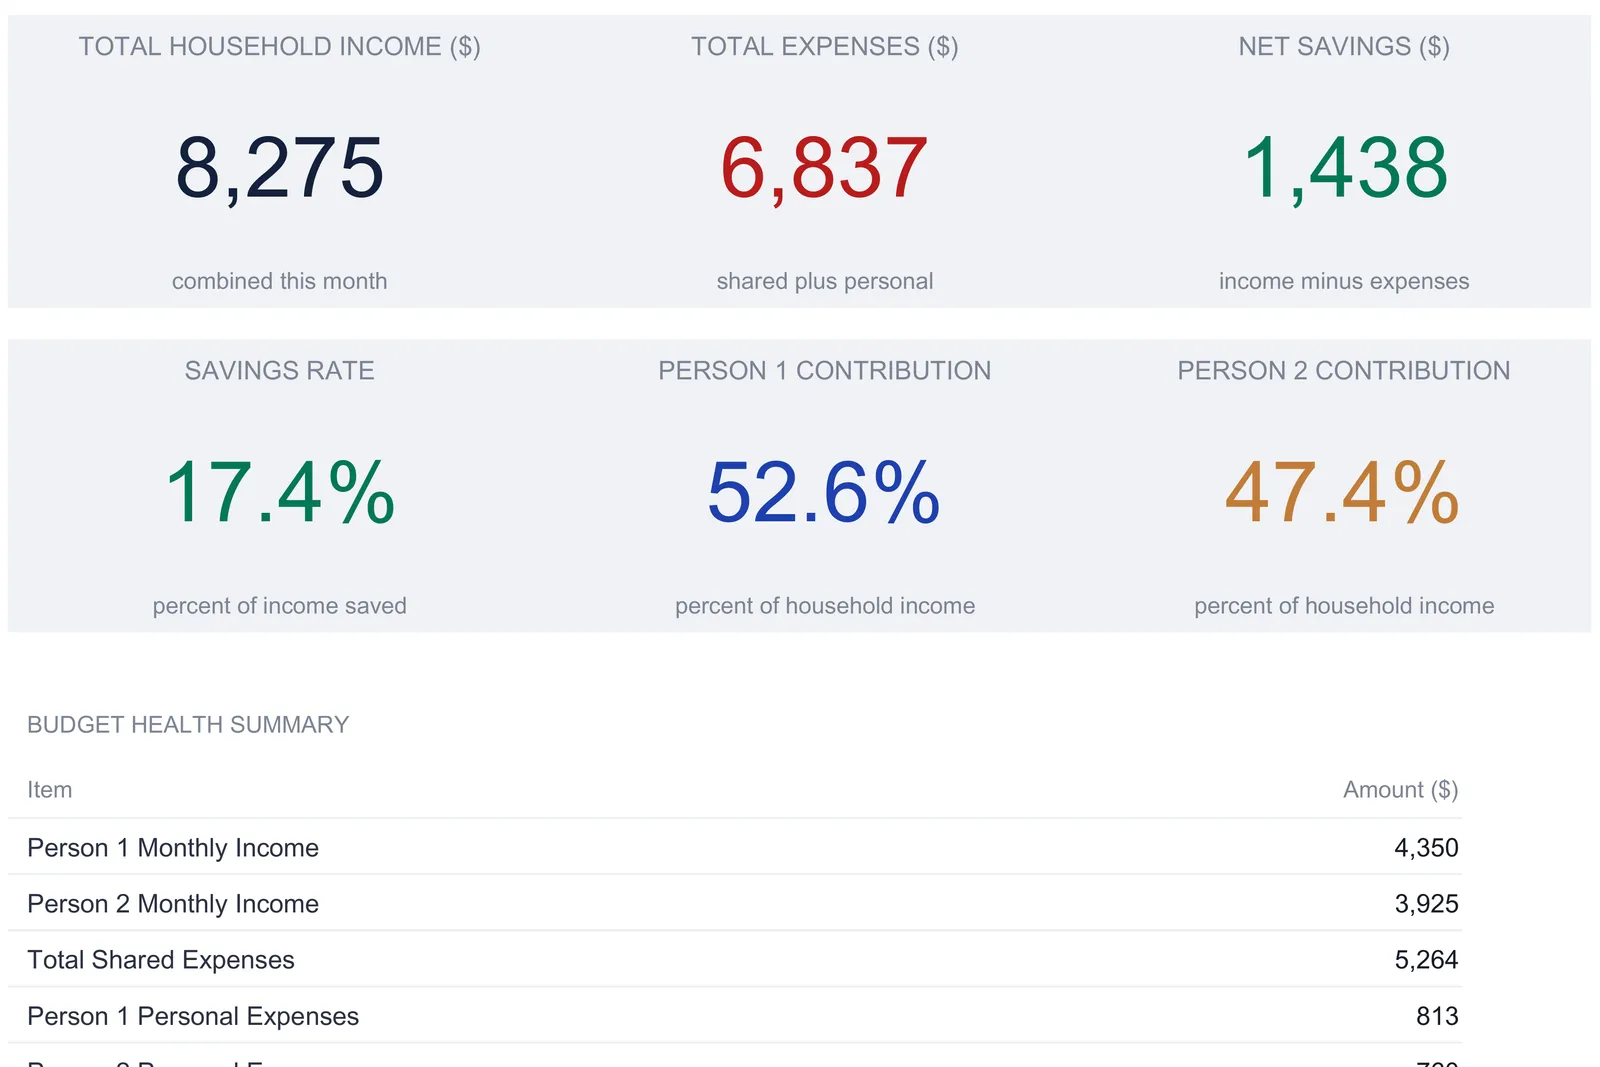
A household budget spreadsheet keeps two earners, the shared bills, and each person's private spending in one file, then rolls it into a savings figure without anything being typed twice. This walkthrough follows a couples budget through all six working sheets using the numbers the workbook ships with: 8,275 in combined income, 5,264 in shared expenses, 1,573 in personal spending, and 1,438 left over at a 17.4 percent savings rate, plus the split-ratio math that decides who owes whom. Our Household Budget Ultimate ($29) ships the same structure ready-made for Excel and Google Sheets.
A household with two earners is not one budget, it is three overlapping ones. There is the money each person brings in, the bills the household pays together, and the spending each person does on their own. Most budgeting templates flatten all of that into a single list of categories, which works fine for one person but starts losing information the moment a second income and a second set of personal habits enter the picture. Who actually paid the electric bill this month? Is the rent split evenly or by income? How much did each person spend on themselves, separate from the groceries? A single column of numbers cannot answer any of that.
A household budget spreadsheet earns its place by keeping those three streams distinct and then reconciling them. Two income blocks feed a combined total. Shared expenses carry a split so the household can see who is responsible for what. Individual expenses stay in their own lane so personal spending never gets confused with the joint bills. Everything then rolls up into one savings figure. The examples below come from our Household Budget Ultimate Spreadsheet Template ($29), a workbook of six working sheets plus a How to Use tab, built for Excel and Google Sheets. The structure is reproducible by hand if you would rather build your own, and this walkthrough follows the sheets in the order a couple fills them in.
What a household budget spreadsheet has to hold
Strip a joint budget down and there are five kinds of information, and the workbook gives each its own sheet:
- Two income streams and a split rule. Each person’s earnings, plus a single ratio that decides how the shared bills are divided. This is the Income Setup sheet.
- Shared expenses. The bills the household pays together, each tagged with who actually paid it. This is the Shared Expenses sheet.
- Individual expenses. Each person’s private spending, kept apart from the joint costs. This is the Individual Expenses sheet.
- A year-long history. Twelve months of category totals so patterns show up over time. This is the Monthly Tracking sheet.
- The derived views. A plan-versus-actual comparison and a dashboard, both of which are calculated rather than typed. These are the Budget vs Actual sheet and the Dashboard.
The design principle running through all of it is that a number is entered once and read everywhere else. The Consumer Financial Protection Bureau’s budgeting guidance describes the same two habits this workbook automates, recording all income and logging spending by category. The value of a spreadsheet is that it does that logging arithmetic for you once each figure is in.
Start with the earners: the Income Setup sheet
Income Setup is where a couples budget begins, because two numbers here shape everything downstream: how much the household makes, and how the shared bills get divided.
At the top sits the shared expense split ratio. It is a single figure, Person 1’s share of the shared costs, set to 50 percent in the sample for an even split. Person 2’s share is computed as one minus that, so it lands at 50 percent too, and the two always add back to the whole. The point of exposing it as a setting is that not every household splits evenly. A couple where one person earns noticeably more might set Person 1 to 60 or 70 percent, and every share calculation later in the file follows the new number without anything else being touched.
Below the ratio, each person gets an income block with three sources, Salary, Side Income, and Other Income, and two columns for each: a monthly budget and the actual figure for the month. In the sample, Person 1 budgets 4,200 in salary and 200 in side income and lands at 4,200 and 150 actual, for 4,350 against a 4,400 plan. Person 2 budgets 3,800 and 100 and comes in at 3,800 and 125, for 3,925 against 3,900. The variance column flags the gap on each line, showing Person 1’s side income 50 under plan in red and Person 2’s 25 over in green. Combined household income totals automatically at the bottom: 8,300 budgeted, 8,275 actual.
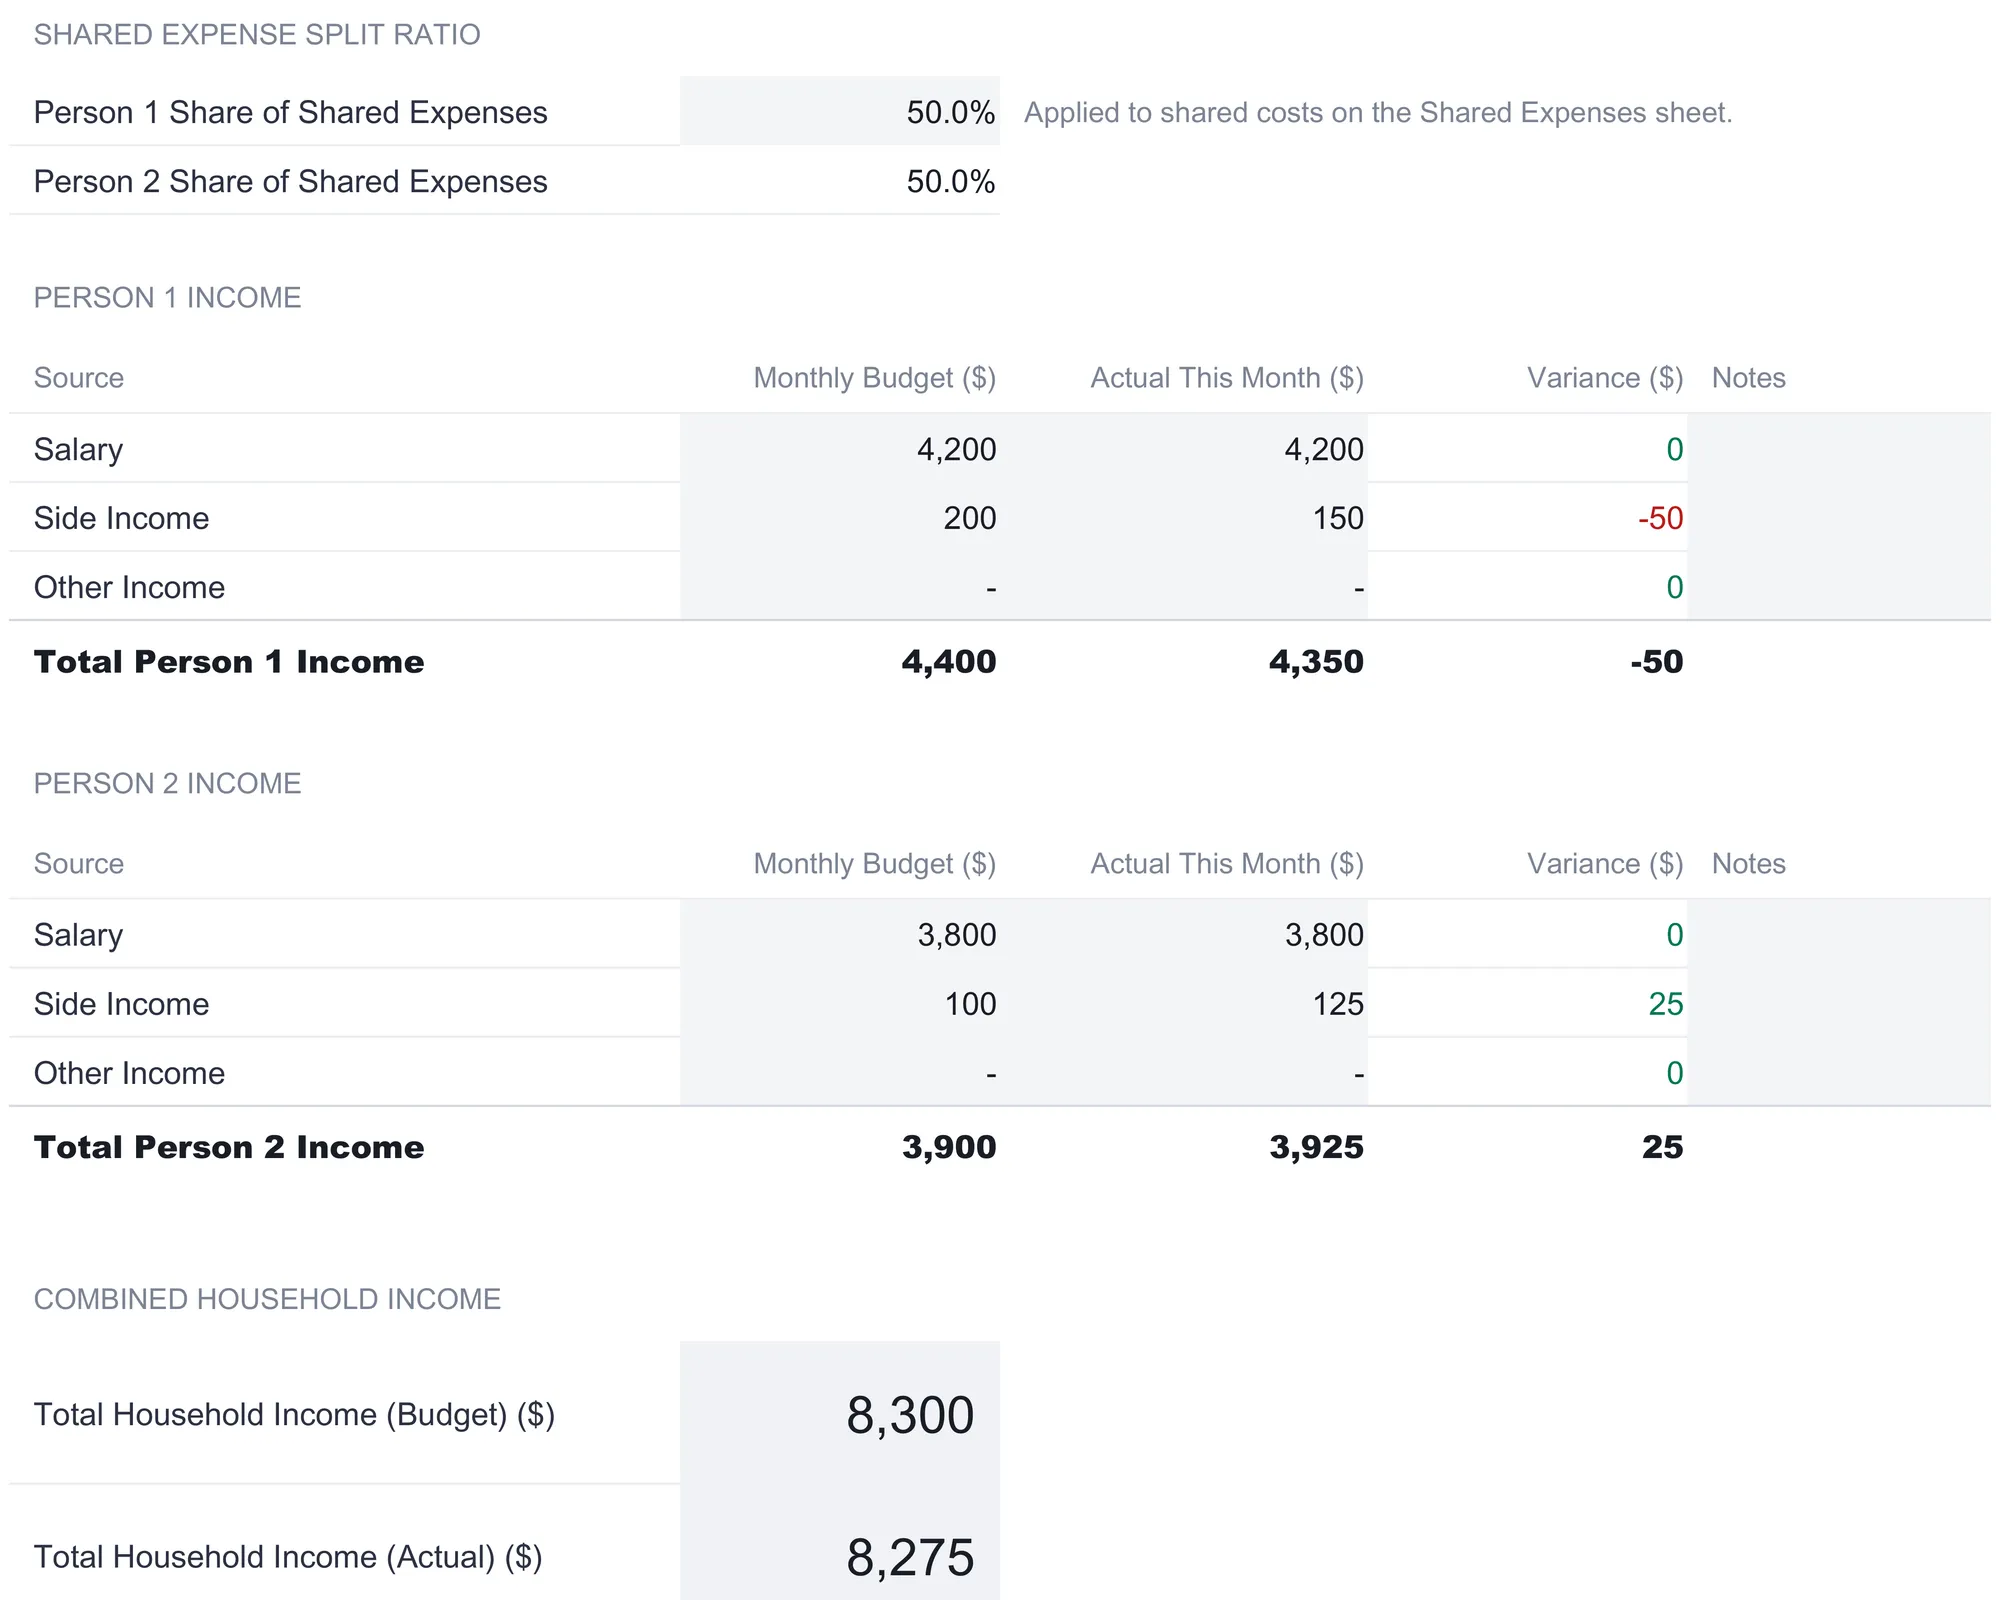
Two things matter about how this sheet feeds the rest of the file. First, the dashboard’s headline income figure uses the actual column, 8,275, not the budgeted 8,300, so the savings number reflects what really came in rather than the plan. Second, the split ratio entered here is the only place that number lives; the Shared Expenses sheet reaches back to it rather than repeating it, which is exactly the pattern that keeps a multi-sheet workbook from contradicting itself.
Log the joint bills once: the Shared Expenses sheet
Shared Expenses is the household’s common ledger, thirty rows for the bills two people pay together. Each row carries a category, a description, a monthly budget, the actual amount, an automatic variance, a Paid By tag, and a notes field. The sample fills in a realistic month across the usual joint categories.
Housing leads with Rent / Mortgage at 1,800 and Home Insurance at 85. Groceries covers Weekly Groceries at a budgeted 600 against 635 actual, plus Household Supplies. Utilities runs five lines, Electric, Gas / Heating, Water / Sewer, Internet, and a family Cell Phone plan, totaling 434 actual against a 440 plan. Insurance carries Health at 380, Auto at 190, and Life at 60. Kids covers Childcare / Daycare at 850, After-School Activities, and School Supplies. Pets, Home Maintenance, and Other round it out with subscriptions, family dining, and repairs. The whole sheet sums to 5,205 budgeted and 5,264 actual, a household running 59 over its shared plan for the month.
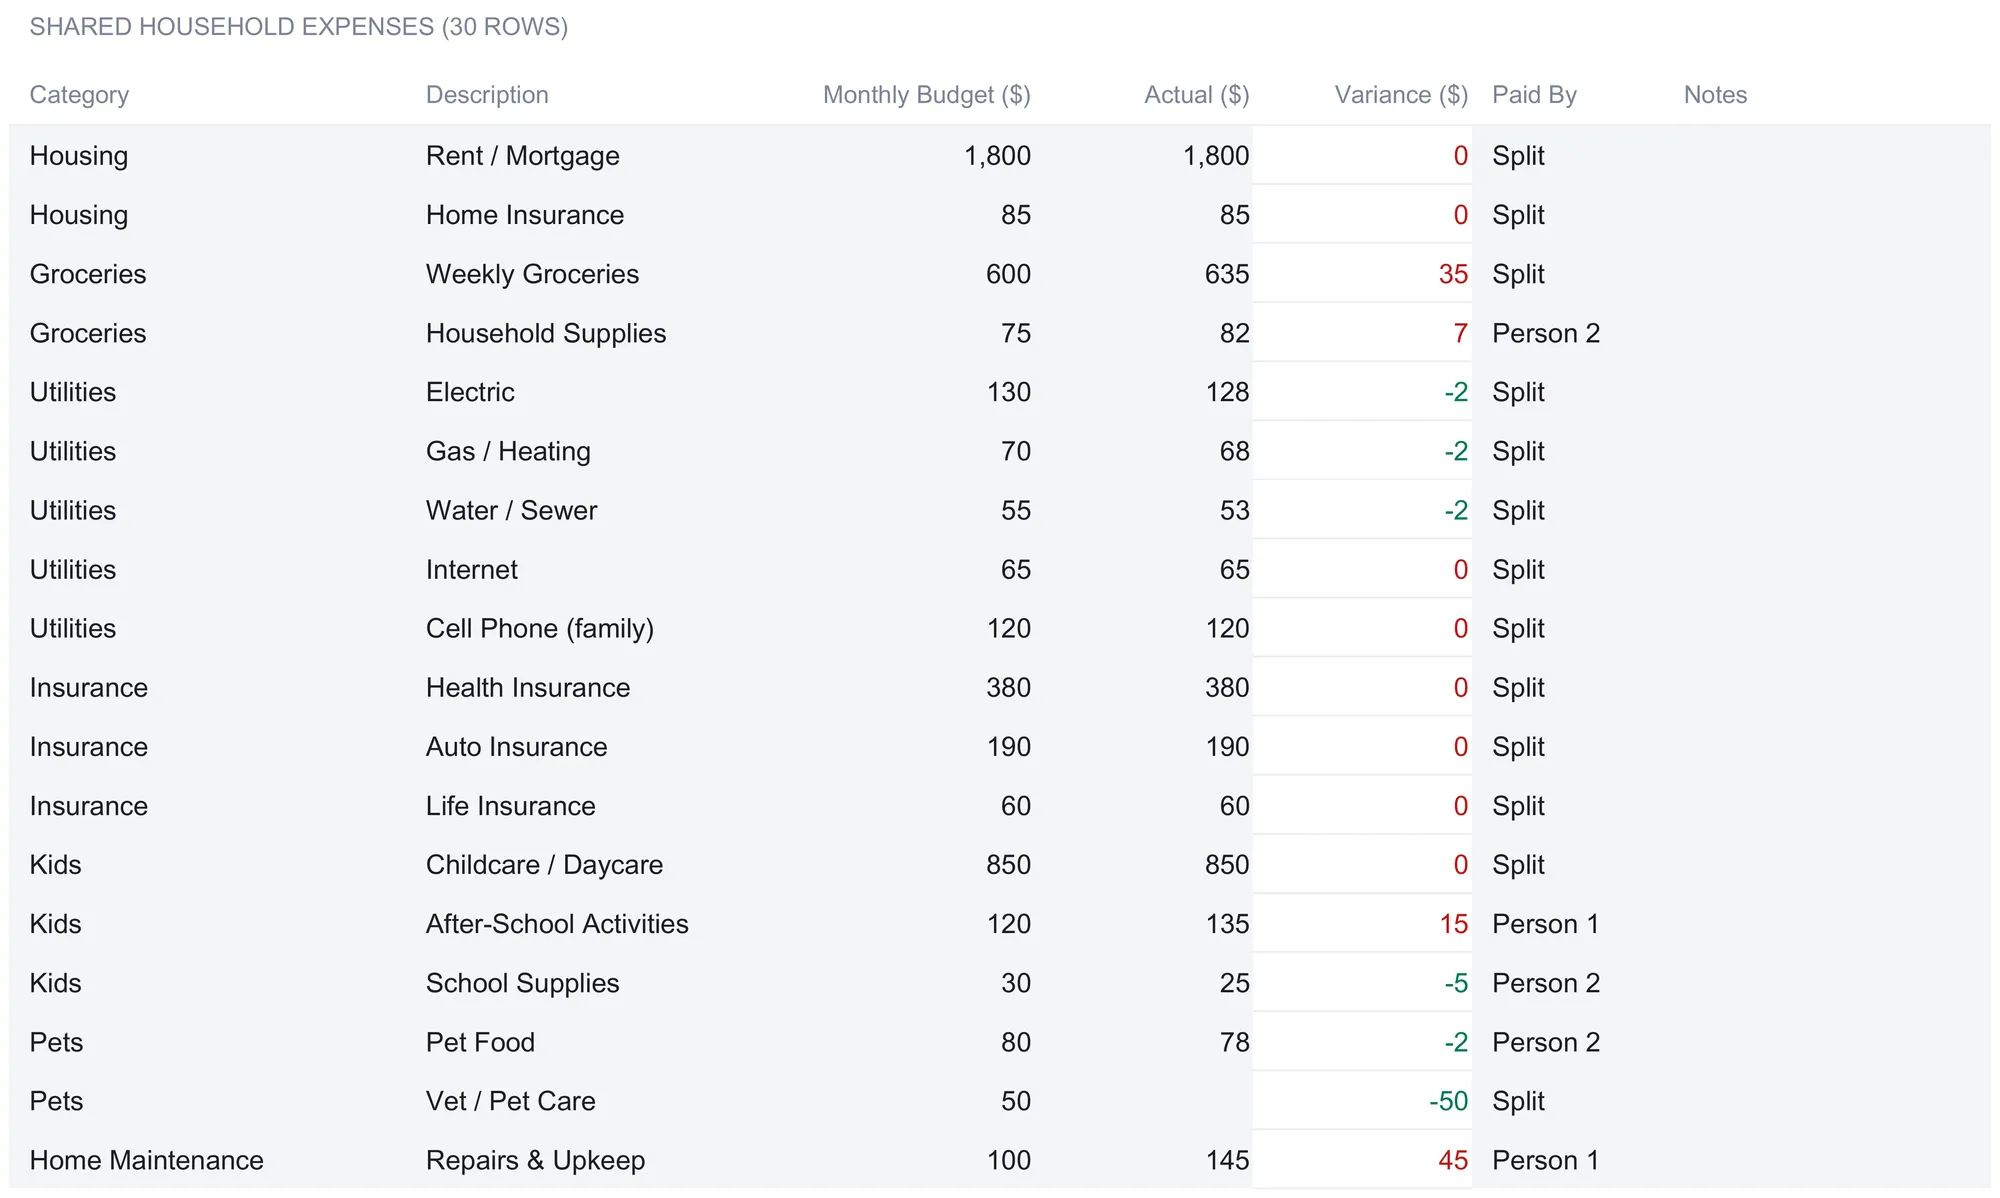
The column that makes this a household sheet rather than a generic expense list is Paid By. Each line is tagged Split, Person 1, or Person 2, recording who actually fronted the money. Most lines in the sample are Split, meaning the cost came straight out of shared money, but a handful were covered by one person alone: Person 1 paid the After-School Activities, the Repairs, and the Lawn / Garden line directly, Person 2 covered Household Supplies, School Supplies, Pet Food, and Cleaning Supplies. That tagging drives a small settlement engine at the bottom of the sheet.
The person responsibility summary turns the Paid By tags and the split ratio into a fair-share reckoning. It starts with each person’s share of the shared total: at a 50 percent ratio on 5,264 actual, that is 2,632 apiece. It then sums what each person paid directly, 335 for Person 1 and 227 for Person 2, and the Split total of 4,702 that came from joint money. The last line is the settlement: owed to Person 1 works out to 54. The logic is that only the bills one person paid alone need settling, because the Split lines already came out of shared money at the ratio. Person 1 paid 335 directly while their responsible share of those direct-paid bills was 281, so 54 flows back to them. Had the number been negative, it would mean Person 1 owed Person 2 instead. For a couple that keeps a joint account plus separate cards, this is the figure that squares the month up.
One more detail worth copying into a hand-built version: the sheet advertises thirty rows but the sample only uses the first twenty-two, and the blank rows already carry the variance formula and already sit inside every total and the responsibility math. A new shared bill goes on the first free row and the whole workbook updates, with no formula to drag and no range to extend. The sample also leaves the Vet / Pet Care line with a 50 budget and no actual yet, which shows up as a 50 under-budget variance, a useful reminder that an unpaid or unentered bill reads as under budget until the number lands.
Keep personal spending separate: the Individual Expenses sheet
Individual Expenses is where a joint budget stops being joint. The sheet is two side-by-side sections, one per person, each fifteen rows deep with the same personal categories: Dining Out, Clothing, Subscriptions, Entertainment, Personal Care, Health, Transportation, Hobbies, Education, Gifts, Fitness, and Other Personal. Each row has a budget, an actual, and a variance, so each person plans and tracks their own discretionary money without it ever mixing into the household bills.
The sample shows the two people spending differently, which is the whole point of separating them. Person 1 overshoots on Dining Out, 128 against a 100 budget, and on Other Personal, 67 against 50, finishing at 813 actual on an 800 plan. Person 2 stays closer to plan on most lines but runs over on Dining Out and Entertainment, landing at 760 on a 745 plan. As on the shared sheet, the variance colors flag over-budget lines in red and under-budget in green, and Person 1’s Education line sits at a 50 budget with no actual, reading as under budget until spent.
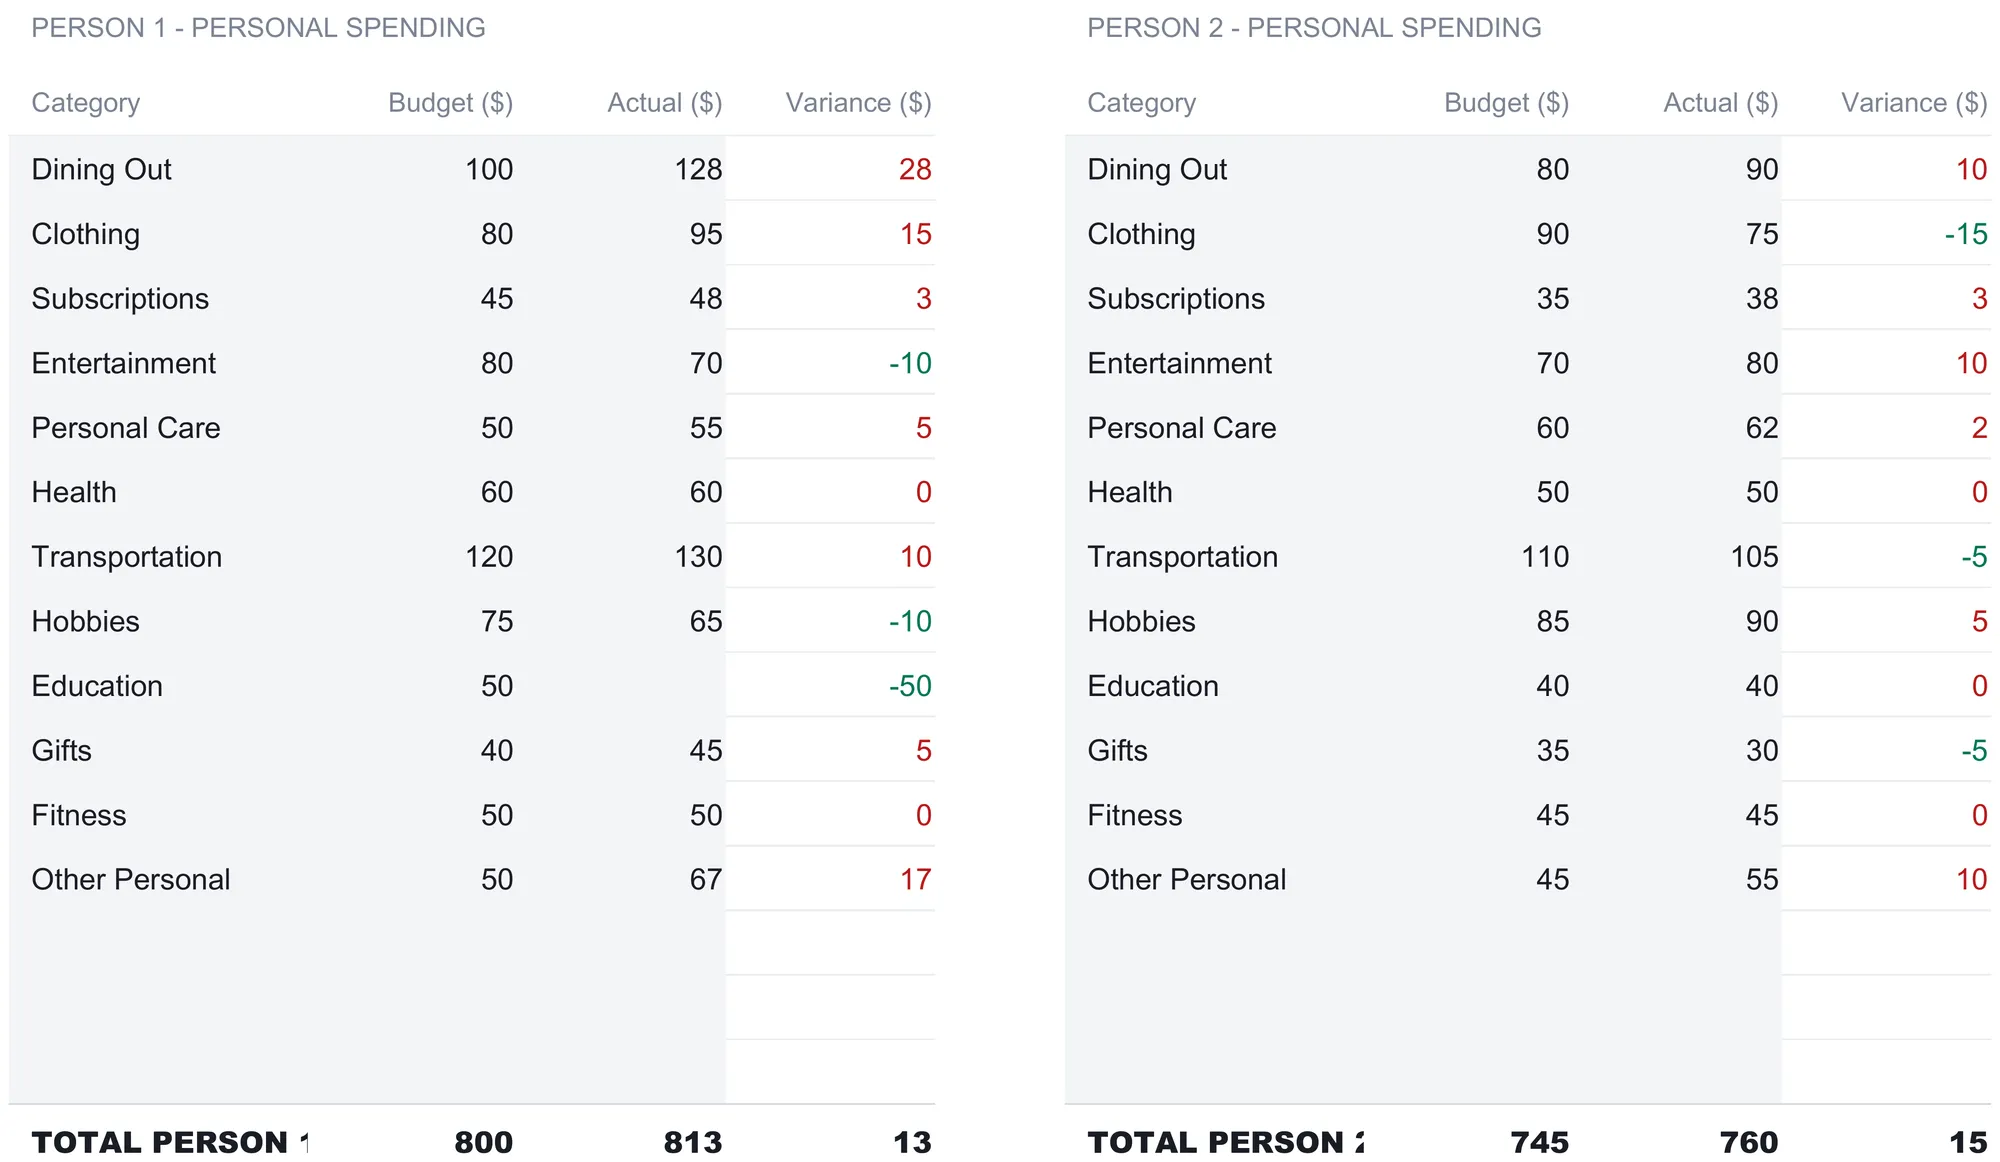
Keeping the two personal totals apart matters for more than tidiness. When the dashboard later reports net savings, it adds both personal totals to the shared total to reach household expenses, but it never loses track of which person spent what. A couple can see that personal spending ran 813 and 760 this month, close enough that neither is subsidizing the other’s habits, without having to untangle it from the rent. This is the difference between a household budget and an expense tracker that pools every transaction into one stream.
Build the year: the Monthly Tracking sheet
The three sheets so far describe a single month in detail. Monthly Tracking widens the lens to a full year. It is a grid with one row per category and one column per month, from January through December, plus an annual total that sums across.
The ten category rows are the household’s top-level buckets: Housing, Groceries, Utilities, Insurance, Kids, Pets, Home Maintenance, Other, and then Person 1 Personal and Person 2 Personal as their own rows. January is not arbitrary sample data; it matches the figures from the expense sheets exactly. Housing reads 1,885, which is the 1,800 rent plus the 85 home insurance. Groceries reads 717, the 635 groceries plus the 82 supplies. Utilities is 434, Insurance 630, Kids 1,010, and the two personal rows carry 813 and 760, the individual totals. January sums to 6,837, the same total expenses the dashboard reports for the month. The remaining eleven months are illustrative, drawn to show the shape of a year with its seasonal swings, until you replace them with your own figures.
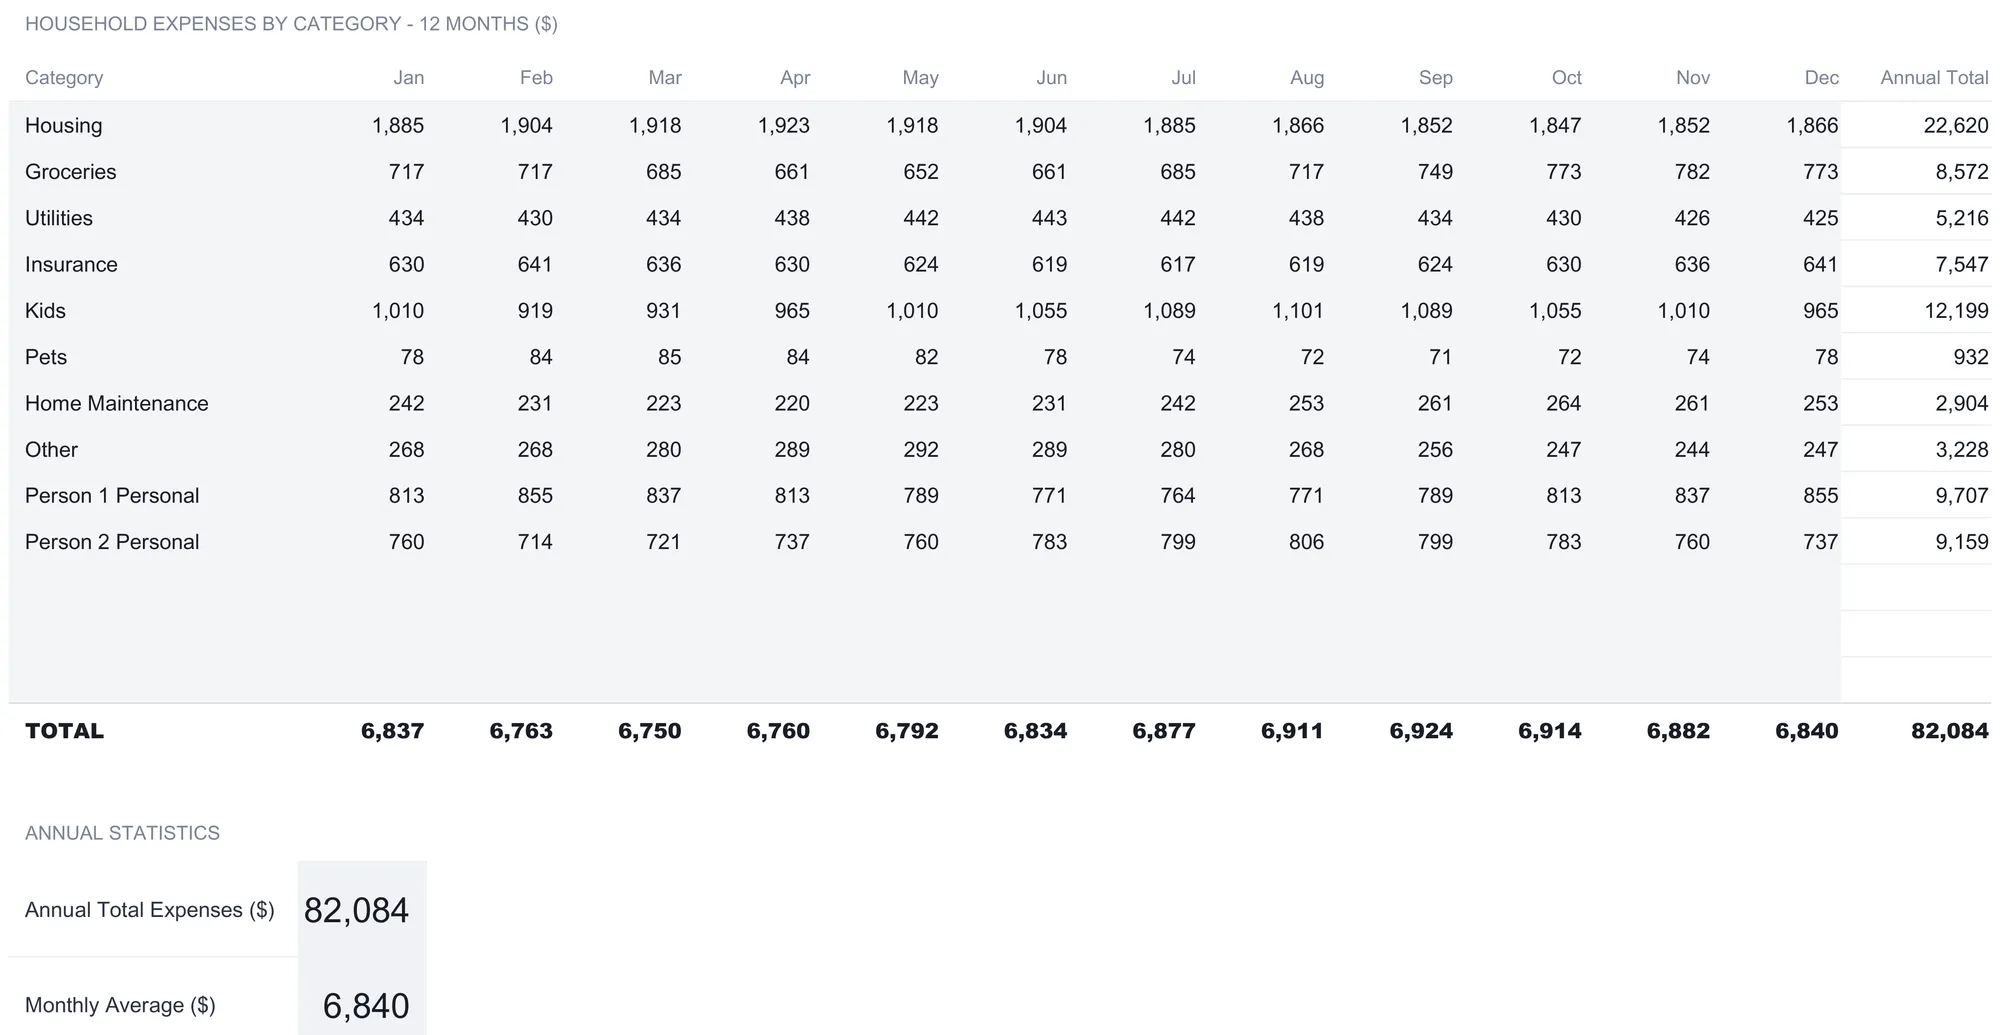
Two summary figures sit below the grid. Annual Total Expenses sums the whole year to 82,084, and Monthly Average divides that by twelve to reach 6,840. Reading down a single row shows how one category moves through the year, the sort of seasonal pattern a single-month view cannot show. The annual totals are the numbers that tell a household whether a category it feels casual about, Groceries at 8,572 or Kids at 12,199 across the year, is actually a large share of what it spends. Reading across the bottom total row is its own kind of check, since a month that jumps well above the 6,840 average is worth a second look before it repeats.
Compare plan to reality: the Budget vs Actual sheet
Budget vs Actual is the first of two sheets where no figure is typed at all. Every figure on it is pulled from the expense sheets, so the plan and the reality can never quietly drift apart.
Each category row totals the shared lines filed under that exact name. Housing pulls together every Shared Expenses line tagged Housing, and so on down through Groceries, Utilities, Insurance, Kids, Pets, Home Maintenance, and Other. Below those sit two rows lifted straight from Individual Expenses, Person 1 Personal and Person 2 Personal. There is also an Unlisted Categories catch-all: anything filed under a shared category that has no row of its own lands there, so the total always ties back to the Shared Expenses sheet rather than silently dropping a line.
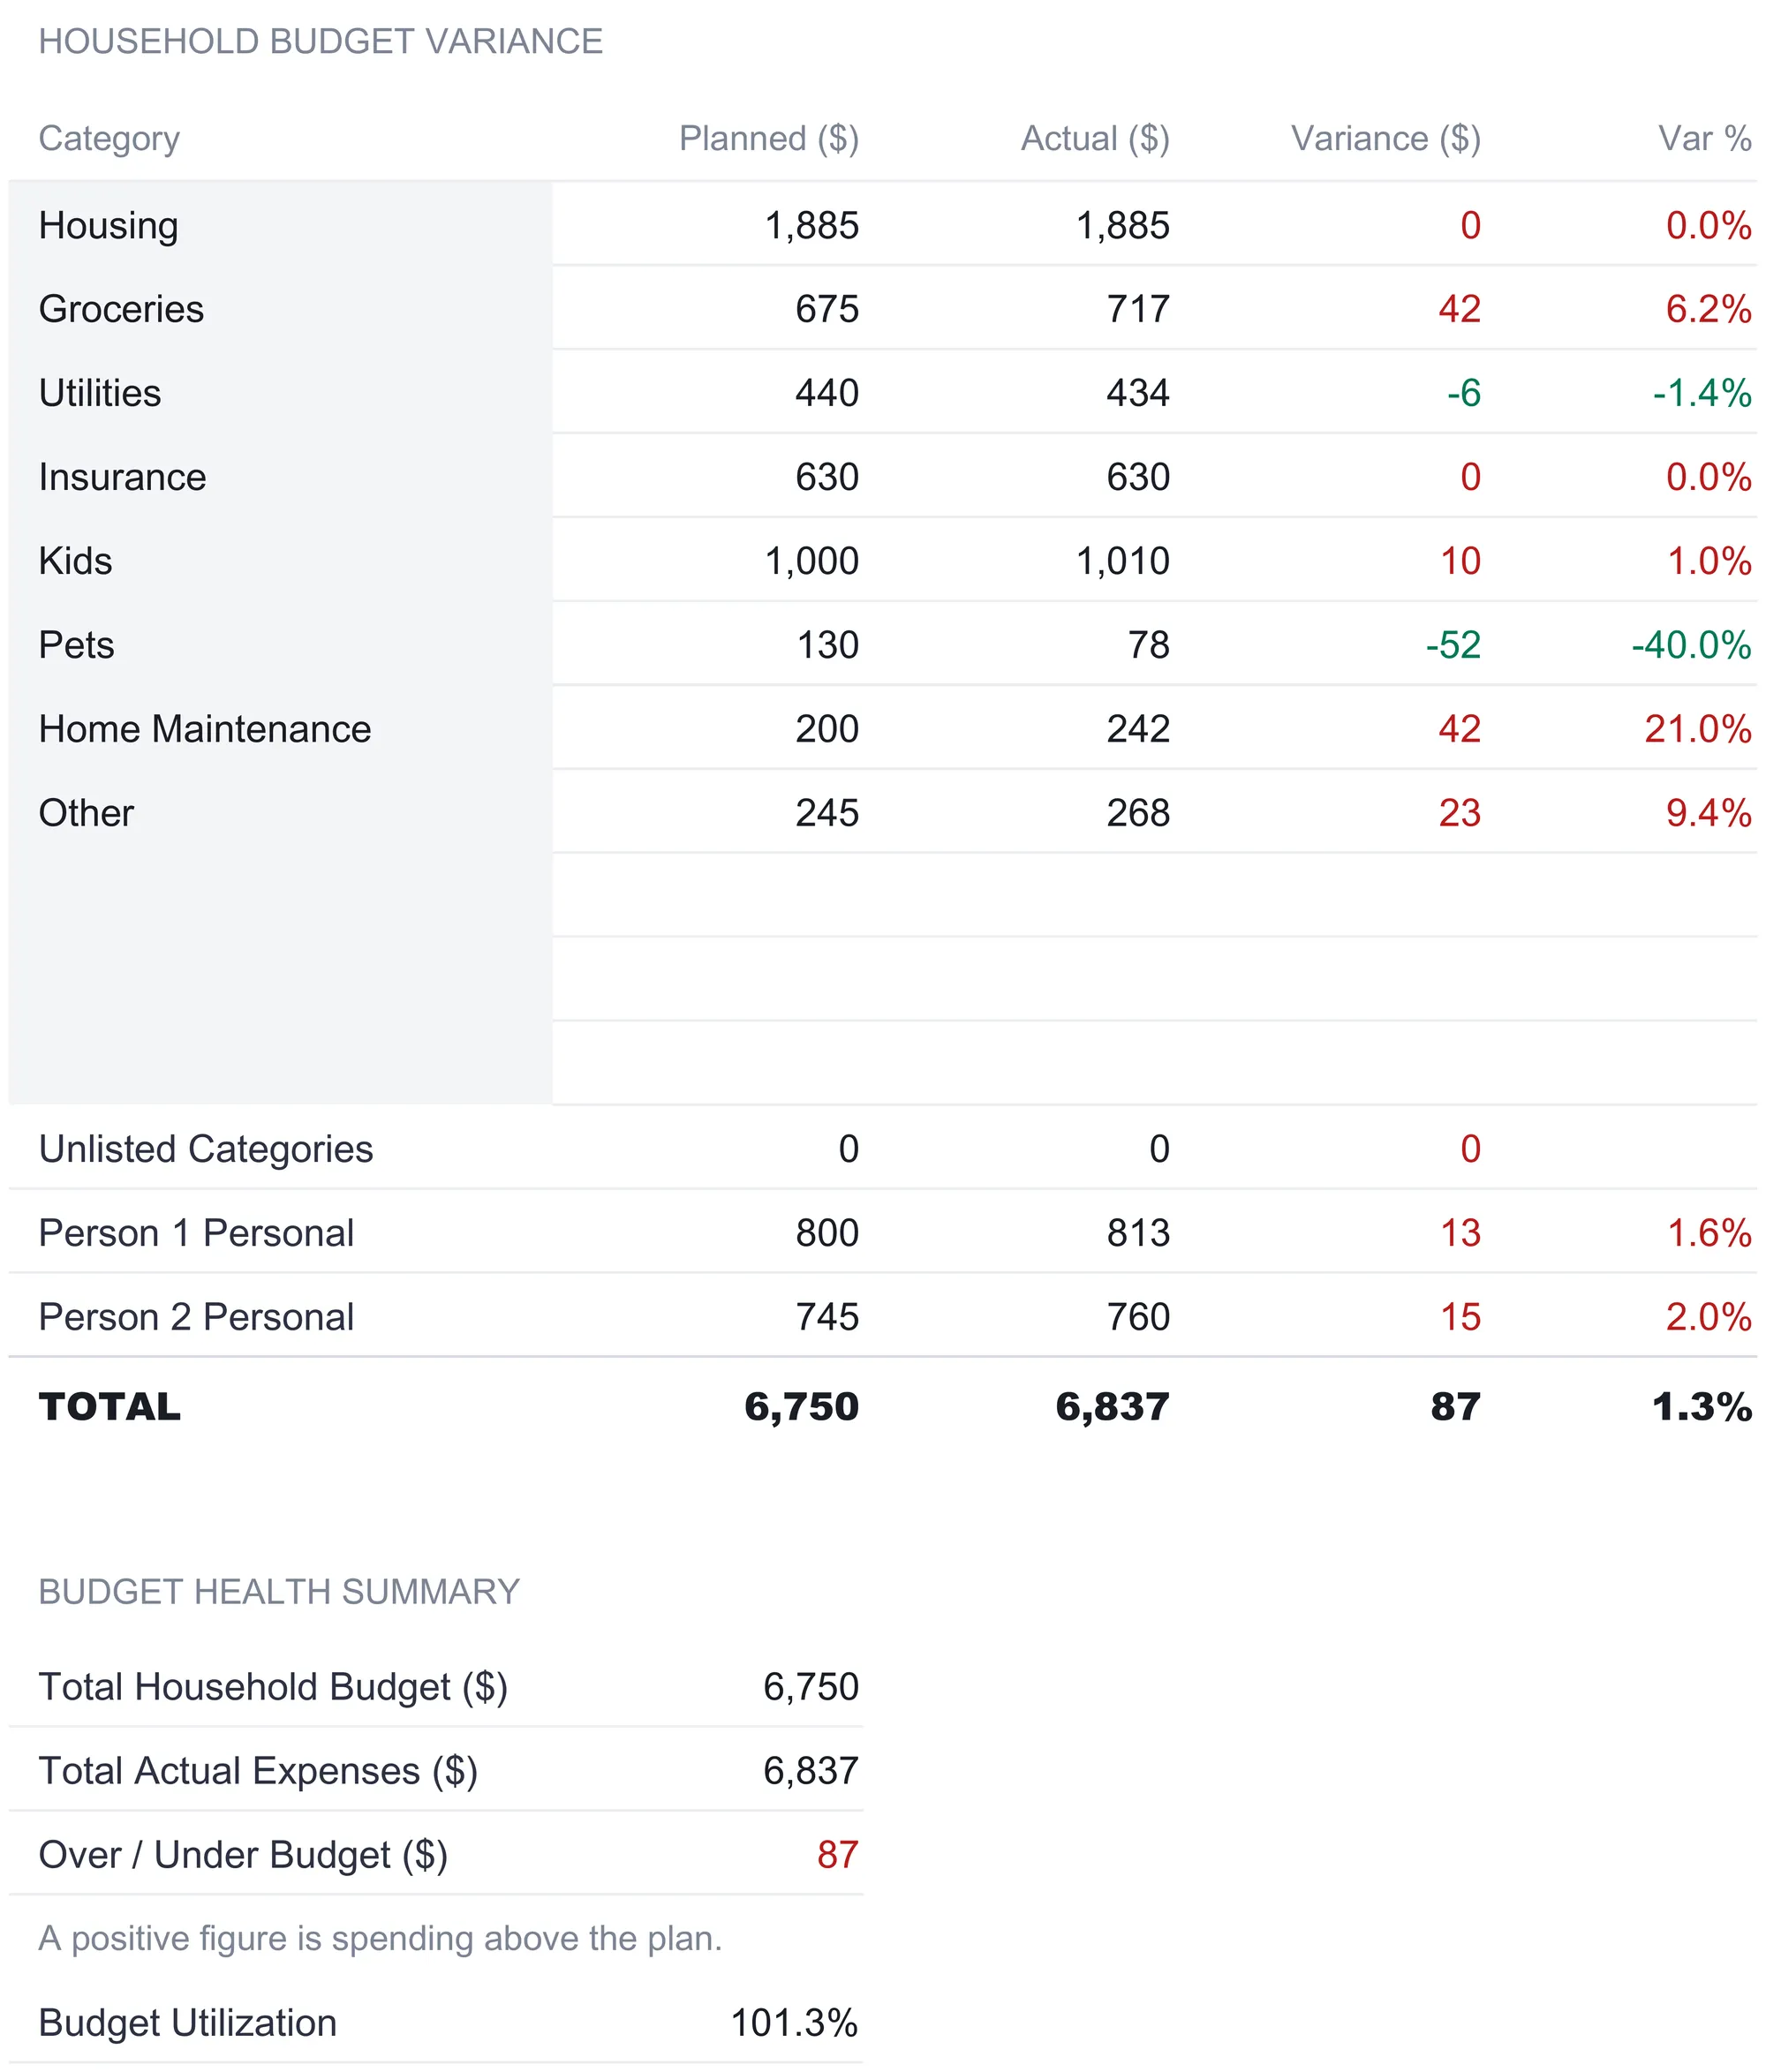
The sample makes the month’s story readable at a glance. Housing and Insurance land exactly on plan. Groceries runs 42 over, or 6.2 percent, and Home Maintenance is 42 over at 21 percent, the largest percentage overrun on the sheet. Pets comes in 52 under, a 40 percent gap that traces back to the unentered vet bill. The two personal rows are 13 and 15 over. It all rolls into a total of 6,750 planned against 6,837 actual, 87 over for the month. A variance color convention runs throughout, red for spending above the plan and green for below, so the eye finds the overruns without reading a single number.
The budget health summary at the bottom compresses the whole thing into one ratio. Total Household Budget is 6,750, Total Actual Expenses 6,837, Over / Under Budget 87, and Budget Utilization 101.3 percent, which is simply actual divided by planned. A figure over 100 percent means the household spent more than it set out to; under 100 means it came in beneath the plan. One number, and it says whether the month held together.
The dashboard: six tiles and a savings figure
With the input sheets filled, the Dashboard computes the household’s month across six KPI tiles and a summary table, none of it typed.
| Metric | Sample value | How it is derived |
|---|---|---|
| Total Household Income | 8,275 | Person 1 actual income + Person 2 actual income |
| Total Expenses | 6,837 | Shared total + both personal totals |
| Net Savings | 1,438 | Income minus all expenses |
| Savings Rate | 17.4% | Net savings ÷ total household income |
| Person 1 Contribution | 52.6% | Person 1 income ÷ combined income |
| Person 2 Contribution | 47.4% | Person 2 income ÷ combined income |
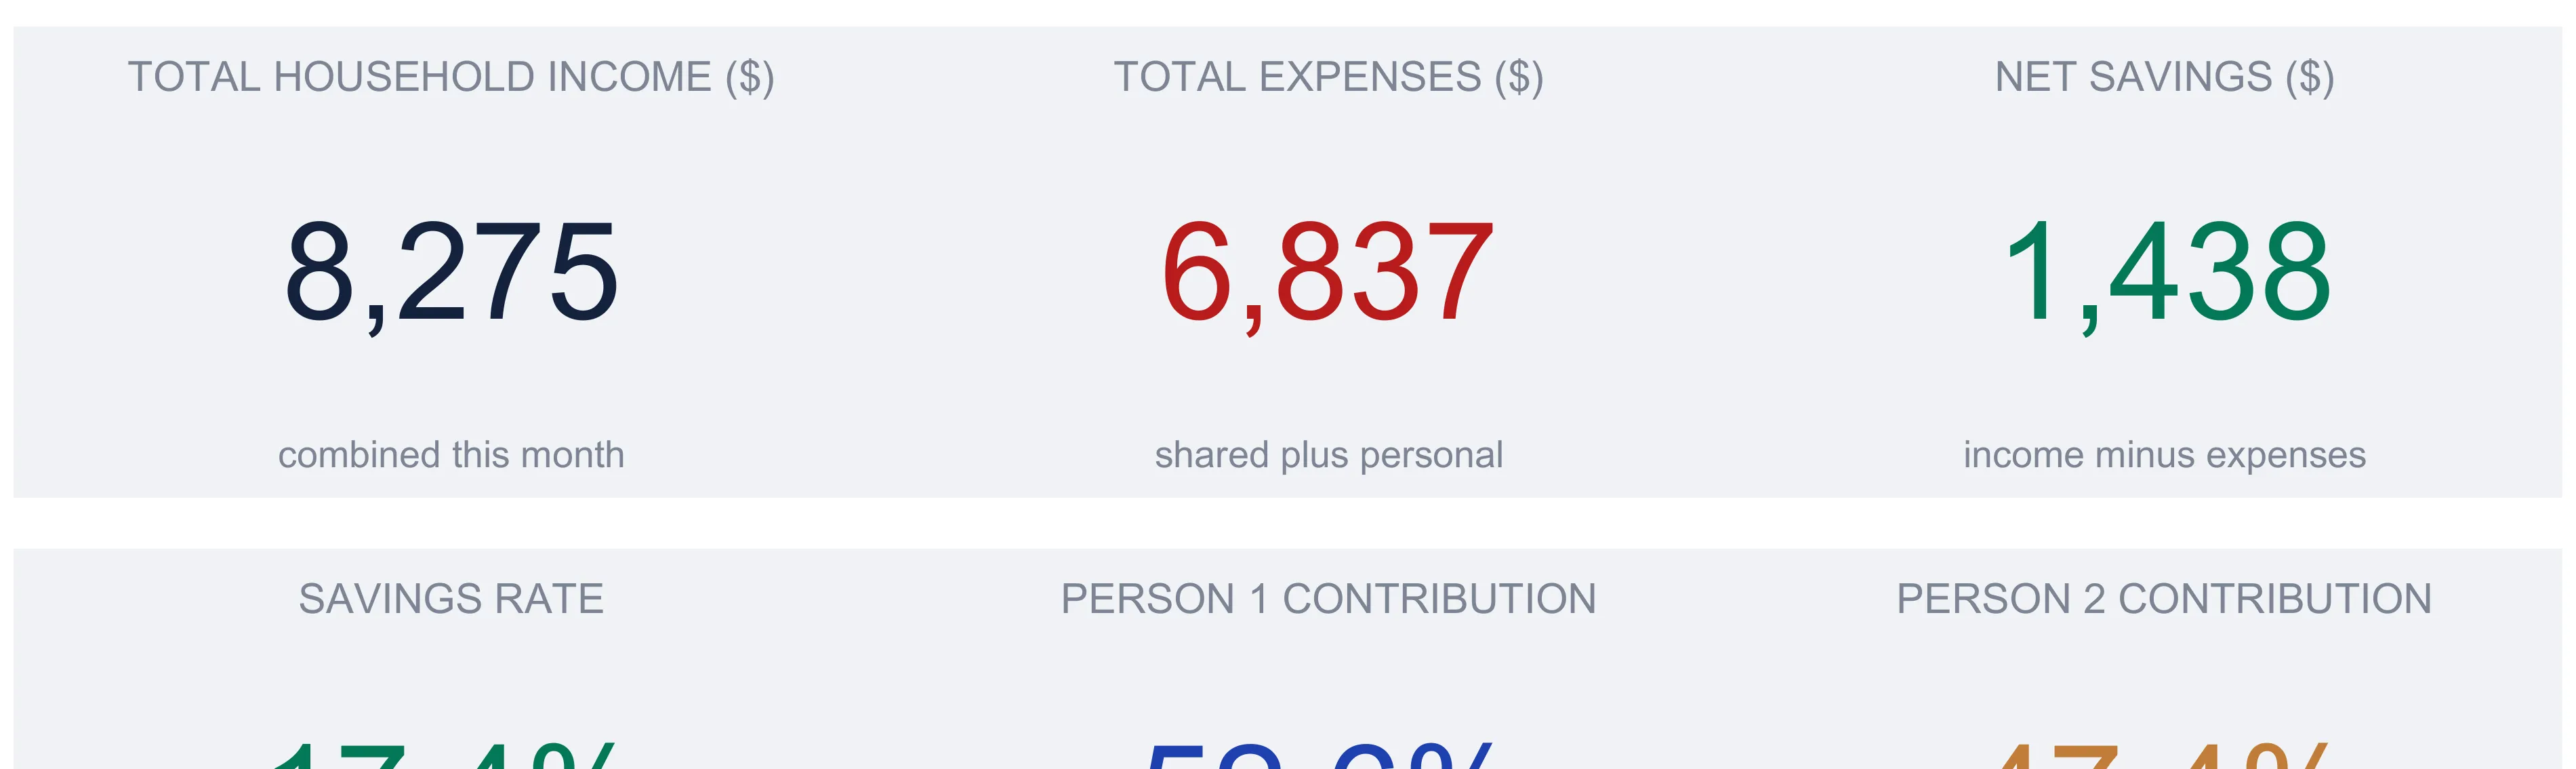
The first three tiles are the money in, the money out, and the difference. Total Household Income adds the two actual income totals, 4,350 and 3,925, to reach 8,275. Total Expenses adds the shared 5,264 to the personal 813 and 760 for 6,837. Net Savings is the gap, 1,438, printed in green beside the red Total Expenses tile so the money in and the money out read apart at a glance.
The second row of tiles reframes the same numbers as percentages. Savings Rate is net savings as a share of income, 1,438 out of 8,275, or 17.4 percent, the single figure that says how much of what came in the household kept. The SEC’s savings goal calculator works the same idea from the other direction, starting from a target and a monthly contribution; the dashboard reports the rate a household is actually running. Person 1 Contribution and Person 2 Contribution split the income pie, 52.6 percent and 47.4 percent, which is the same information the split ratio uses conceptually but measured on actual earnings rather than the chosen cost share. A household can compare the two: Person 1 brings in 52.6 percent of the income but, at the even 50 percent split ratio, carries exactly half the shared costs. Whether those should line up is a conversation the numbers inform rather than settle.
Below the tiles, a budget health summary lists the building blocks in plain rows, Person 1 and Person 2 monthly income, total shared expenses, each person’s personal expenses, total expenses, and net household savings, so the whole calculation is visible in one place rather than hidden inside the tiles. The dashboard also carries an expense-breakdown view and a budget-versus-actual-by-category view that read the same underlying rows, giving the month a visual as well as a numeric summary.
The household metrics in plain terms
None of the dashboard figures require a finance background, but a few are worth stating plainly because they are the numbers a household will talk about.
Savings rate (1,438 ÷ 8,275 = 17.4 percent) is the share of income left after everything the household spent, both joint and personal. It is the closest thing to a single score for the month.
Contribution percentages (4,350 ÷ 8,275 = 52.6 percent, and 3,925 ÷ 8,275 = 47.4 percent) show how the income is sourced between two earners. They do not decide anything on their own, but they give a factual basis for a discussion about how to set the split ratio.
The split ratio and the settlement figure are the mechanics of fairness. The ratio decides each person’s responsible share of the shared bills, 50 percent of 5,264, or 2,632 each in the sample. The settlement figure, 54 owed to Person 1, adjusts for the fact that people rarely pay exactly their share in real time. Together they let a household that keeps some money separate square up without an argument about who covered what.
Budget utilization (6,837 ÷ 6,750 = 101.3 percent) is the plan-versus-reality score, a hair over 100 percent meaning the household spent just above what it planned. It is the fastest read on whether the month went roughly as intended.
Excel or Google Sheets for a household budget
The workbook is an .xlsx file built on ordinary formulas, SUM, SUMIF, and IF, with no macros and no add-ons, so it behaves the same in Microsoft Excel and in Google Sheets after an upload, and in LibreOffice Calc as well. The choice comes down to how a household works. Google Sheets suits couples who want the file in a shared drive so both people can enter their own income and personal spending from separate devices. That matters more here than in a solo budget, because two people are doing the data entry. Excel suits a household that prefers a local file on one machine. The split-ratio math, the Paid By settlement, and the rollups described here are all reproducible in either program if you would rather build the structure yourself than buy it ready-made.
Which household budget template fits
The Household Budget template comes in three tiers, and the difference between them is how much structure a household wants.
- Household Budget Ultimate Spreadsheet Template ($29) is the workbook this walkthrough follows: the two-earner Income Setup with its split ratio, the thirty-row Shared Expenses sheet with Paid By settlement, side-by-side Individual Expenses, the twelve-month tracking grid, the automatic Budget vs Actual sheet, and the six-tile dashboard, ready for Excel or Google Sheets.
- The free Household Budget is one sheet: two income rows, a single list of household costs budgeted against actual, and a Left over line at the bottom, with no split ratio and no separate personal spending. The Essentials version ($19) is where the two-person structure starts, giving each partner an income section and a personal spending section alongside the shared categories, adding a percent-of-income column and a dashboard, and sitting between the free sheet and the Ultimate workbook.
- If a household’s real need is granular spending detail rather than the two-person split, the Expense Tracker Ultimate Spreadsheet Template ($29) logs individual transactions and rolls them into monthly summaries and spending trends, a different job from dividing shared bills between two earners.
Related
- 50/30/20 Budgeting in a Spreadsheet: Complete Guide - a proportional method for anyone who wants a rule for splitting income before tracking it
- How to Build a 50/30/20 Budget in a Spreadsheet - the same walkthrough treatment for the needs, wants, and savings split
Frequently asked questions
How does the shared expense split ratio work?
Income Setup holds one number, Person 1's share of the shared costs, set to 50 percent in the sample for an even split. Everything downstream reads it. On the Shared Expenses sheet the responsibility summary multiplies the shared total by that share to show what each person is accountable for, so a household where one earner covers more can set 60 or 70 percent instead. Person 2's share is always one minus Person 1's, so the two halves add back to the full total.
What is the 'owed to Person 1' number, and when do I settle it?
It is the settlement figure for bills one person paid alone out of their own pocket. Anything marked Split in the Paid By column already came out of shared money at the ratio, so it needs no settling. For the rest, the sheet compares what Person 1 actually paid directly against the share they were responsible for and reports the difference. In the sample, Person 1 paid 335 directly and their responsible share of those direct-paid bills was 281, so 54 is owed back to Person 1. A negative figure would mean Person 1 owes Person 2.
Can roommates or a three-person household use it?
The file is built around two people, Person 1 and Person 2, each with their own income block and personal-spending column, and the split ratio divides shared costs between exactly those two. Roommates who split evenly can use it as-is by treating each side as one person. A third person does not have a dedicated slot, so a three-way household would either fold two people into one column or keep a second copy of the file and reconcile by hand.
What is the difference between the Monthly Tracking and Budget vs Actual sheets?
They answer different questions. Budget vs Actual compares this month's planned figures against what was actually spent, category by category, and is fed automatically from the two expense sheets. Monthly Tracking is a twelve-column grid, one column per month, where a full year of category totals is typed in so seasonal patterns and trends become visible. One is a single-month plan-versus-reality check; the other is a year-long history.
Does changing the currency convert the underlying numbers?
No. The currency control on the Dashboard is a labeling tool. Picking a symbol from the list of more than thirty relabels every column header and KPI caption that carries an amount, so 8,275 reads in euros or pounds instead of dollars, but the number itself does not change. It is a display swap, not a conversion, so anyone switching currencies would re-enter figures at the new currency's scale.
Sources
- Budgeting: How to create a budget and stick with it - Consumer Financial Protection Bureau
- Savings Goal Calculator - U.S. Securities and Exchange Commission (Investor.gov)
About this article
Sheets, inputs, figures, and formulas checked on 2026-09-10 against the shipped Household Budget Ultimate workbook (Dashboard, Income Setup, Shared Expenses, Individual Expenses, Monthly Tracking, Budget vs Actual, How to Use), plus the free and Essentials Household Budget files for the tier comparison. CFPB budgeting guidance and the SEC Investor.gov savings calculator checked against the live pages at writing time. Last reviewed September 2026.