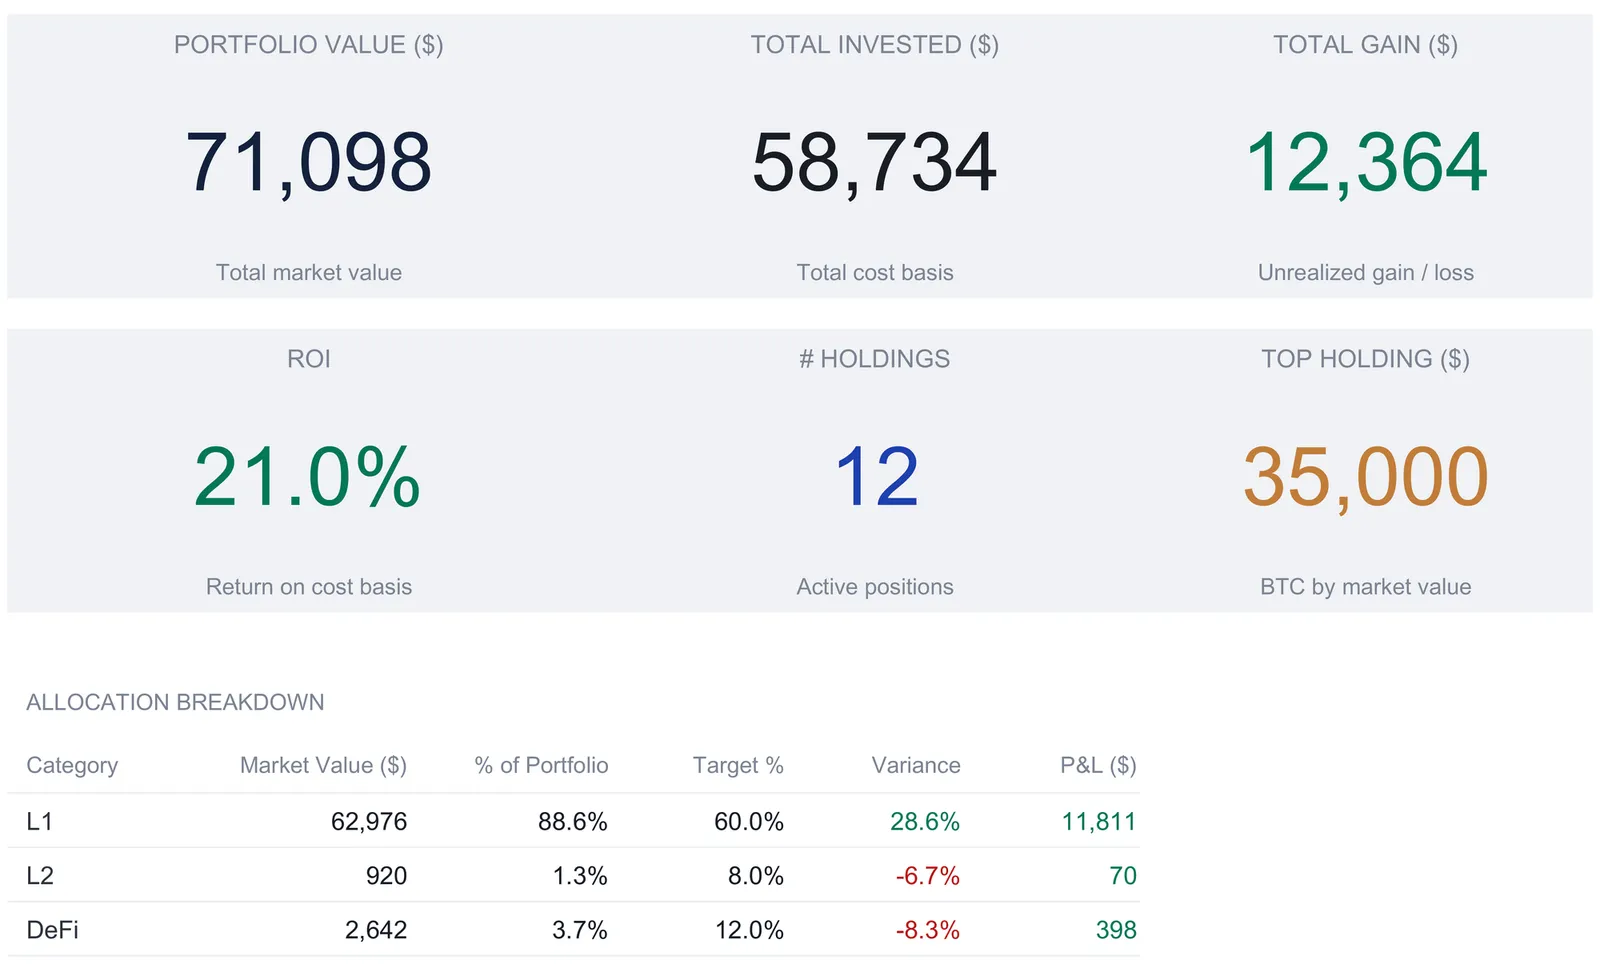
A crypto portfolio tracker keeps every coin on one holdings sheet and derives the rest from it: market value, unrealized P&L, ROI, allocation by category, and a six-tile dashboard. This walkthrough follows the full structure using the workbook's sample portfolio, twelve holdings worth $71,098 against $58,734 invested, a $12,364 unrealized gain, and a 21.0% return on cost basis. Prices are manual snapshots you update, not a live feed. Our Crypto Portfolio Tracker Ultimate ($29) ships the same structure for Excel and Google Sheets.
A crypto portfolio generates a surprising amount of financial data for something that lives in a few apps. A dozen coins, each bought across several dates at different prices, sit in wallets and exchanges that each show their own slice and none of which show the whole. Most holders can answer “what is my Coinbase balance worth right now?” Far fewer can answer “what did I actually pay in total, how much of that is unrealized gain, and how much of the portfolio is sitting in one coin?” The gap between those questions is structure, and a spreadsheet handles it well.
That structure is a handful of pieces: one holdings sheet that lists every coin, a transaction log of every move, a set of category targets, and the numbers that fall out of them (market value, unrealized profit and loss, return, and allocation). The examples below come from our Crypto Portfolio Tracker Ultimate Spreadsheet Template ($29), which ships the whole thing ready-made for Excel and Google Sheets. The layout is reproducible by hand if you would rather build your own.
One thing to settle up front: this file does not connect to any exchange and does not pull live quotes. The Current Price for each coin is a cell you fill in, so every derived number reflects the snapshot you last entered. That is a deliberate design choice, not a missing feature, and the section on prices below covers what it changes in practice.
What a crypto portfolio tracker has to hold
Strip away the exchange apps and there are only a few kinds of data worth keeping:
- Per-coin positions. For every holding: quantity, the average price you paid, the current price, and a tag for what kind of asset it is. This is the raw material for everything else.
- A transaction record. Every buy, sell, transfer, stake, and reward, with its date, quantity, price, and fee. A running log that a single blended position cannot capture on its own.
- Targets and lots. The allocation percentages you are aiming for by category, and the individual purchase lots that determine holding periods for tax.
- Derived metrics. Market value, unrealized profit and loss, return on cost, and allocation variance. These are calculations, not entries; in a well-built sheet, nothing here is ever typed.
The tracker gives each of these its own sheet. The tab order is Dashboard, Holdings, Transaction Log, DCA Tracker, Tax Lot Tracking, and Allocation Analysis, with a How to Use sheet carrying the instructions. Everything flows from Holdings, so that is where the work starts.
The Holdings sheet is the engine
The Holdings sheet is the one place a position is ever described, and the Dashboard, Allocation Analysis, and Tax Lot Tracking sheets all read back from it. Four columns are formulas and the other seven are entries. You type the coin name, ticker, quantity, average cost per unit, current price, the wallet it sits in, and a category tag. The sheet then computes:
- Market value = quantity × current price
- Total cost = quantity × average cost per unit
- Unrealized P&L = market value - total cost
- P&L % = unrealized P&L ÷ total cost
The sample portfolio holds twelve coins. Bitcoin leads with 0.8 BTC bought at an average of $35,000 and marked at $43,750, so it shows a $35,000 market value against $28,000 of cost and a $7,000 unrealized gain, up 25.0%. Ethereum runs 5 ETH at a $2,200 average against a $2,640 mark, a $13,200 value on $11,000 of cost. The rest of the list runs down through Solana, Chainlink, Avalanche, and Polkadot on the layer-one side, then Polygon, Uniswap and Aave, the USD Coin and Tether stablecoins sitting flat at a dollar, and a Dogecoin position. The twelve positions are spread across eight venues, from a Ledger hardware wallet to Coinbase, Binance, and Robinhood.
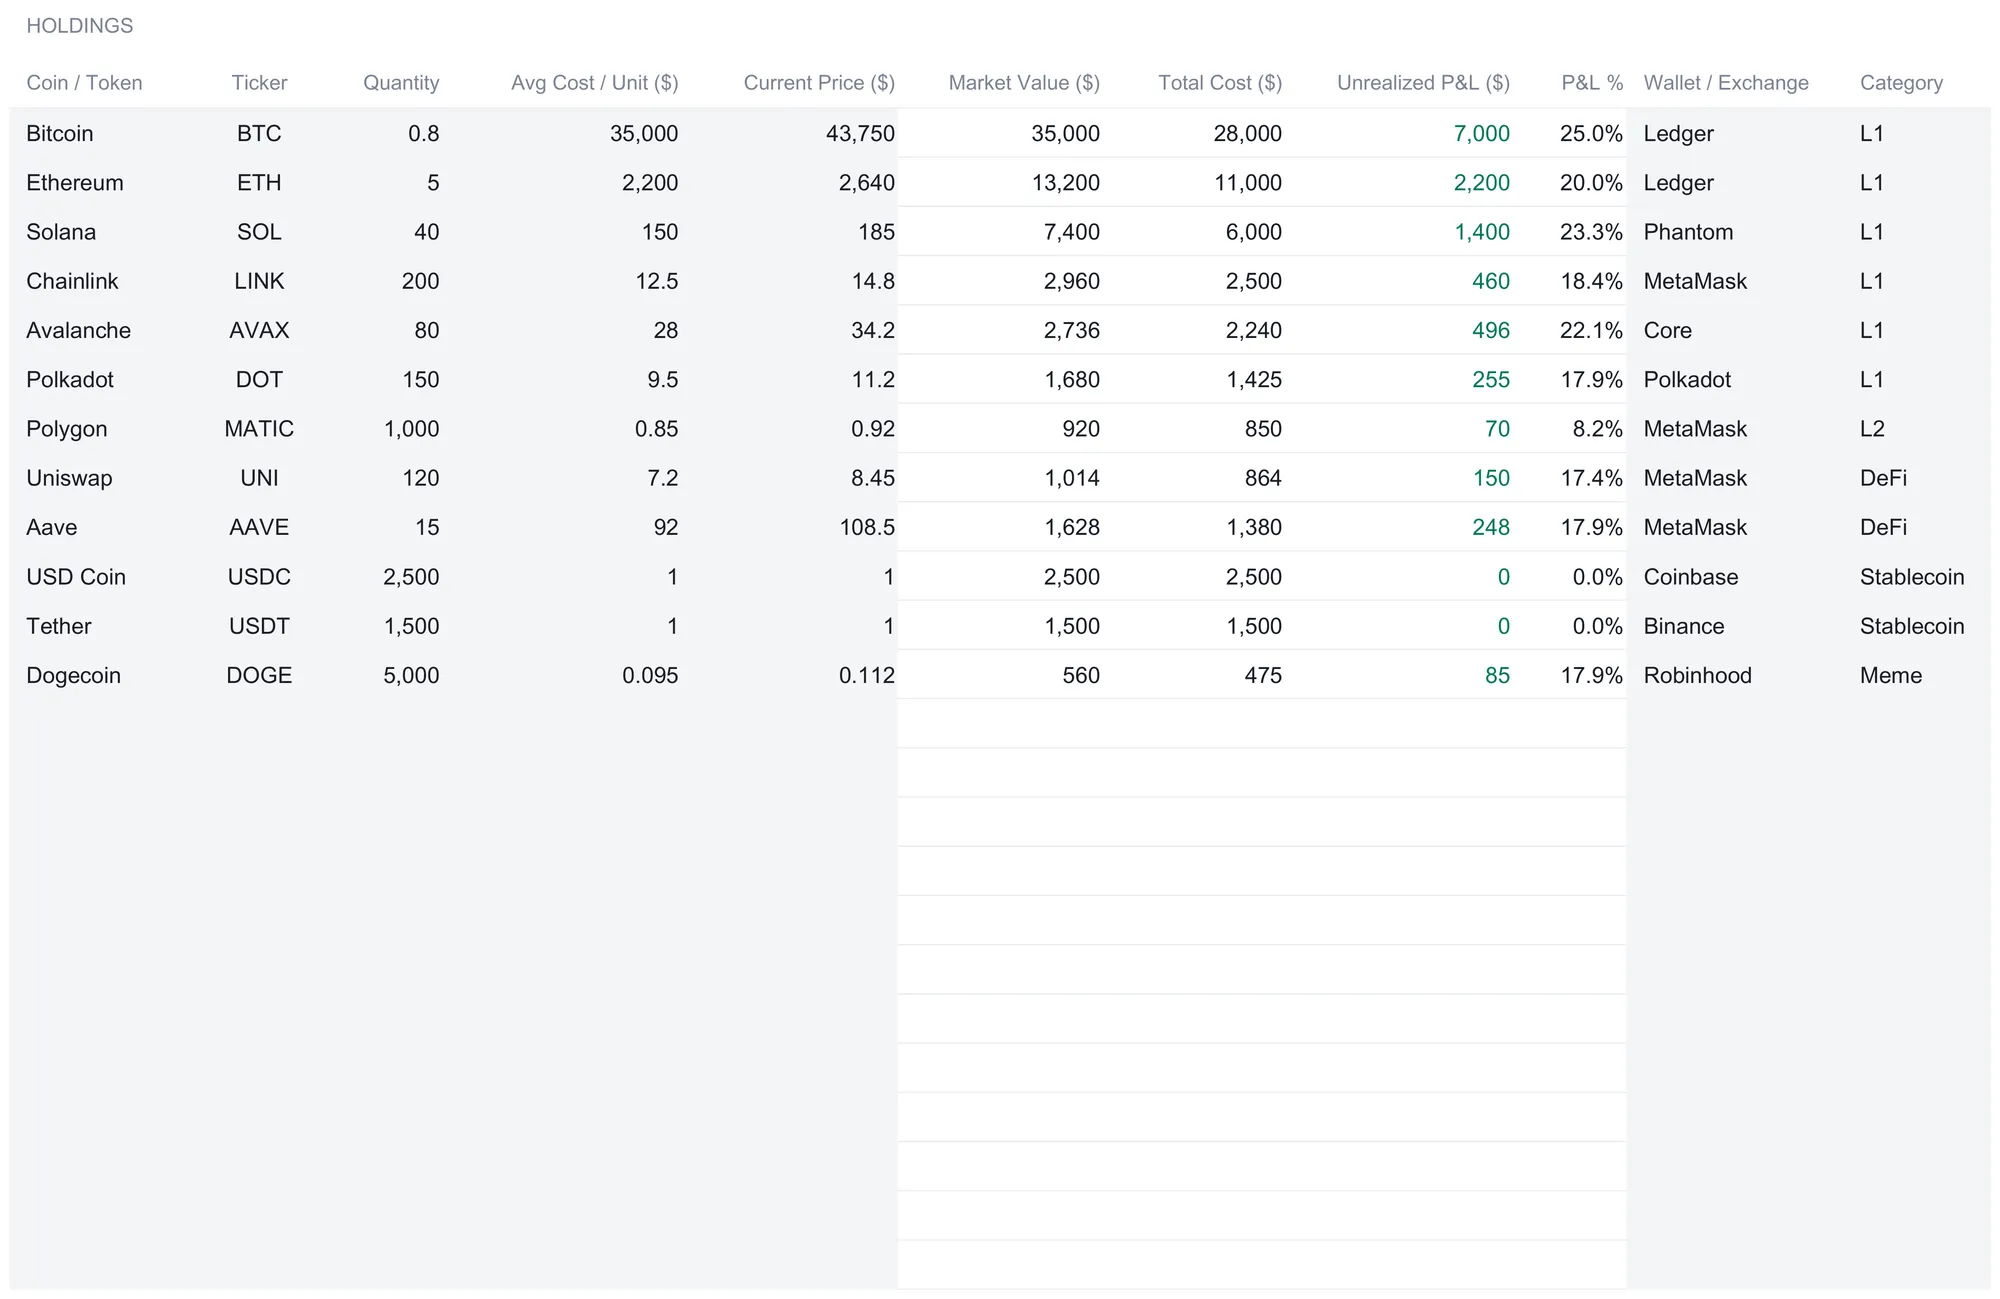
The full sample list reads like a fairly typical mid-size portfolio, heavy at the top and thinning out through the smaller positions:
| Coin | Qty | Avg cost ($) | Price ($) | Market value ($) | Unrealized P&L ($) | Category |
|---|---|---|---|---|---|---|
| Bitcoin (BTC) | 0.8 | 35,000 | 43,750 | 35,000 | 7,000 | L1 |
| Ethereum (ETH) | 5 | 2,200 | 2,640 | 13,200 | 2,200 | L1 |
| Solana (SOL) | 40 | 150 | 185 | 7,400 | 1,400 | L1 |
| Chainlink (LINK) | 200 | 12.5 | 14.8 | 2,960 | 460 | L1 |
| Avalanche (AVAX) | 80 | 28 | 34.2 | 2,736 | 496 | L1 |
| Polkadot (DOT) | 150 | 9.5 | 11.2 | 1,680 | 255 | L1 |
| Polygon (MATIC) | 1,000 | 0.85 | 0.92 | 920 | 70 | L2 |
| Uniswap (UNI) | 120 | 7.2 | 8.45 | 1,014 | 150 | DeFi |
| Aave (AAVE) | 15 | 92 | 108.5 | 1,628 | 248 | DeFi |
| USD Coin (USDC) | 2,500 | 1 | 1 | 2,500 | 0 | Stablecoin |
| Tether (USDT) | 1,500 | 1 | 1 | 1,500 | 0 | Stablecoin |
| Dogecoin (DOGE) | 5,000 | 0.095 | 0.112 | 560 | 85 | Meme |
The two stablecoins are worth a word on their own. Held at a dollar with a dollar cost basis, USDC and USDT show a zero unrealized gain by design, which is exactly what you want a dollar-pegged coin to do on this sheet: it parks value without pretending to a return. Their presence is why the stablecoin category later reads as flat.
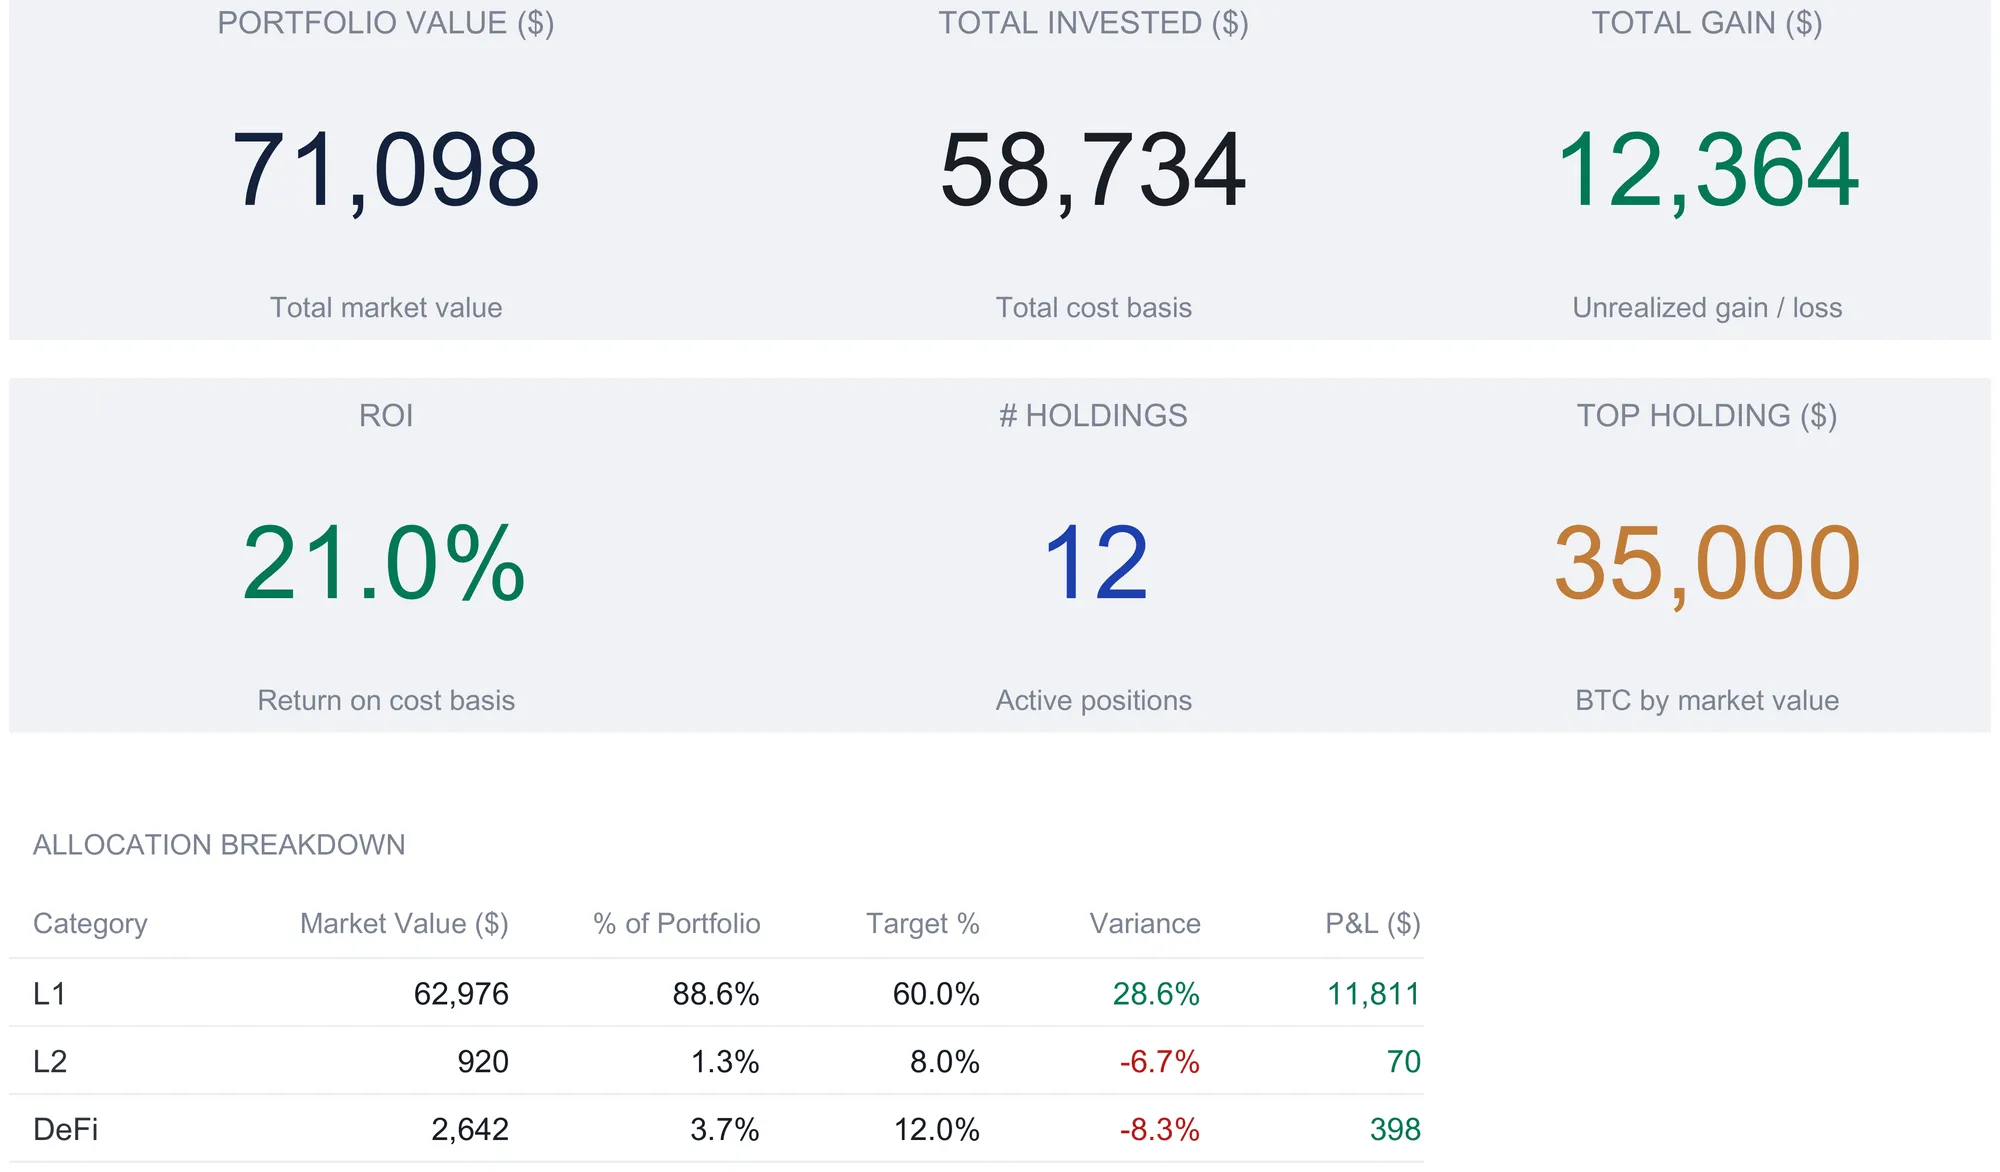
At the foot of the sheet, a totals row sums the columns: $71,097.50 of market value, $58,734 of total cost, and a $12,363.50 unrealized gain, which works out to a 21.0% return on cost basis. Those four totals are exactly what the dashboard’s first four tiles report, rounded for display to a $71,098 portfolio value, $58,734 invested, a $12,364 total gain, and a 21.0% ROI. The top row carries the first three; the second row opens with that ROI, then counts twelve active positions and names the top holding, $35,000 of BTC by market value, using a formula that finds the largest market value and returns its ticker. Change one current-price cell on Holdings and all six tiles move together, because they all point back to this one sheet.
Two design details are worth copying into any hand-built version. First, the blank rows below the twelve holdings are pre-wired: they already carry the market-value, cost, and P&L formulas and already sit inside every total, so the thirteenth coin goes on the first free row and the whole workbook updates with nothing to drag down. Second, the category tag in the last column is what powers the allocation views later, so tagging each coin as you add it is what keeps those sheets honest.
Record every move: the Transaction Log
A single blended position on Holdings tells you where a coin stands now, but not how it got there. The Transaction Log is the running history: one row per action, with date, coin, type, quantity, price per unit, a computed total value, the fee, and the exchange or wallet. The type column takes five values, and the sample uses all of them, buy, sell, transfer, stake, and reward.
The ten sample rows run from a mid-August 2026 purchase of 0.05 BTC at $43,200 back through a 1 August stake of 10 SOL, a small 0.12 SOL staking reward in late July, a 500 USDC transfer into MetaMask, and a June sale of 0.5 ETH at $2,720. A totals block at the bottom uses SUMIF and COUNTIF to group everything by type: six buys worth $8,426, one sell worth $1,360, a single $500 transfer, a $1,800 stake, and the $21.36 reward. Across all ten rows the log tallies $12,107.36 of activity and $38.90 in fees, and a net line subtracts sells from buys to leave $7,066 of net buying.
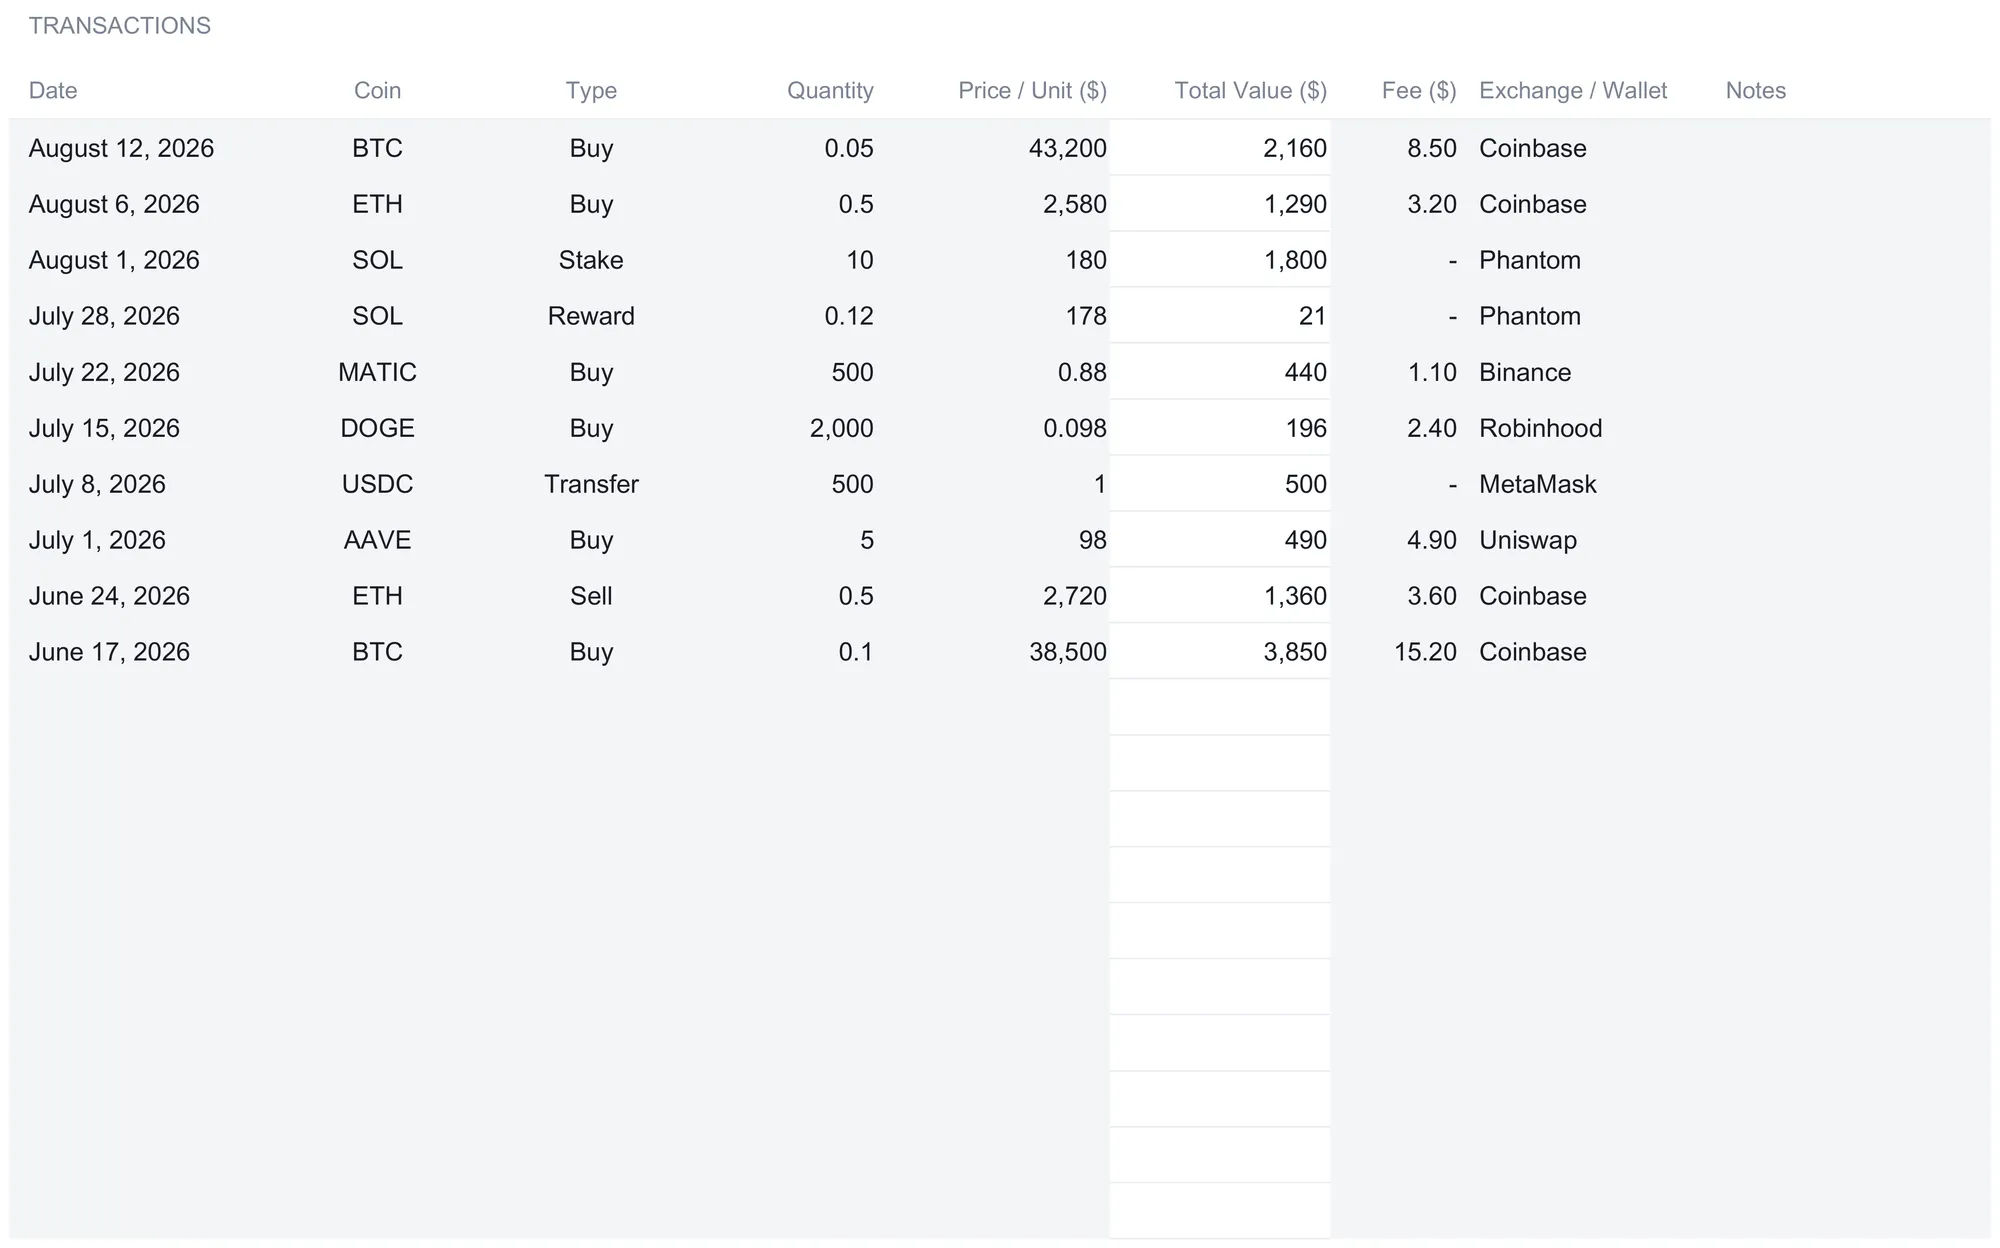
Two of those five types are not purchases at all. A stake locks a coin up to earn yield and a reward is the yield it pays, so recording them as their own transaction types keeps them out of the buy and sell tallies while still leaving a record that they happened. The sample shows this cleanly: the 10 SOL stake and the 0.12 SOL reward both land in their own buckets rather than inflating the buy count. A Notes column sits at the end of every row for anything the other columns do not capture, a transfer’s destination or the reason for a sale, and it stays empty in the sample so the structure shows through.
The log sits alongside the Holdings sheet rather than feeding it automatically, and that separation is deliberate. Holdings carries the current blended position you maintain; the Transaction Log is the audit trail of individual events. Keeping them separate means a staking reward or a transfer between your own wallets gets recorded as history without silently changing an average-cost figure you set deliberately. The fee column is easy to overlook and adds up: $38.90 across ten transactions here, and a busier year of trading turns that into a number worth seeing in one place.
Plan contributions: the DCA Tracker
Dollar-cost averaging, buying a fixed amount on a schedule rather than all at once, is common enough in crypto that it gets its own sheet. The DCA Tracker takes a monthly amount and a number of months for each coin and works out the total committed, then compares an average cost against the current price to show a return per position.
The sample runs five DCA positions. A $500-a-month Bitcoin plan over twelve months totals $6,000 at a $36,400 average against the $43,750 mark, a 20.2% total return. A $300 Ethereum plan over the same twelve months totals $3,600 and shows 21.1%. Shorter runs follow: Solana at $200 for eight months, Chainlink at $100 for six, and Avalanche at $150 for six. The five plans add to $12,700 committed. Below the table, a twelve-month grid lays out each plan month by month, so the Solana row shows $200 in each of the first eight columns and zeros afterward, while Chainlink and Avalanche fill only their first six.
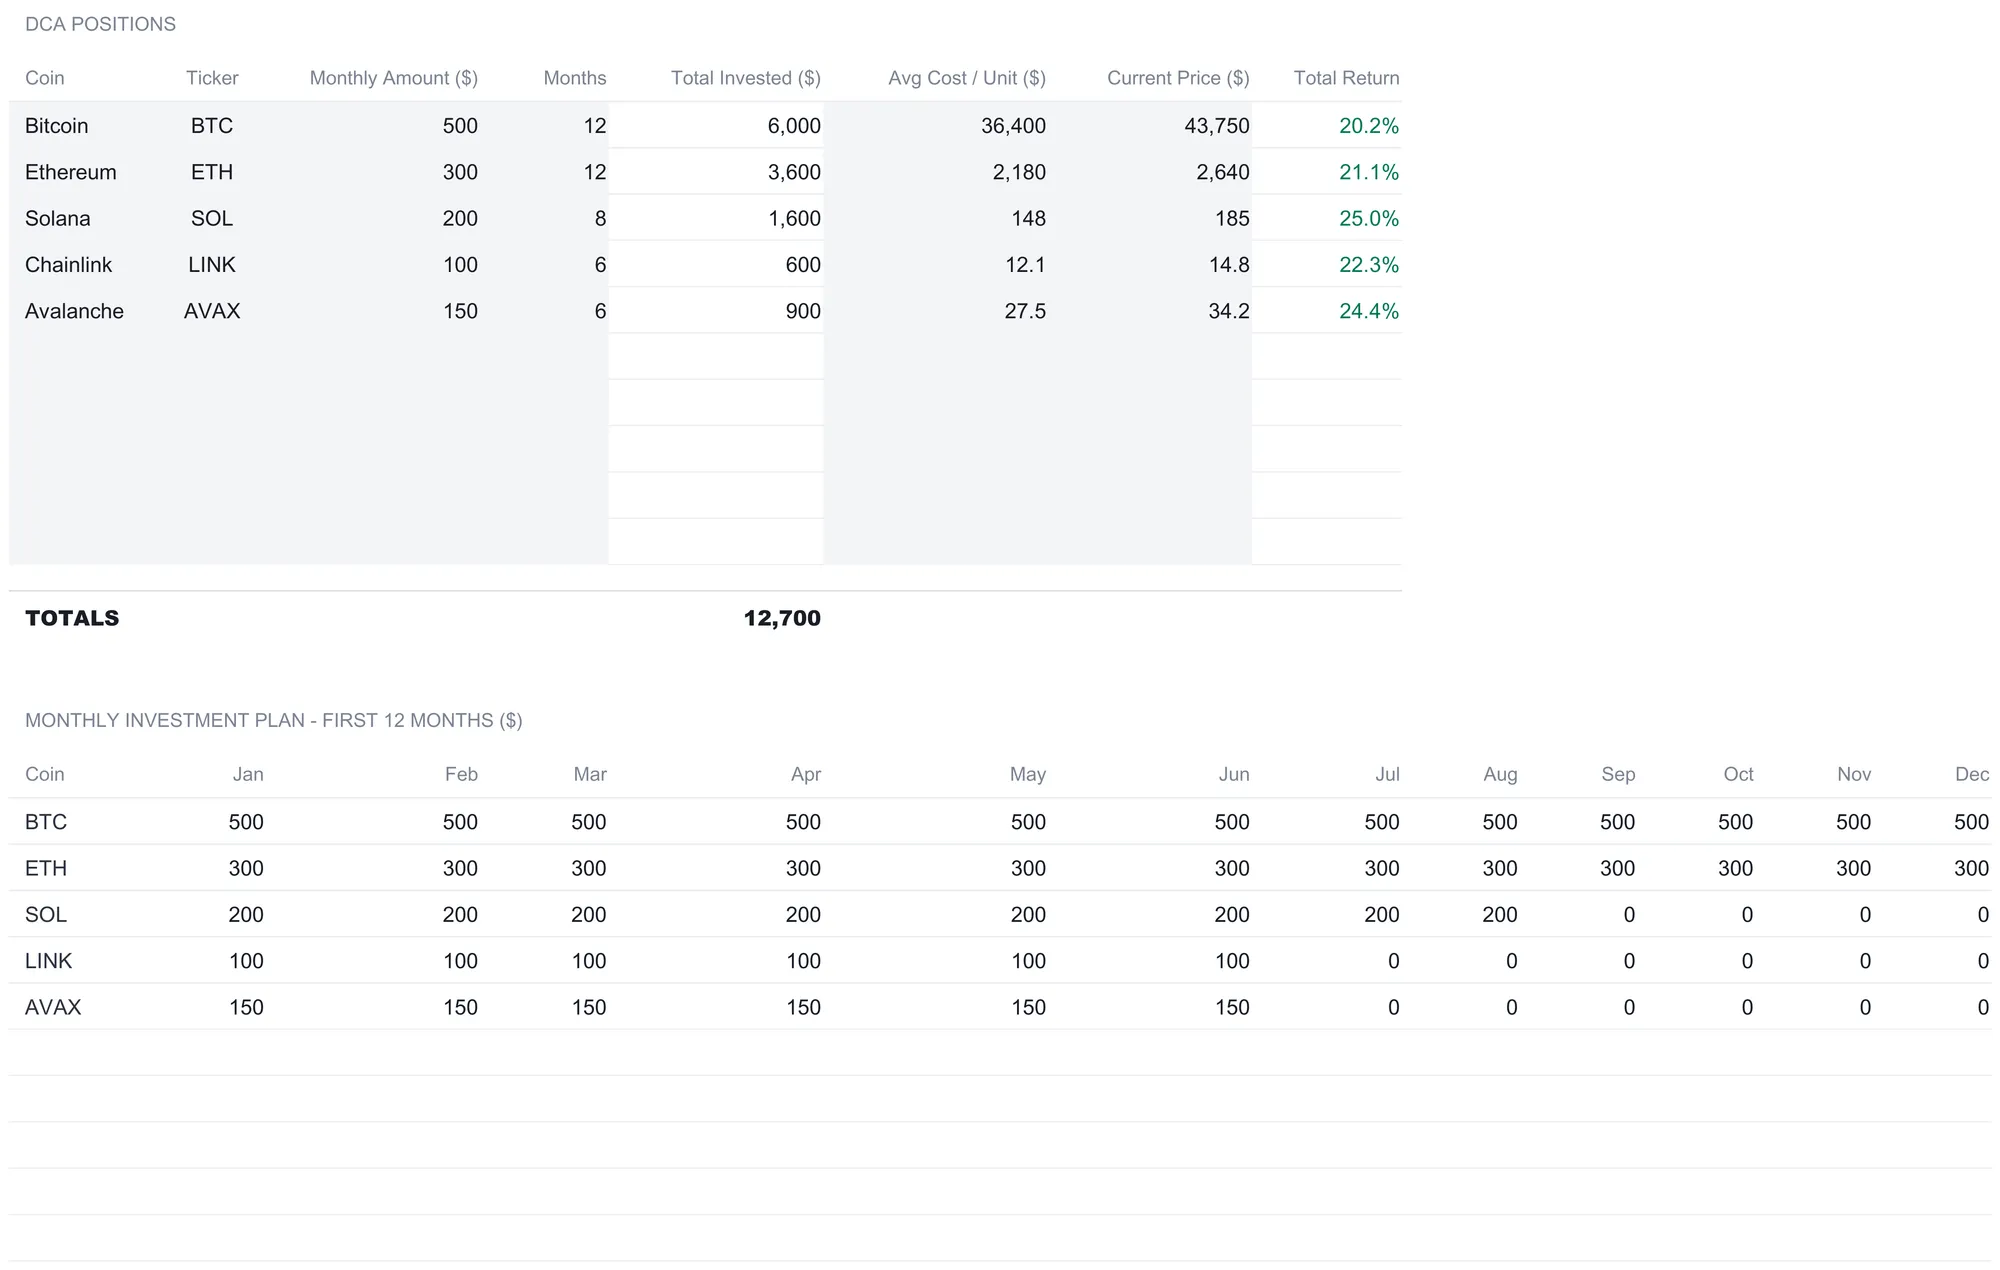
The DCA sheet is a separate scenario from Holdings, which is why its average-cost figures differ, $36,400 for the BTC plan here against the $35,000 blended average on Holdings. One models a regular-contribution schedule; the other holds your actual current position. A note on the sheet spells out that a plan running longer than twelve months shows only its first twelve in the grid while the total invested figure still covers the whole run, so the two do not contradict each other.
Lots and holding periods: the Tax Lot Tracking sheet
Holdings blends each coin into one average, which is fine for reading current value but loses the information tax reporting needs: when each piece was bought. The Tax Lot Tracking sheet keeps that detail. Each row is a single purchase lot with its own date, quantity, and cost basis per unit, and the sheet pulls the current price from Holdings to compute the lot’s current value and unrealized gain.
The sample lists ten lots. Bitcoin alone splits into three: 0.3 BTC from November 2024 at $30,500, 0.25 from March 2025 at $41,000, and 0.25 from June 2026 at $34,400. Ethereum splits into three lots too, one of which, a February 2025 purchase at $2,800, currently sits at a $320 unrealized loss while the others show gains. A Holding Period column labels each lot long-term or short-term by comparing its purchase date with today: hold for a year or more and it reads long-term, under 365 days and it reads short-term. Because that test reads the current date, a lot flips from short-term to long-term on its own as it crosses the one-year mark, with nothing to edit.
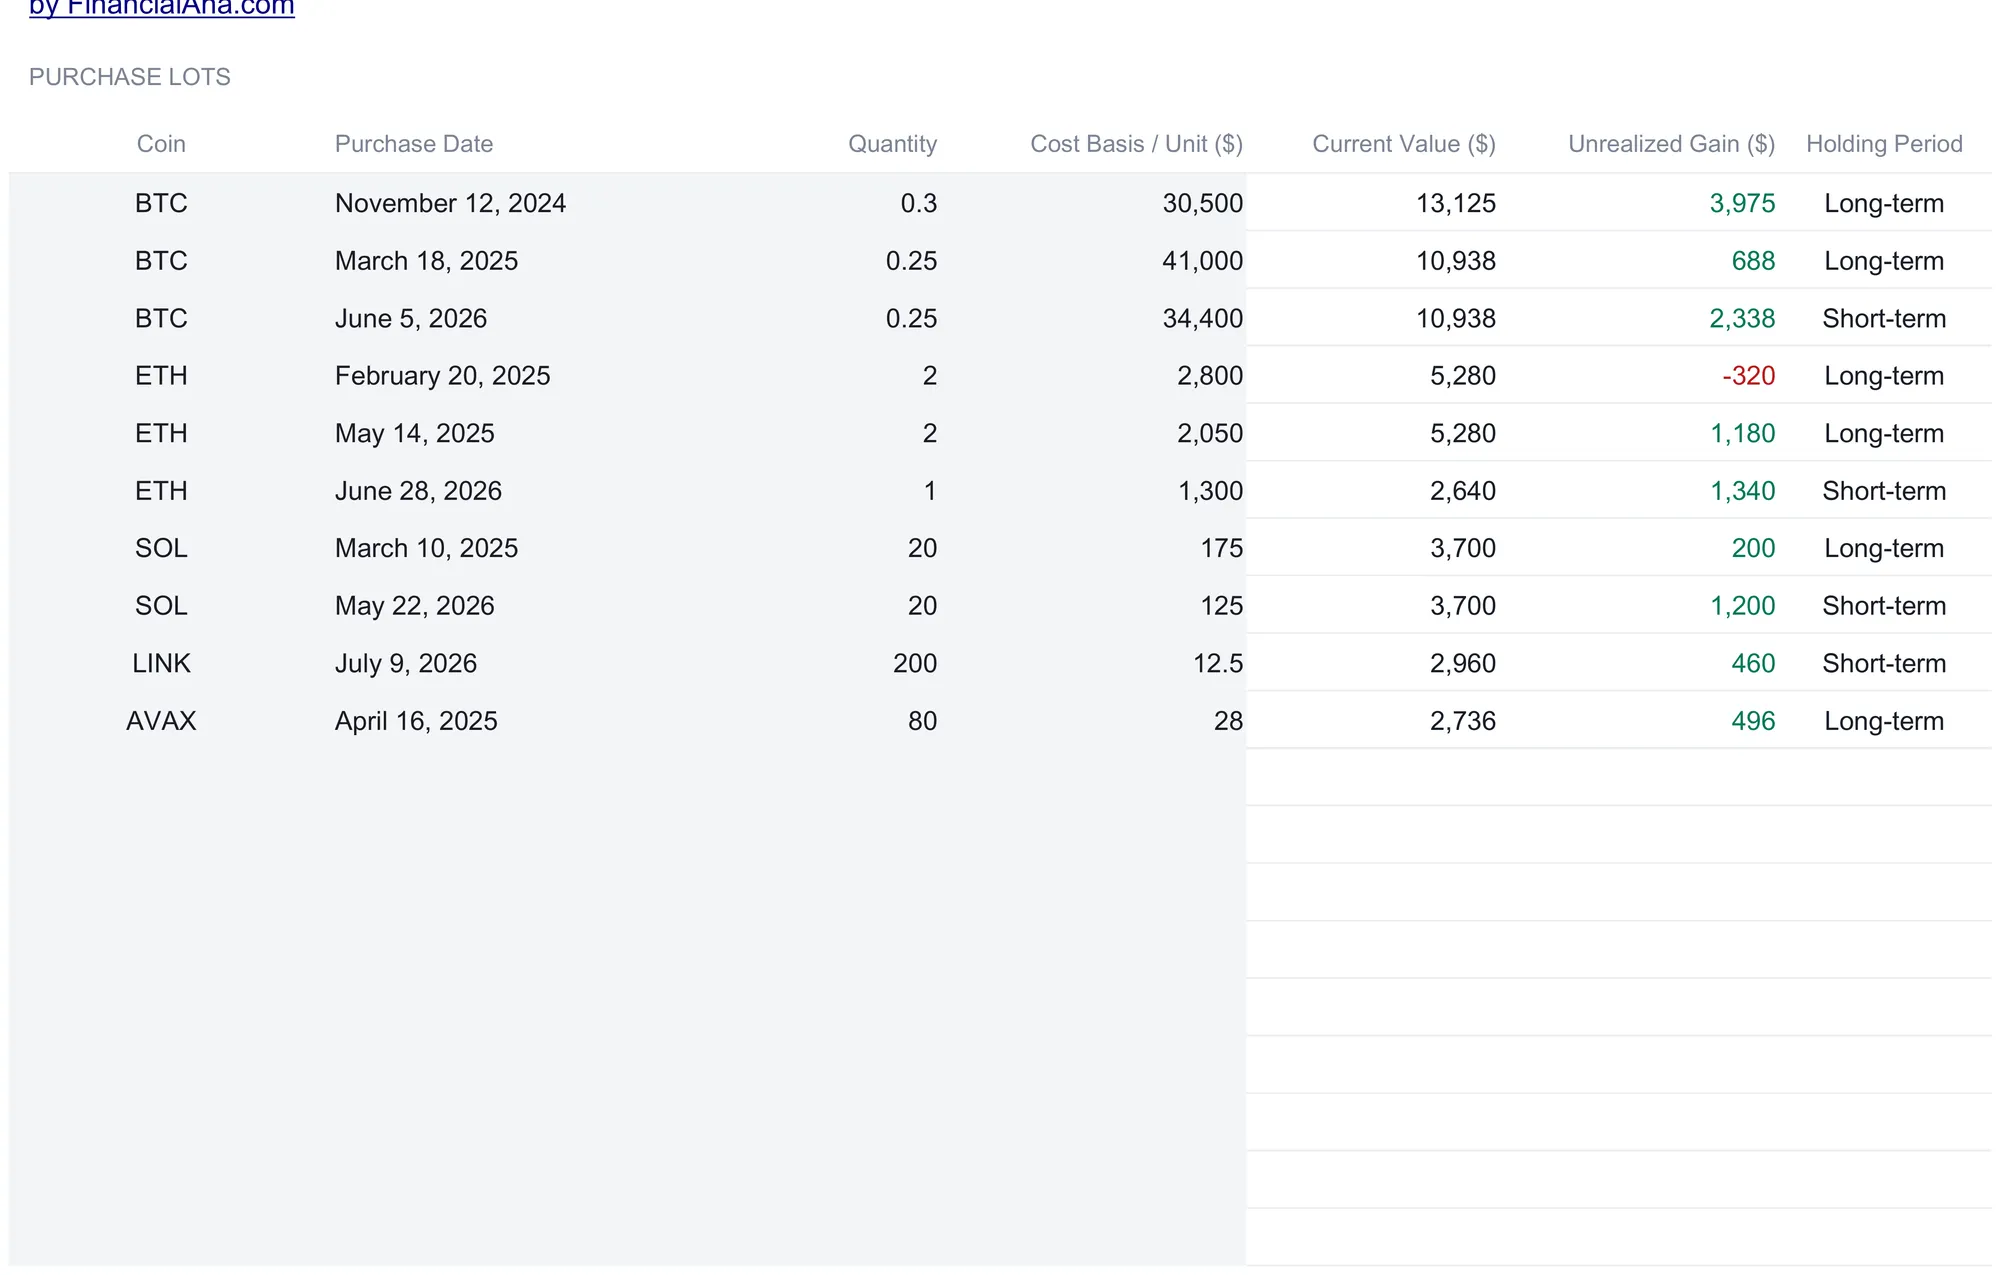
Below the lots, a capital-gains estimate groups the unrealized gains by holding period. In the sample, short-term lots carry $5,337.50 of unrealized gain and long-term lots carry $6,218.50, which add to the $11,556 across all lots. Two columns apply illustrative rates the workbook labels 20% and 37%, so the short-term line shows an estimated $1,067.50 at the lower rate and $1,974.88 at the higher one, with the long-term line calculated the same way. A note on the sheet adds two cautions. Which rate applies, and to which gains, depends on your own circumstances. Short-term and long-term gains should add up to the all-lots figure, and if they do not, a lot is missing its date. These are estimates on unrealized positions, a way to see the shape of a potential tax picture rather than a filing figure.
Target versus actual: the Allocation Analysis sheet
The last working sheet answers the concentration question. Allocation Analysis sums market value by category tag and sets it against target percentages you choose, so you can see how the actual mix compares with the one you were aiming for. Its own subtitle frames the job as comparing target versus actual allocation and identifying rebalancing opportunities.
The sample makes the point vividly. Against a 60% target for layer-one coins, the L1 tag sits at 88.6% of the portfolio, a positive variance of 28.6 points that the sheet colors green. Every other category comes in under its target: L2 at 1.3% against 8%, DeFi at 3.7% against 12%, stablecoins at 5.6% against 12%, meme coins at 0.8% against 3%, and an empty Other bucket against 5%. The targets sum to 100% and so does the actual column. A second table, Category Performance, shows the money behind those percentages: L1 holds $62,976 of value on $51,165 of cost for an $11,811 gain, while the stablecoin category sits flat at $4,000 of value on $4,000 of cost.
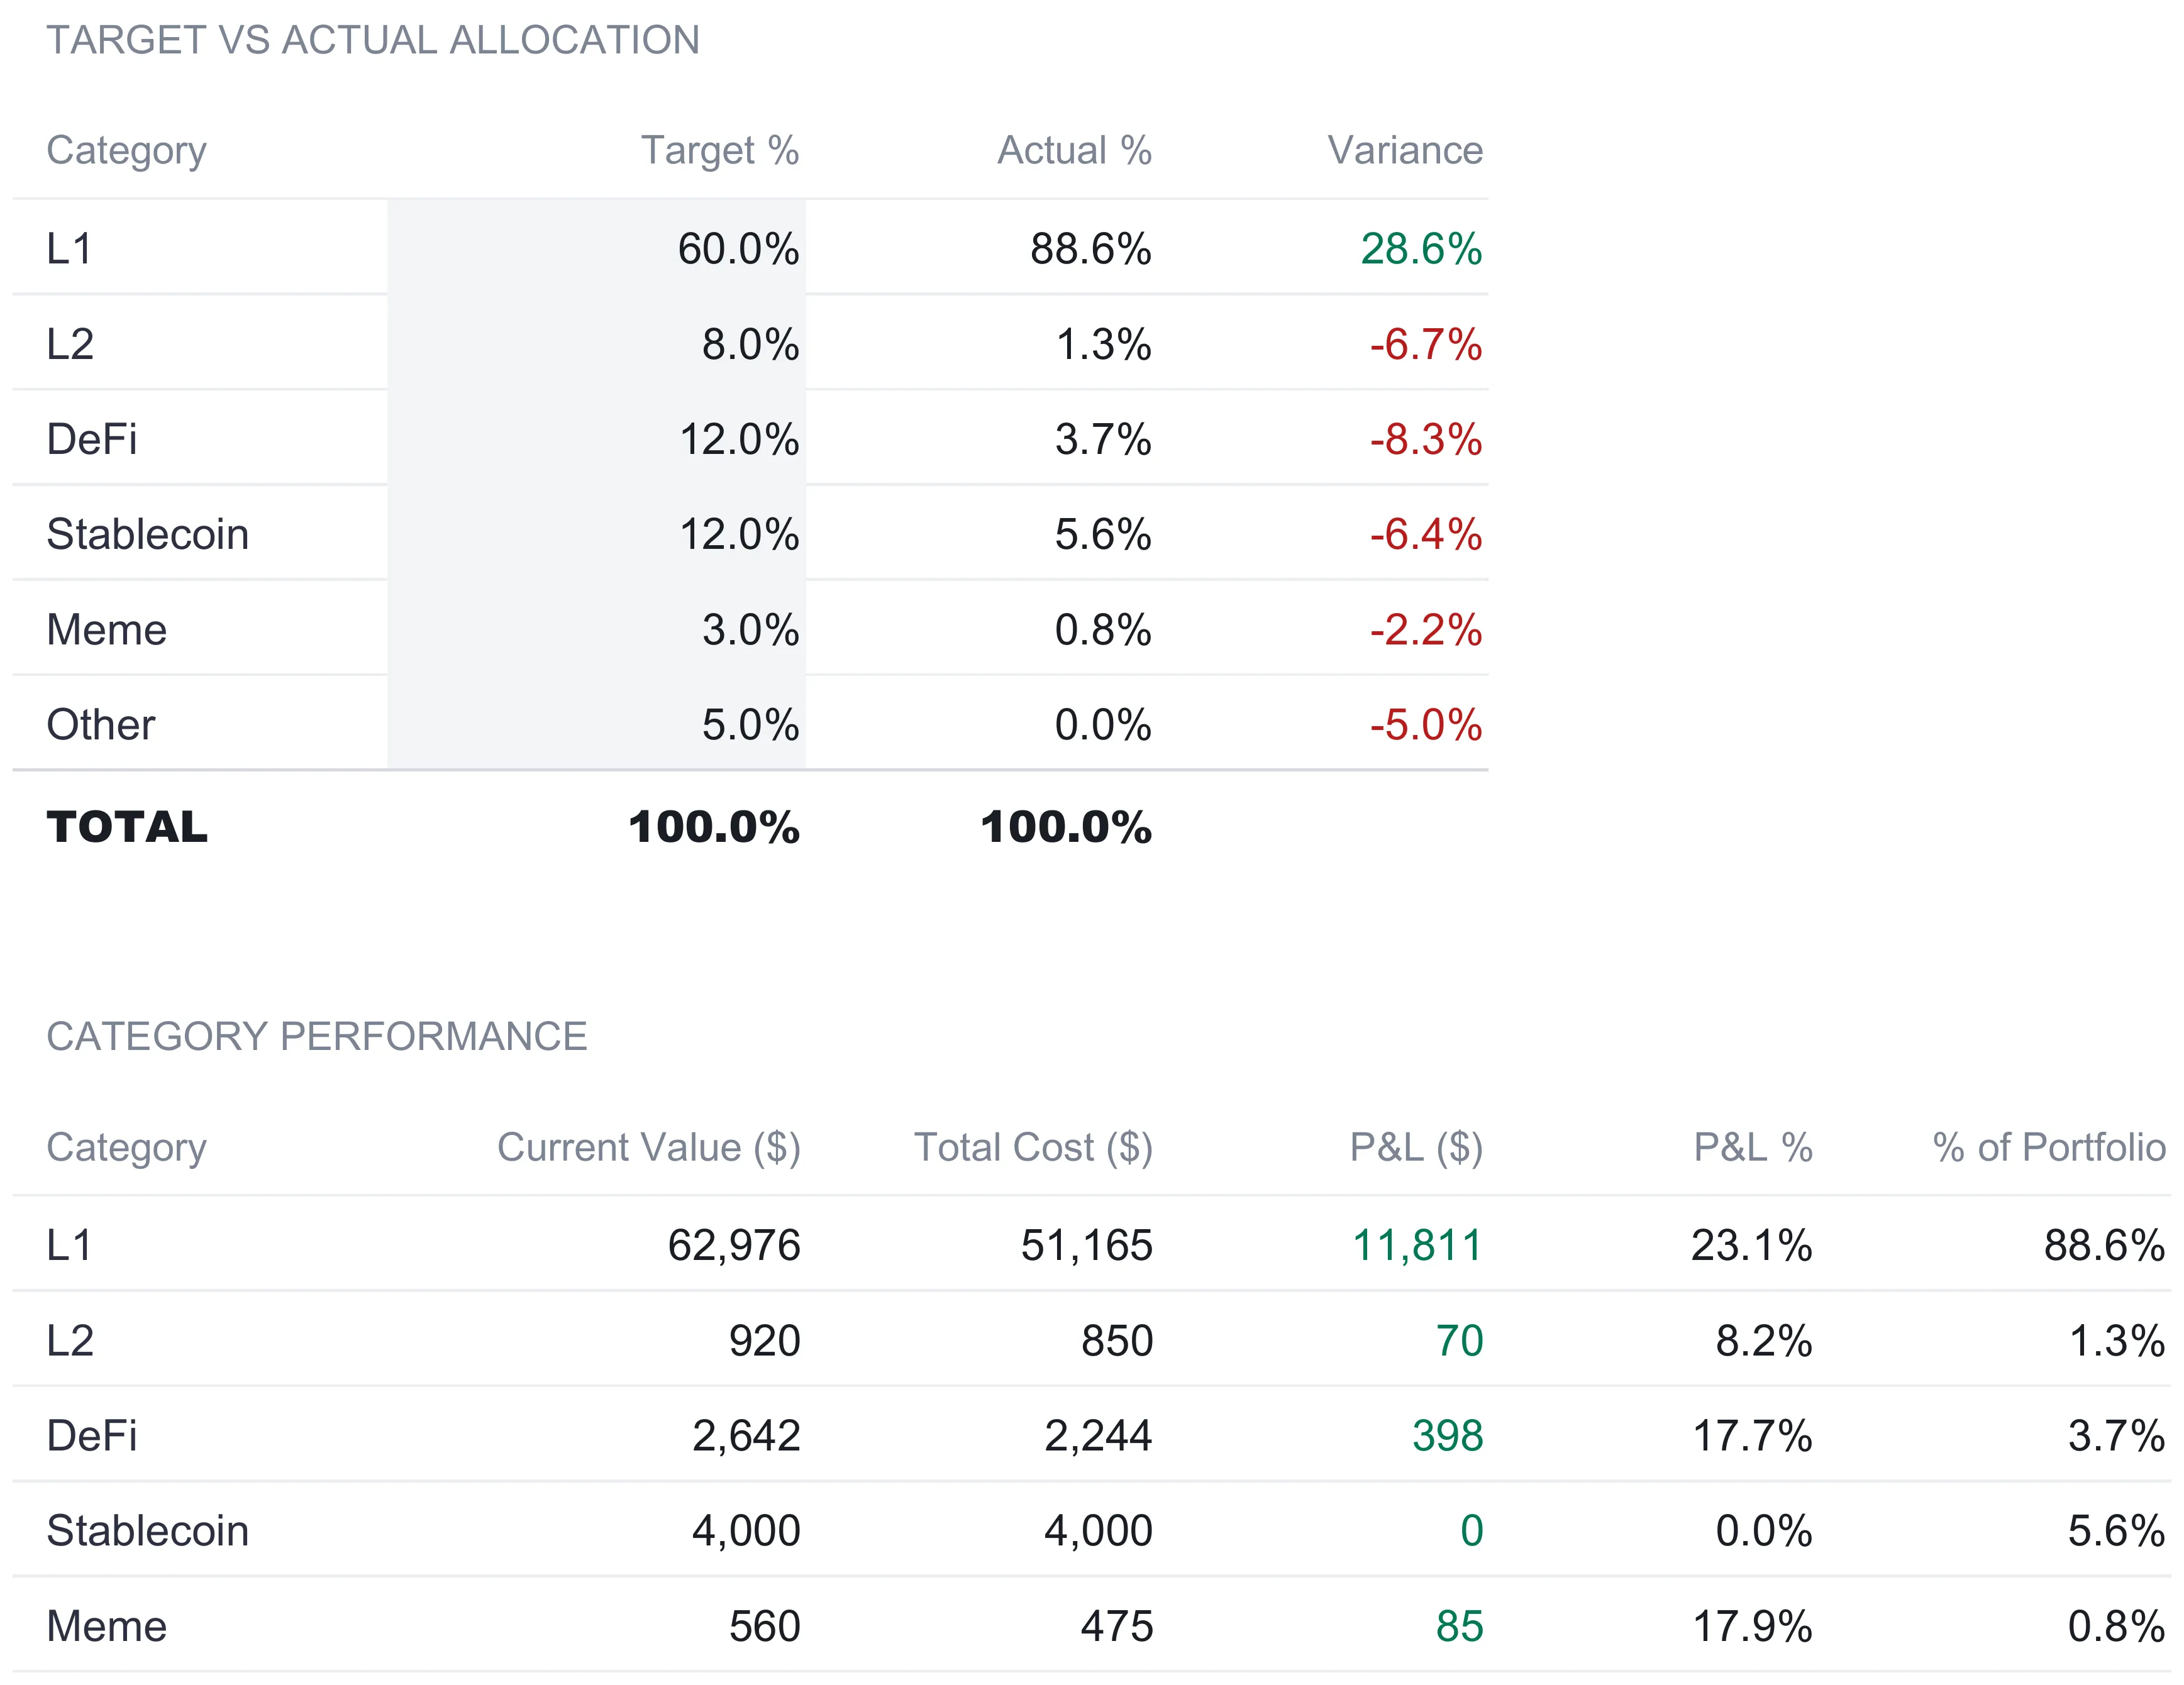
Further down, a rebalancing sensitivity grid puts a number on concentration. It first identifies the largest single holding, BTC, and reports its weight now at 49.2% of the whole portfolio, then lays out a small table where each cell is the portfolio return that a price move in one position produces at a given weight, with everything else held flat. The weights down the side and the price moves across the top are yours to change. At a 0.5 weight, a 30% price move in that one position works through to a 15% swing in the whole portfolio; at a 0.2 weight the same move is worth 6%. It is a plain arithmetic table, weight multiplied by move, that makes visible how much a single large position drives the total. What the sheet does is show the variance and the sensitivity; what to do about either is left entirely to you.
Prices are snapshots, not a live feed
It is worth returning to the design choice from the top, because it shapes how every number here should be read. There is no exchange connection and no live quote in this workbook. The Current Price column on Holdings is a manual entry, so the $71,098 portfolio value, the $12,364 gain, the 21.0% return, and the whole allocation picture are all as current as the last time you updated those price cells and no more.
Crypto valuations move, sometimes sharply and within a single day, so a snapshot taken this morning can read differently by evening. That is the nature of the asset, not the spreadsheet, and it is the reason the file leaves valuation in your hands rather than freezing a stale number or implying a precision it does not have. The practical rhythm is to update the price cells when you want a fresh reading, then let every derived figure recalculate at once. The trade a connected app makes is the opposite: data arrives on its own, at the cost of sending your holdings to a third-party service and taking its numbers as given. A spreadsheet suits holders who would rather type the snapshot themselves, read every formula, change any of them, and keep the file on their own machine.
ROI, cost basis, and unrealized gain in plain terms
Three terms carry most of the weight on the dashboard, and all three are simple divisions or subtractions of numbers the Holdings sheet already has.
Cost basis is what you paid, quantity times your average cost per unit, summed to $58,734 across the sample. It is the baseline every gain is measured from.
Unrealized P&L is market value minus cost basis, $71,097.50 less $58,734, or $12,363.50. Unrealized means on paper: the position has not been sold, so the gain is a mark, not cash in hand, and it moves every time a price does.
ROI, the return on cost basis, is unrealized P&L divided by cost basis, $12,363.50 ÷ $58,734, which rounds to 21.0%. It answers what the portfolio has returned against what went into it, as of the current price snapshot.
Because all three read from the same totals, they cannot drift apart, and because they are unrealized, none of them is a realized result until a coin is sold. That distinction is the one to keep in mind: the dashboard reports a position’s current standing, not a booked outcome.
Where the numbers land at tax time
For US holders, the Tax Lot Tracking sheet maps onto how digital assets are reported. The IRS treats digital assets as property, not currency, which is why a sale or disposal produces a capital gain or loss rather than ordinary income in most cases. Whether that gain is short-term or long-term turns on the holding period, and IRS Topic no. 409 sets the line at one year: hold more than a year and the gain is long-term, hold a year or less and it is short-term. The sheet’s Holding Period column applies that test at 365 days.
The workbook’s capital-gains block estimates only unrealized gains at illustrative rates, so it is a way to see the shape of a potential bill, not a filing number, and the sheet says as much. Arriving at year-end with lots dated and gains already separated by holding period turns the tax conversation into a review rather than a reconstruction, and a tax professional can confirm how a specific situation should be reported.
Excel or Google Sheets for a crypto portfolio tracker
The tracker is an .xlsx file built on plain formulas, SUMIF, COUNTIF, INDEX, MATCH, and simple arithmetic, with no macros and no add-ons, so it runs the same way in Microsoft Excel and in Google Sheets after upload. Google Sheets suits holders who want the file on any device and do not mind updating prices from a phone; Excel suits those who prefer a local file and a desktop. Neither version pulls live prices on its own here, so the manual-snapshot workflow is identical in both, and the structure described above is equally buildable by hand in either program.
Which tracker fits which holder
- Crypto Portfolio Tracker Ultimate Spreadsheet Template ($29) is the workbook this walkthrough follows: the Holdings engine, the Transaction Log, the DCA Tracker, Tax Lot Tracking, Allocation Analysis, and the six-tile dashboard, for up to fifty holdings. There is also a free Crypto Portfolio Tracker that is a single holdings sheet for a simpler start, and an Essentials version ($19) with a dashboard and holdings sheet between the two.
- Investment Portfolio Tracker Ultimate Spreadsheet Template ($29) is the sibling for holders whose portfolio is mostly stocks, funds, and ETFs rather than coins. It carries its own dashboard, holdings, allocation, performance, and dividend sheets, and it fits a traditional brokerage account better than the crypto-specific tags, lots, and staking rows here.
Related
- Crypto and Alternative Investments in Net Worth Tracking - how crypto fits into a broader net worth figure, the valuation-and-volatility angle rather than the per-coin one
- How to Track an Investment Portfolio in a Spreadsheet - the same one-holdings-sheet structure applied to stocks and funds
- Google Sheets vs Excel for Investment Tracking - how the two programs compare for this kind of workbook
Frequently asked questions
Does this spreadsheet pull live crypto prices automatically?
No. The workbook has no live feed and no exchange connection. The Current Price column on the Holdings sheet is a manual entry, so market value, unrealized P&L, ROI, and allocation all reflect whatever prices you last typed in. Updating one price cell recalculates every downstream number. That is the trade a spreadsheet makes: you enter the snapshot yourself, and in exchange the file stays on your own machine with every formula visible and editable.
What is the difference between the Holdings sheet and the Tax Lot Tracking sheet?
Holdings tracks each coin as a single blended position: one quantity, one average cost per unit, one current price. Tax Lot Tracking breaks the same coins into individual purchase lots, each with its own buy date and cost basis, so it can separate short-term from long-term holding periods. In the sample, BTC is one line on Holdings but three purchase lots on Tax Lot Tracking, bought in November 2024, March 2025, and June 2026.
How does the tracker decide short-term versus long-term?
The Tax Lot Tracking sheet compares each lot's purchase date with today's date. A holding period of one year or more is labeled long-term and anything under 365 days is short-term, matching the IRS one-year rule. Because it reads today's date, a lot's label can change on its own as it ages past the one-year mark, so the split updates without any editing.
Can one file track coins across several wallets and exchanges?
Yes. Each Holdings row has a Wallet / Exchange column, and the sample spreads its twelve coins across eight wallets and exchanges: Ledger, Phantom, MetaMask, Core, Polkadot, Coinbase, Binance, and Robinhood. The column is a label for your own reference; the totals and allocation add up across every wallet rather than per venue. The Transaction Log carries the same column so each buy, sell, or transfer records where it happened.
What do the category tags like L1, DeFi, and Stablecoin do?
Each holding carries a Category tag, and the Allocation Analysis sheet sums market value by tag to compare your actual mix against target percentages you set. In the sample, L1 coins sit at 88.6% of the portfolio against a 60% target, a variance the sheet calculates and colors. The Category column is a dropdown with six fixed options, L1, L2, DeFi, Stablecoin, Meme, and Other, and every one of them keeps a row so nothing you tag drops out of the totals. Nothing about the tag changes a coin's value, only how it rolls up.
Sources
- Digital assets - Internal Revenue Service
- Topic no. 409, Capital gains and losses - Internal Revenue Service
About this article
Sheets, columns, formulas, sample figures, and tier boundaries checked on 2026-09-10 against the published Crypto Portfolio Tracker Ultimate workbook (Dashboard, Holdings, Transaction Log, DCA Tracker, Tax Lot Tracking, Allocation Analysis, How to Use), together with the Free and Essentials Crypto Portfolio Tracker files and the Ultimate Investment Portfolio Tracker. Digital-asset property treatment and the one-year holding-period rule checked against the live IRS Digital Assets and Topic no. 409 pages at writing time. Last reviewed September 2026.