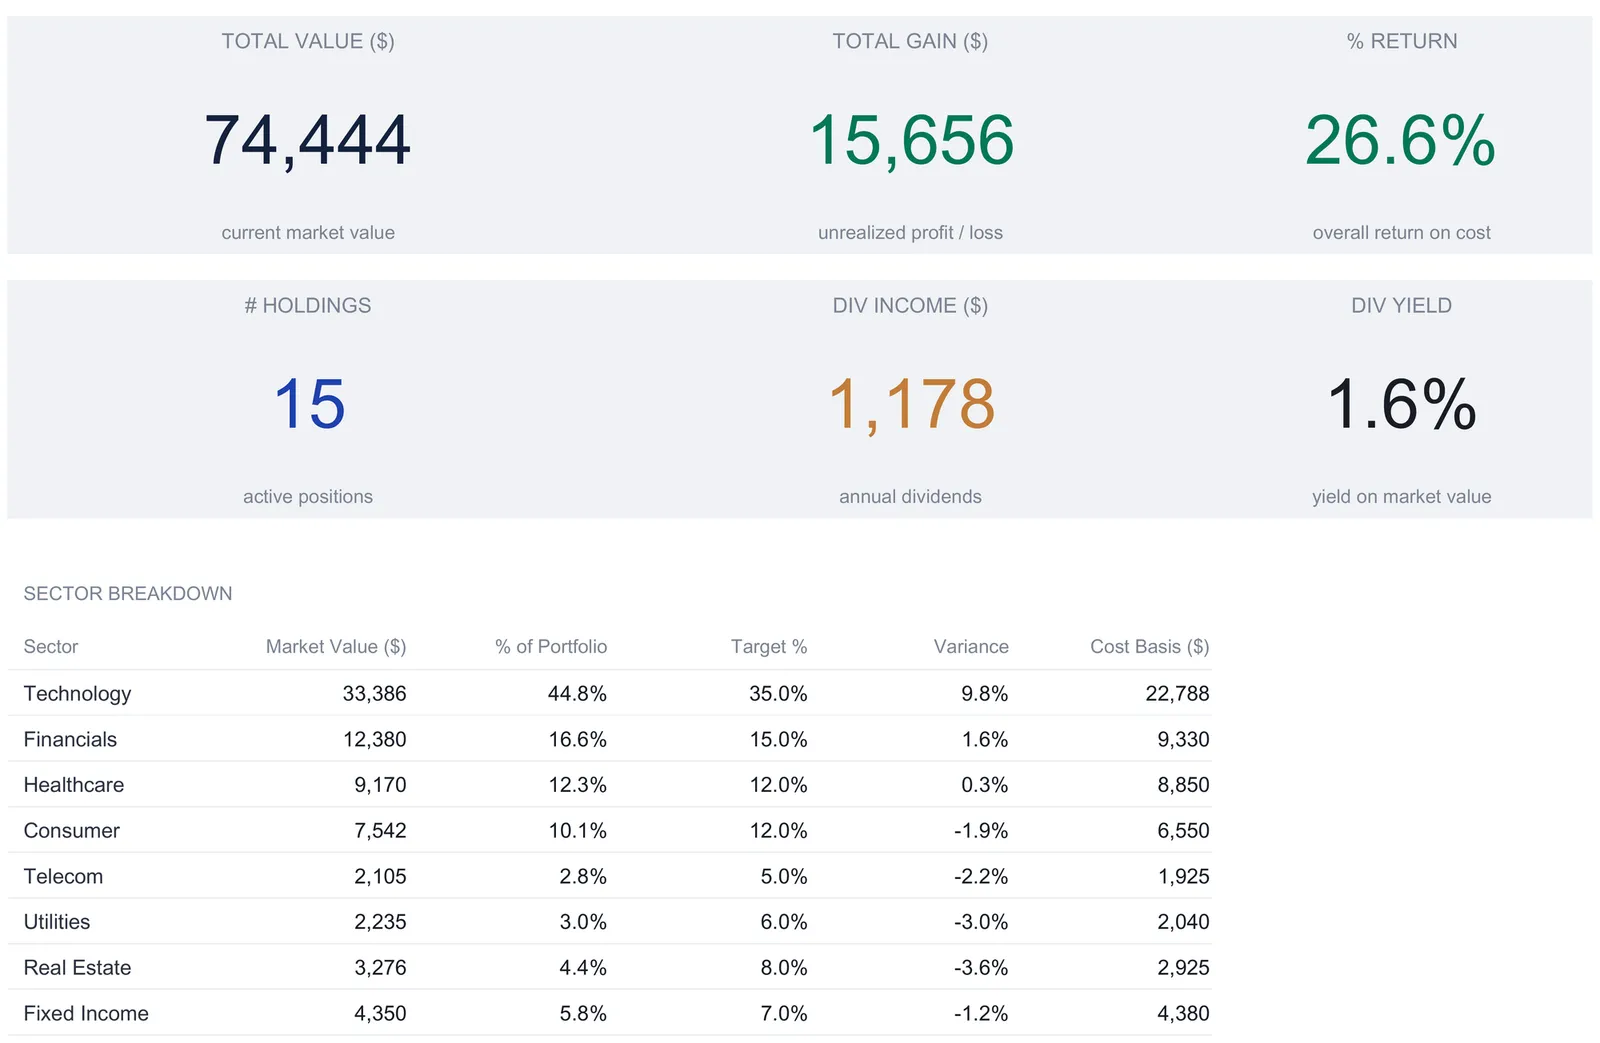
An investment portfolio tracker spreadsheet keeps every position in a single holdings sheet and derives everything else from it: market value, unrealized gain, percentage return, sector asset allocation against targets, year-over-year performance, and dividend income. This walkthrough follows the full structure using a worked example, a 15-stock portfolio worth $74,444 with $15,656 of unrealized gain, a 26.6% return on cost, and $1,178 in annual dividends. Our Investment Portfolio Tracker Ultimate ($29) ships the whole thing ready-made for Excel and Google Sheets.
A portfolio of a dozen or more stocks generates more questions than a brokerage app tends to answer on one screen. The app shows today’s total and today’s movers. It is far quieter on the questions that shape a portfolio over time: how much of the money sits in one sector, whether the mix has drifted from where it started, what the whole thing throws off in dividends across a year, and how the value compares to twelve and twenty-four months ago. Those answers are all latent in the same handful of numbers you already know for each holding, and a spreadsheet is well suited to pulling them out.
The structure comes down to one thing done well: a single holdings list, entered once, feeding every other view by formula. Get that right and the asset allocation, the year-over-year comparison, the dividend income, and a headline dashboard all fall out without a second round of typing. The examples below come from our Investment Portfolio Tracker Ultimate Spreadsheet Template ($29), which ships the whole thing ready-made for Excel and Google Sheets. The layout is reproducible by hand if you would rather build your own investment portfolio tracker spreadsheet from scratch.
The reason to prefer that structure over a page of standalone tiles is drift. When two summaries hold the same fact independently, the day one of them is updated and the other is not, they disagree, and a portfolio tracker that quietly disagrees with itself is worse than no tracker at all. Reading everything off one list removes the possibility: the allocation view, the dividend view, and the dashboard are not copies of the Holdings numbers, they are functions of them, so they move the instant the source does. That single idea is what the rest of this walkthrough is about, sheet by sheet.
What a portfolio tracker spreadsheet has to hold
Strip away the brokerage chrome and there are only a few kinds of data behind a portfolio:
- Per-holding records. Ticker, name, sector, shares, average cost, current price, and the annual dividend per share for each position. This is the raw material for everything else.
- Target allocation. One target percentage per sector, the mix you are aiming to hold.
- Prior-year values. The portfolio’s value by sector for the two years before this one, for the year-over-year comparison.
- Derived views. Market value, gain, return, actual allocation, variance, rebalancing distances, dividend income and yield, and the dashboard KPIs. These are calculations, not entries. In a well-built sheet, nothing here is ever typed.
The tracker gives each of these its own sheet: Holdings for the positions, Allocation for the targets and rebalancing, Performance for the year-over-year view, Dividends for the income view, and a Dashboard on top, with a How to Use sheet carrying the instructions. Only three of those sheets take any manual input at all: Holdings, Allocation, and Performance. The rest read the Holdings list.
Start with the positions: the Holdings sheet
The Holdings sheet is the only place a position is ever typed, and it is where every other number in the workbook begins. Each row is one holding, with seven input columns and five that calculate.
The columns you fill in are Ticker, Name, Sector, Shares, Avg Cost, and Current Price, plus the annual dividend per share (Ann. Div/Sh) over on the right. The other five are formulas:
- Market Value = shares times current price
- Gain / Loss = market value minus what the shares cost you (shares times average cost)
- % Return = gain divided by cost basis, so it measures the gain against what you paid, not against the current price
- % Portfolio = this position’s market value as a share of the whole
- Div Income = shares times the annual dividend per share
One row makes the flow concrete. The sample’s Apple position is 50 shares bought at a $142.50 average cost, currently priced at $189.25. Market value is 50 times $189.25, or $9,462.50. The shares cost 50 times $142.50, or $7,125, so the gain is $2,337.50, and the return is $2,337.50 over $7,125, which is 32.8 percent. With an annual dividend of $0.96 a share, the position throws off 50 times $0.96, or $48 a year. Every one of those figures is computed from the four numbers typed into the row.
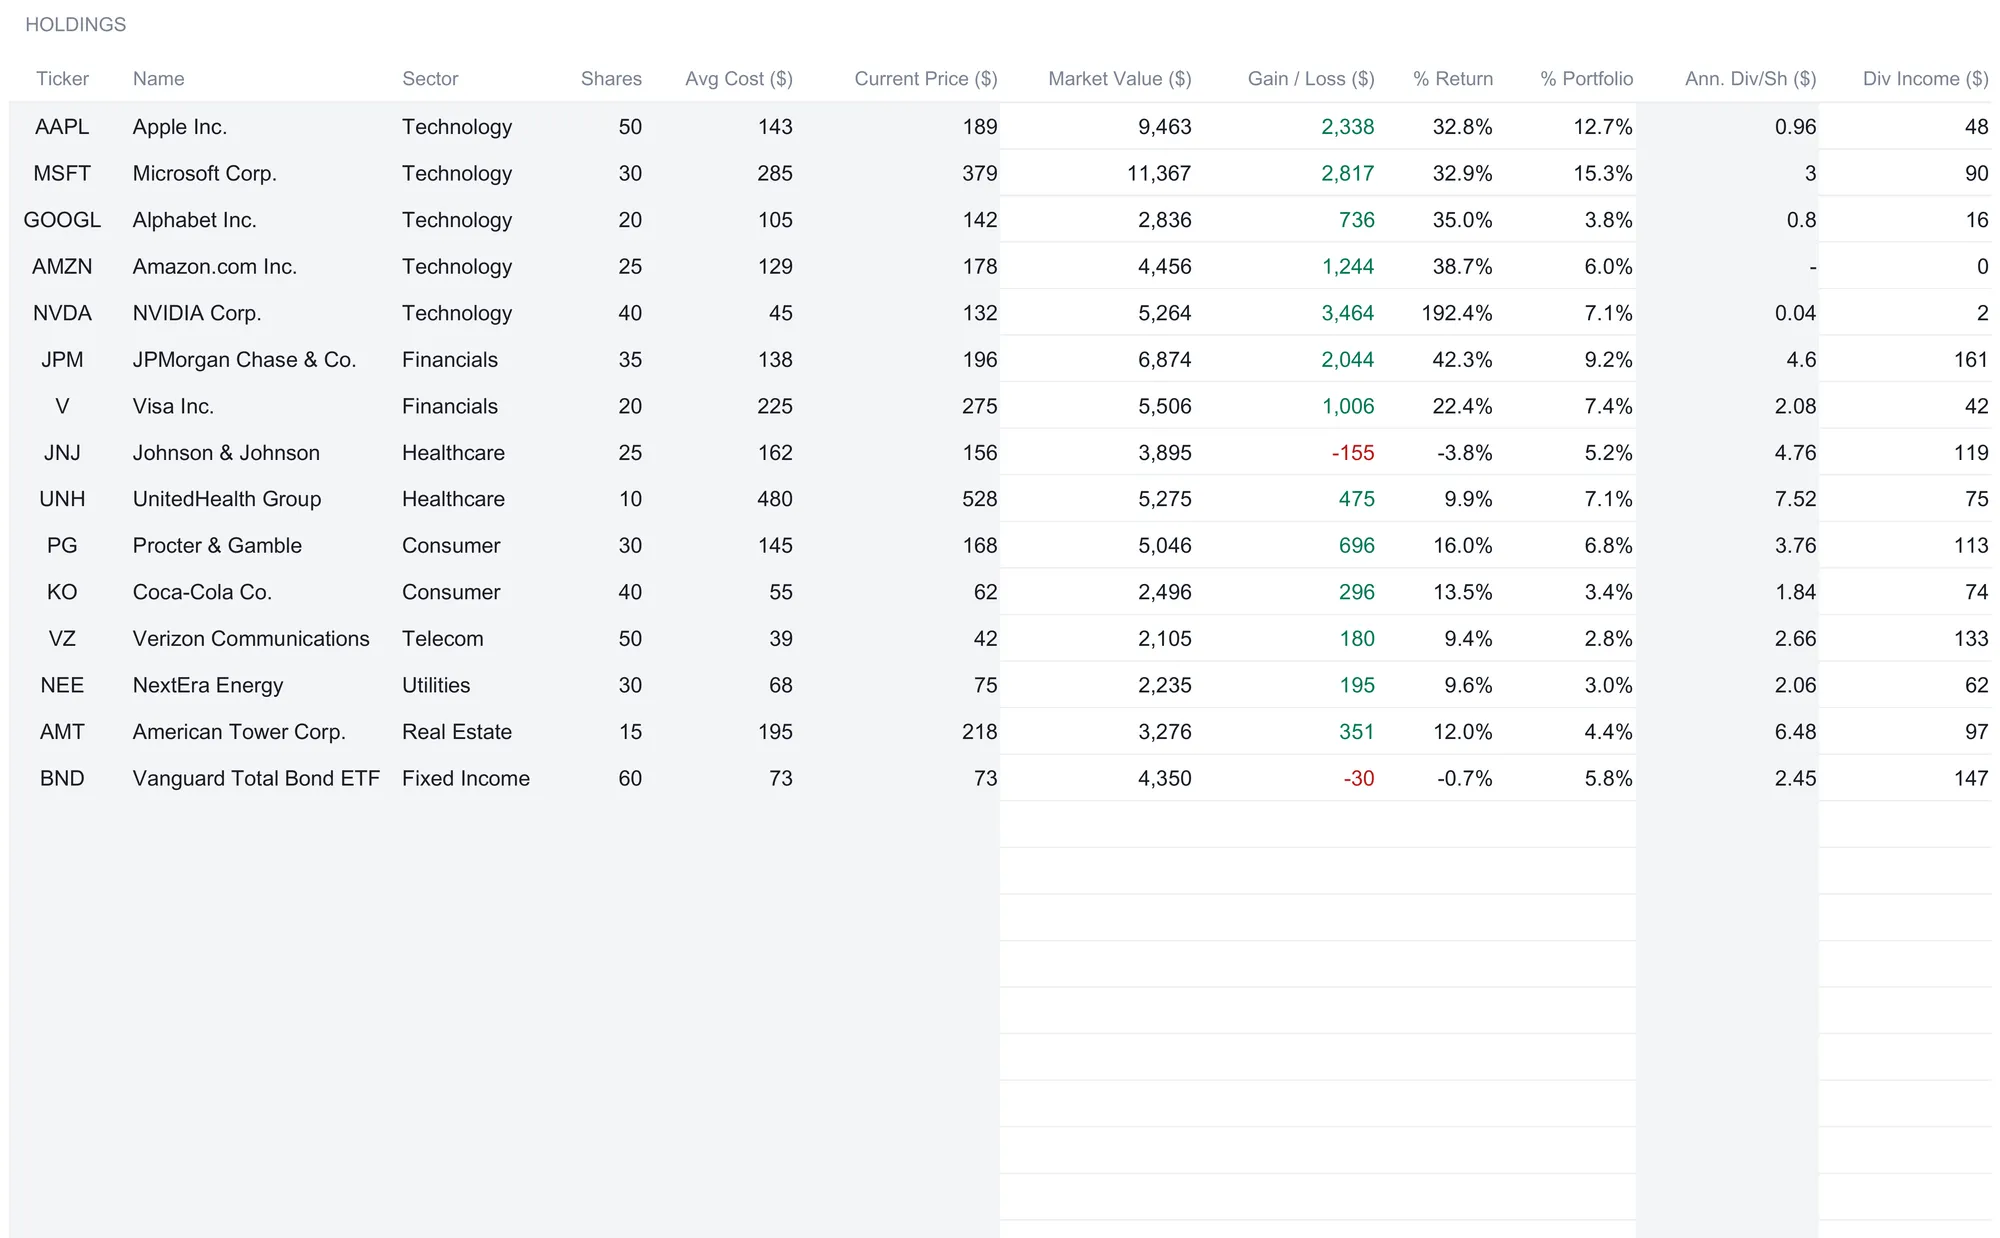
The full sample is 15 holdings, from large technology names to a total-bond ETF, and the spread of results is the point of laying them side by side. NVIDIA, bought at $45 and marked at $131.60, shows a 192.4 percent return on 40 shares. Johnson & Johnson sits slightly underwater at negative 3.8 percent, and the bond ETF is down 0.7 percent. Gains print green and losses print red, so the mix of winners and laggards reads at a glance rather than position by position. Add the 15 rows together and the portfolio totals $74,443.75 in market value against a $58,787.50 cost basis, for $15,656.25 of unrealized gain.
The % Portfolio column is easy to skim past but earns its place, because it is the first honest read on concentration. Microsoft alone is 15.3 percent of the sample portfolio and Apple another 12.7, so two positions carry better than a quarter of the money before the sector view has said a word. A brokerage app rarely surfaces that on the position list; the tracker makes it a standing column.
Two design details are worth copying into any hand-built version. First, the sheet supports up to 50 holdings and the formulas already run down all 50 rows, so a new position goes on the first free row and the whole workbook updates with nothing to drag. Second, Current Price is the one column worth revisiting, because every valuation on every sheet reads it. There is no live price feed here. A valuation is exactly as current as the last time you refreshed those prices by hand, which is the honest trade a spreadsheet makes against a connected app: total control and total transparency, in exchange for doing the updating yourself.
The file also leans on a simple color convention that is worth understanding before you start typing. Tinted cells are the ones you fill in, white cells hold formulas and update on their own, and green and red mark gains and losses on the Holdings and Performance sheets and on the dashboard’s gain and return tiles. The one place color is deliberately withheld is the distance from an allocation target, because sitting above or below a target you set yourself is not a win or a loss, and coloring it as one would misread what the number means.
Compare the mix to a plan: the Allocation sheet
The Allocation sheet answers a question the Holdings list only implies: how the portfolio is spread across sectors, and how that compares to the mix you were aiming for. It has two tables, and only one column on the whole sheet takes any input.
The top table, Target vs Actual Allocation, lists the eight sectors with three columns beside each. Target % is yours to set, the mix you want to hold. Actual % is computed, the sector’s market value as a share of the portfolio, worked out with a SUMIF across the Holdings data. Variance is simply the actual minus the target. In the sample, the target for Technology is 35 percent, but the sector has grown to 44.8 percent of the portfolio, a variance of plus 9.8 points. Consumer runs the other way, targeted at 12 percent but sitting at 10.1, a variance of negative 1.9. The target column adds to 100 percent, and so does the actual column, because anything outside the eight named sectors is swept into an Other row calculated as the remainder.
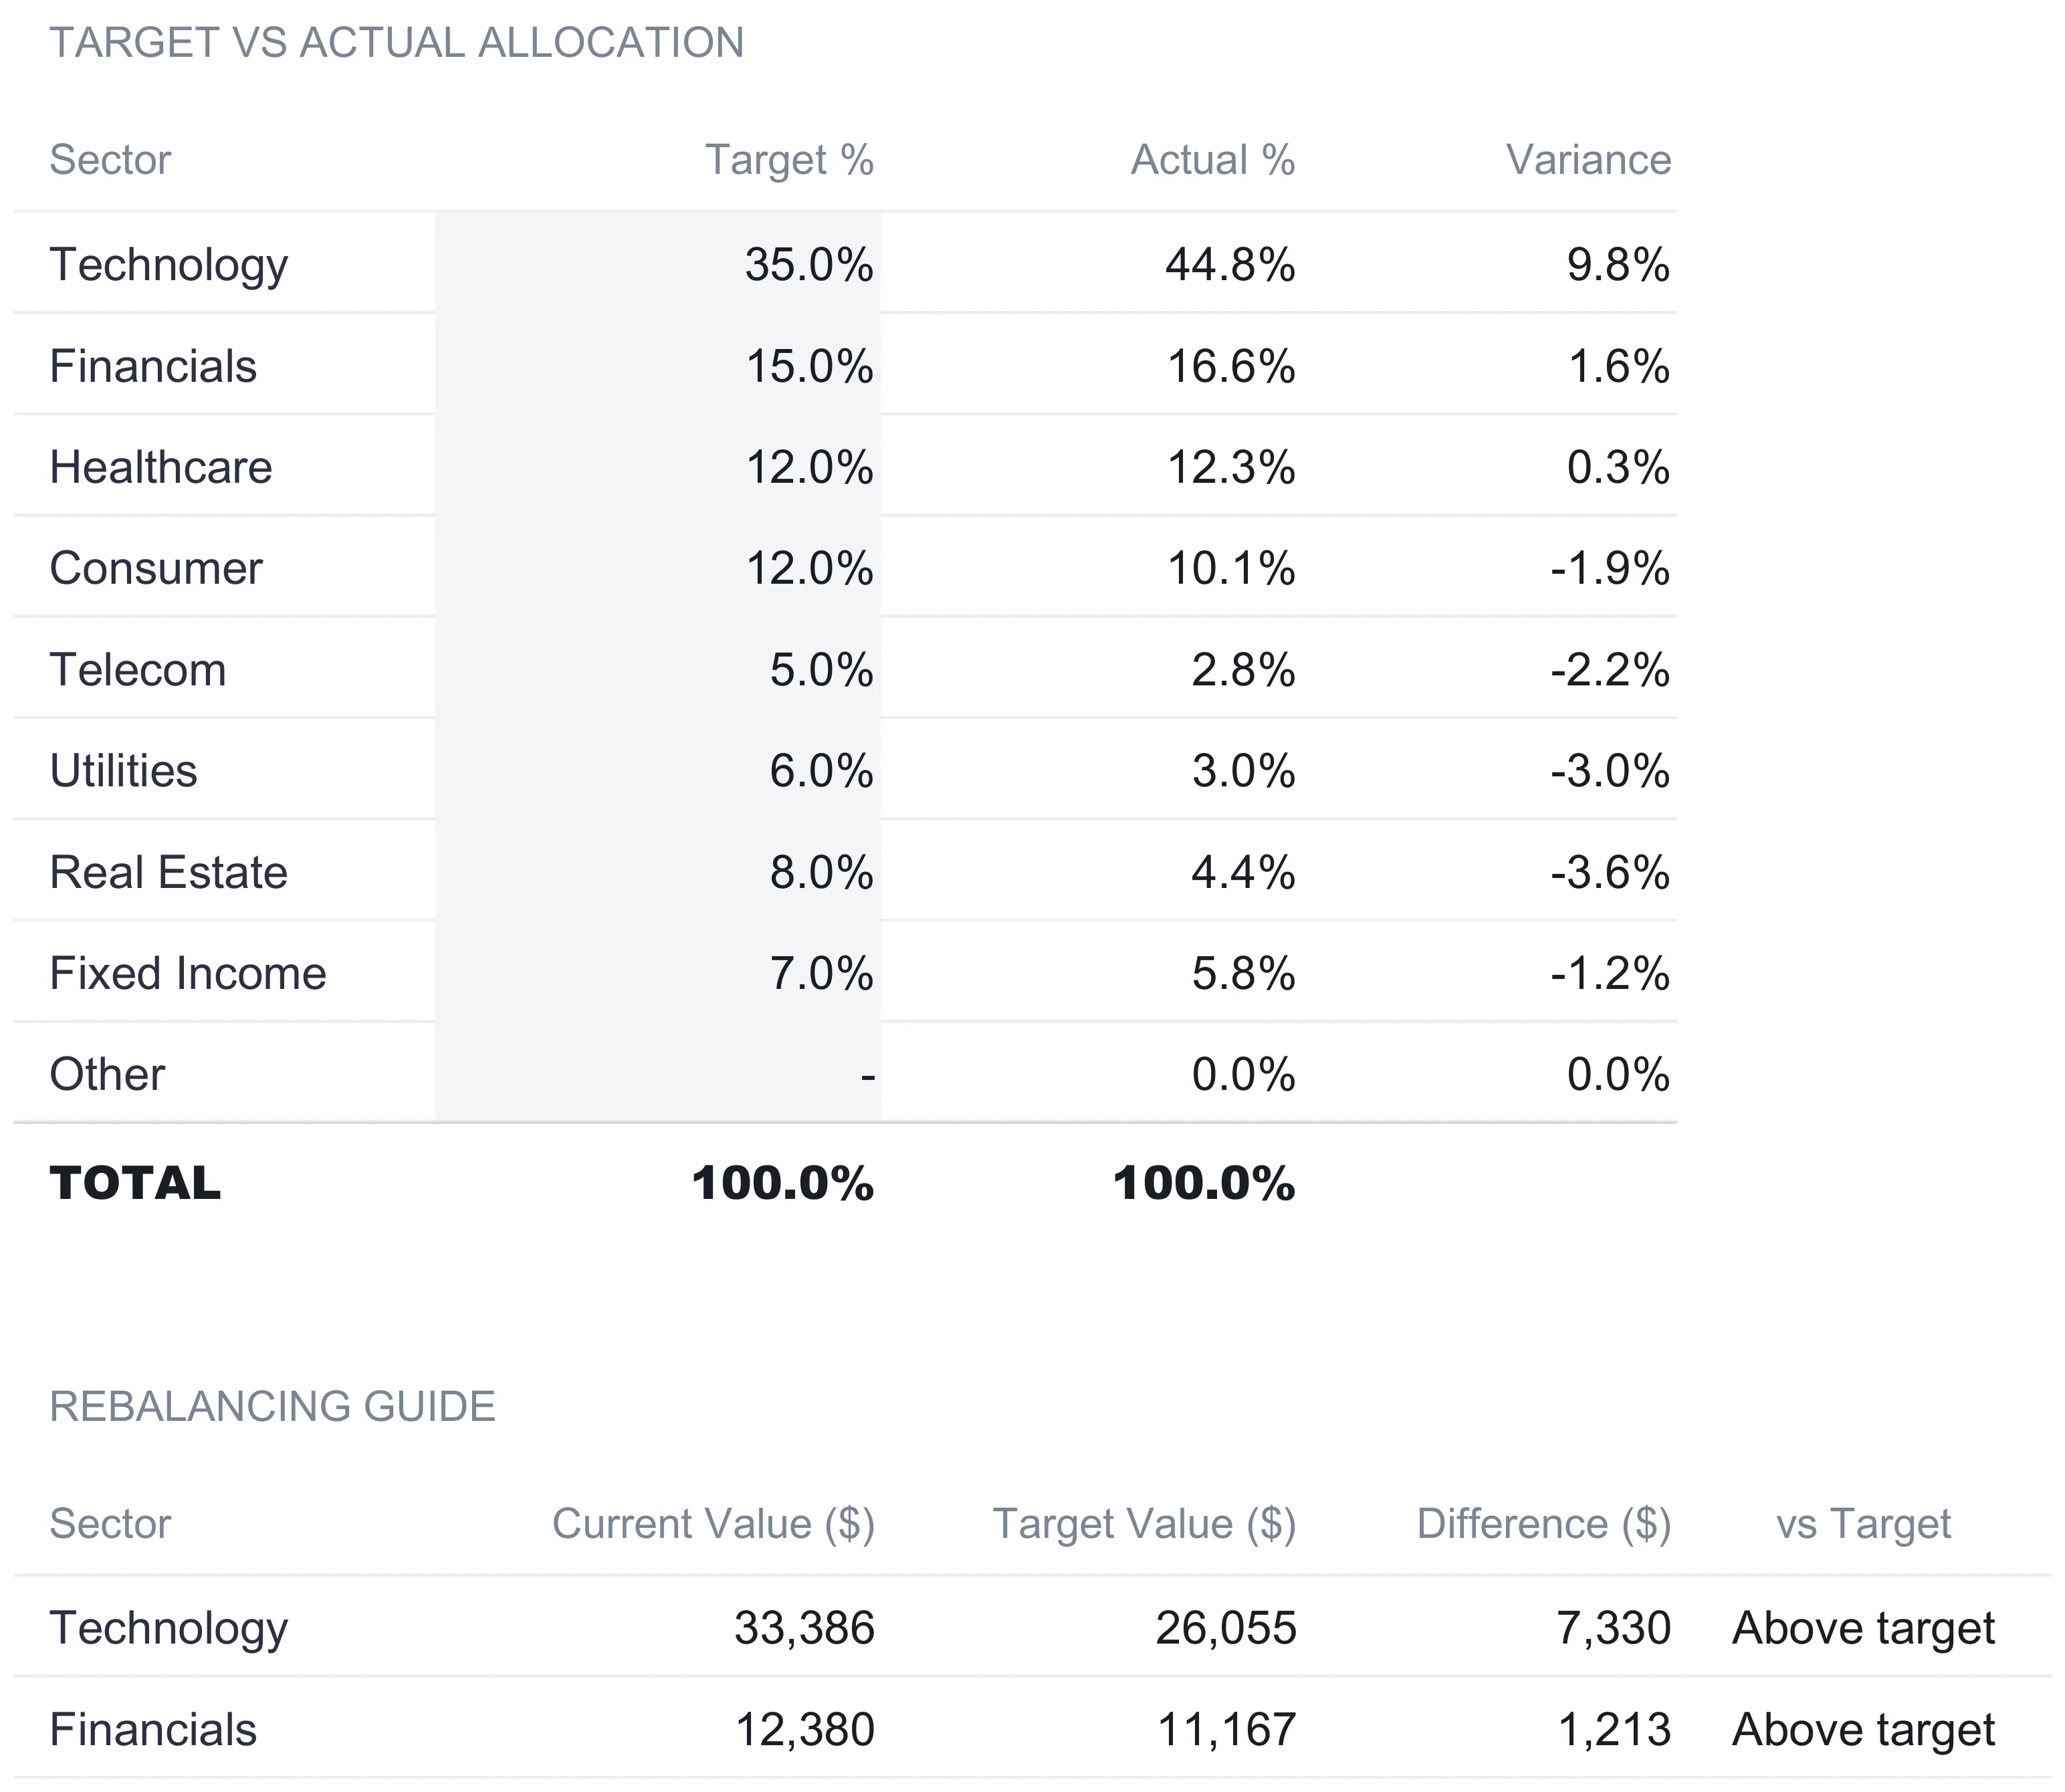
The second table, the Rebalancing Guide, restates the same gaps in dollars rather than percentages, which is the form the numbers take when you actually act on them. For each sector it shows the current value, a target value (the portfolio total times that sector’s target percentage), the difference between the two, and a plain label reading Above target, Below target, or On target. Technology’s current $33,386 against a $26,055 target value leaves it $7,330 above target; Consumer’s $7,542 against an $8,933 target sits $1,391 below. The sheet stops there, on purpose. As the built-in instructions put it, what to do about a gap is your call, and the sheet reports the numbers rather than suggesting trades.
That restraint is worth dwelling on, because asset allocation is where a tool can quietly overstep. The SEC’s investor education arm describes rebalancing as realigning holdings back toward your original targets when market moves shift the mix, and it frames the targets themselves as a function of your own time horizon and risk tolerance rather than a universal number. The spreadsheet respects that division of labour: it measures the drift precisely and leaves the decision, and the choice of targets, entirely with you.
Read the trajectory: the Performance sheet
Where the Allocation sheet is a snapshot, the Performance sheet is a trend. It compares the portfolio’s value by sector across three points in time, and it is one of the three sheets that ask for any typing.
The layout is a row per sector with five columns. Two Years Ago and Last Year are yours to enter, the portfolio’s value in each sector at those two past dates. The Current column is computed, reading the same SUMIF over the Holdings sheet that drives the allocation view, so there is nothing to type there. $ Change is the current value minus last year, and % Change expresses that as a percentage. In the sample, Technology has climbed from $20,699 two years ago to $26,709 last year to $33,386 now, a $6,677 or 25.0 percent move over the latest year. Real Estate is the one sector that slipped over the year, down $33 or 1.0 percent, and it prints red where the gainers print green.
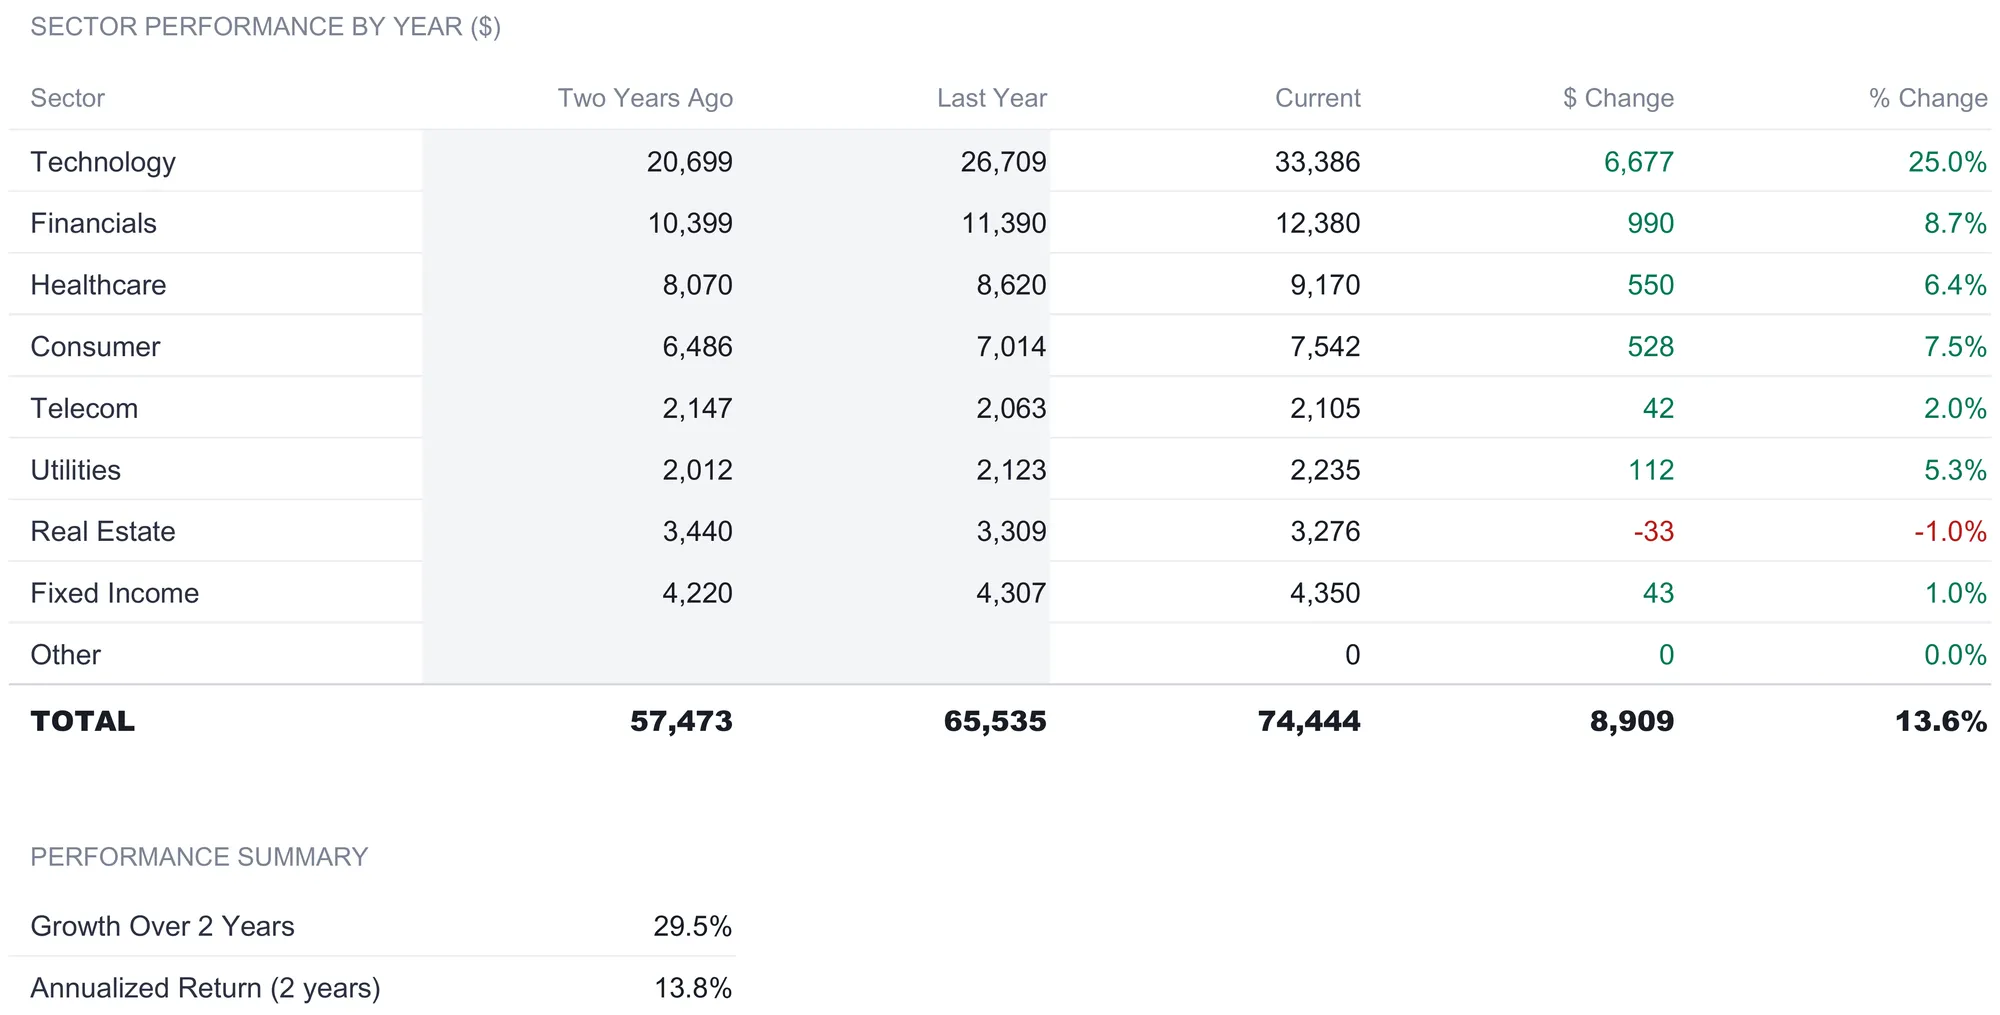
The TOTAL row adds the sectors for each year, tracing the whole portfolio from $57,473 two years ago to $65,535 last year to $74,444 now, an $8,909 or 13.6 percent gain over the latest year. Below the table, a short Performance Summary turns those endpoints into two rates. Growth Over 2 Years is the full change from the first column to the last, ($74,444 minus $57,473) over $57,473, which comes to 29.5 percent. Annualized Return (2 years) restates that as a per-year figure by taking the two-year growth ratio to the power of one-half and subtracting one, landing at 13.8 percent. The distinction matters: a portfolio that grew 29.5 percent in total across two years grew about 13.8 percent in a typical year, and quoting the cumulative figure as if it were annual would roughly double the apparent pace.
Total the income: the Dividends sheet
The Dividends sheet is the purest example of the one-list principle, because it takes no input at all. Every column pulls from the Holdings sheet and recomputes the same positions through an income lens.
Each row carries the ticker, name, and share count read straight from Holdings, the annual dividend per share, and then three derived figures. Annual Income is shares times dividend per share, the same product the Holdings sheet already shows, restated here as the anchor of the view. Yield is that income as a percentage of the position’s current market value, so it measures income against what the holding is worth today rather than against what you paid for it. % of Income shows how much of the whole portfolio’s dividend stream each holding provides.
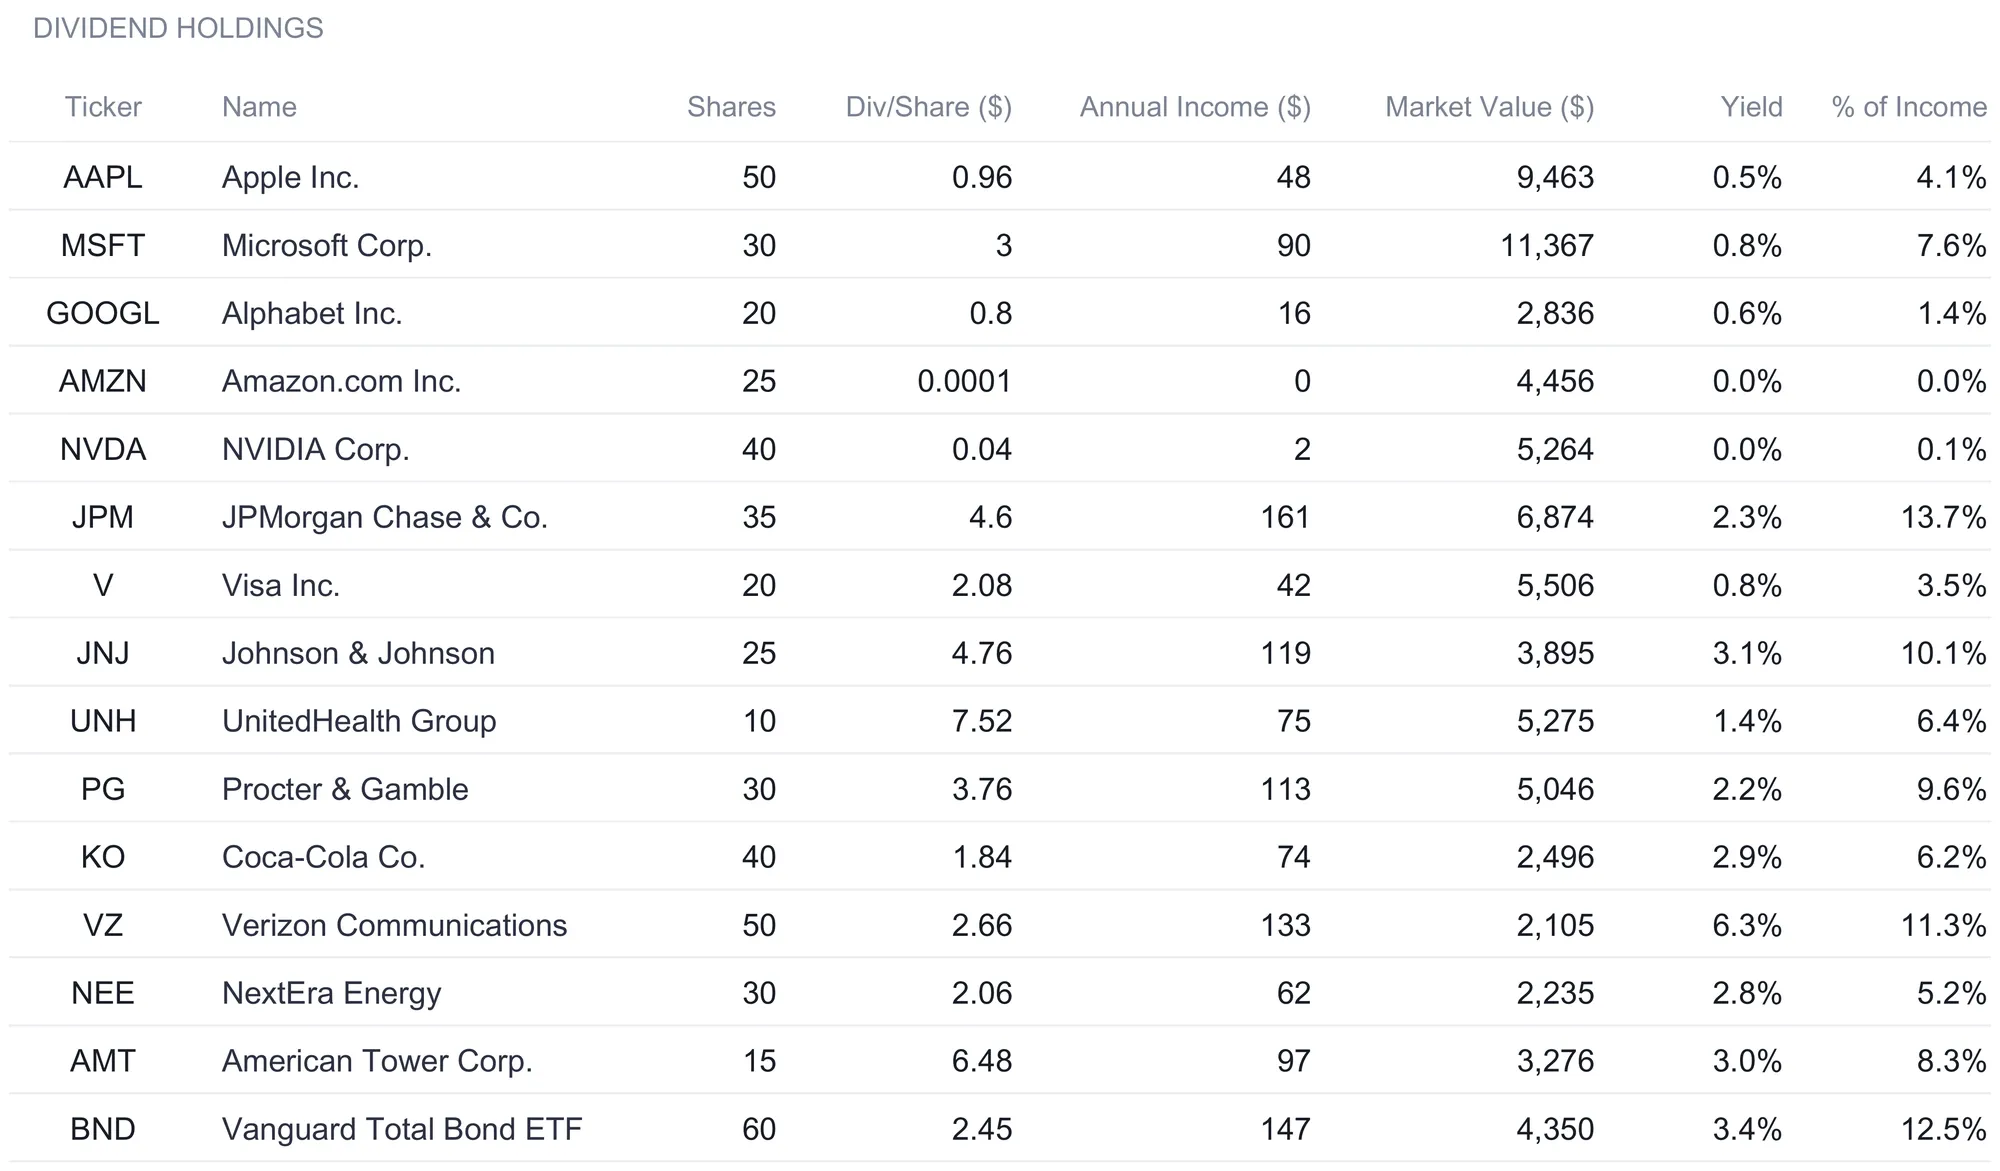
Reading the sample down the income column is a different exercise from reading it down the return column, and that is the value of the separate sheet. JPMorgan is the largest single source of dividends at $161 a year, 13.7 percent of the portfolio’s total income, even though it is far from the largest position by value. Verizon carries the highest yield at 6.3 percent, throwing off $133 on a $2,105 stake, while NVIDIA, the standout on the returns view, contributes almost nothing in dividends, $2 a year at effectively a zero percent yield. Amazon pays no dividend at all and sits at the bottom of the column. Summed across the 15 holdings, the portfolio produces $1,177.80 in annual dividends, and the totals row states the portfolio-wide yield, that income over the full market value, at 1.6 percent.
The % of Income column is the income-side twin of the Holdings sheet’s % Portfolio, and reading the two together is instructive. JPMorgan is 9.2 percent of the portfolio by value but 13.7 percent of its dividends, so it pulls more than its weight on the income line; NVIDIA is the mirror image, 7.1 percent of the value and a rounding error of the income. A concentration that looks one way on the value list can look entirely different on the income list, and keeping both columns means neither picture stands in for the other.
Kept as a column of its own, dividend income becomes something you can total, rank, and watch grow, rather than a footnote scattered across a brokerage’s individual position pages. For an investor who leans on that income, the portfolio-level figure is the one that matters.
The dashboard: six numbers and a sector map
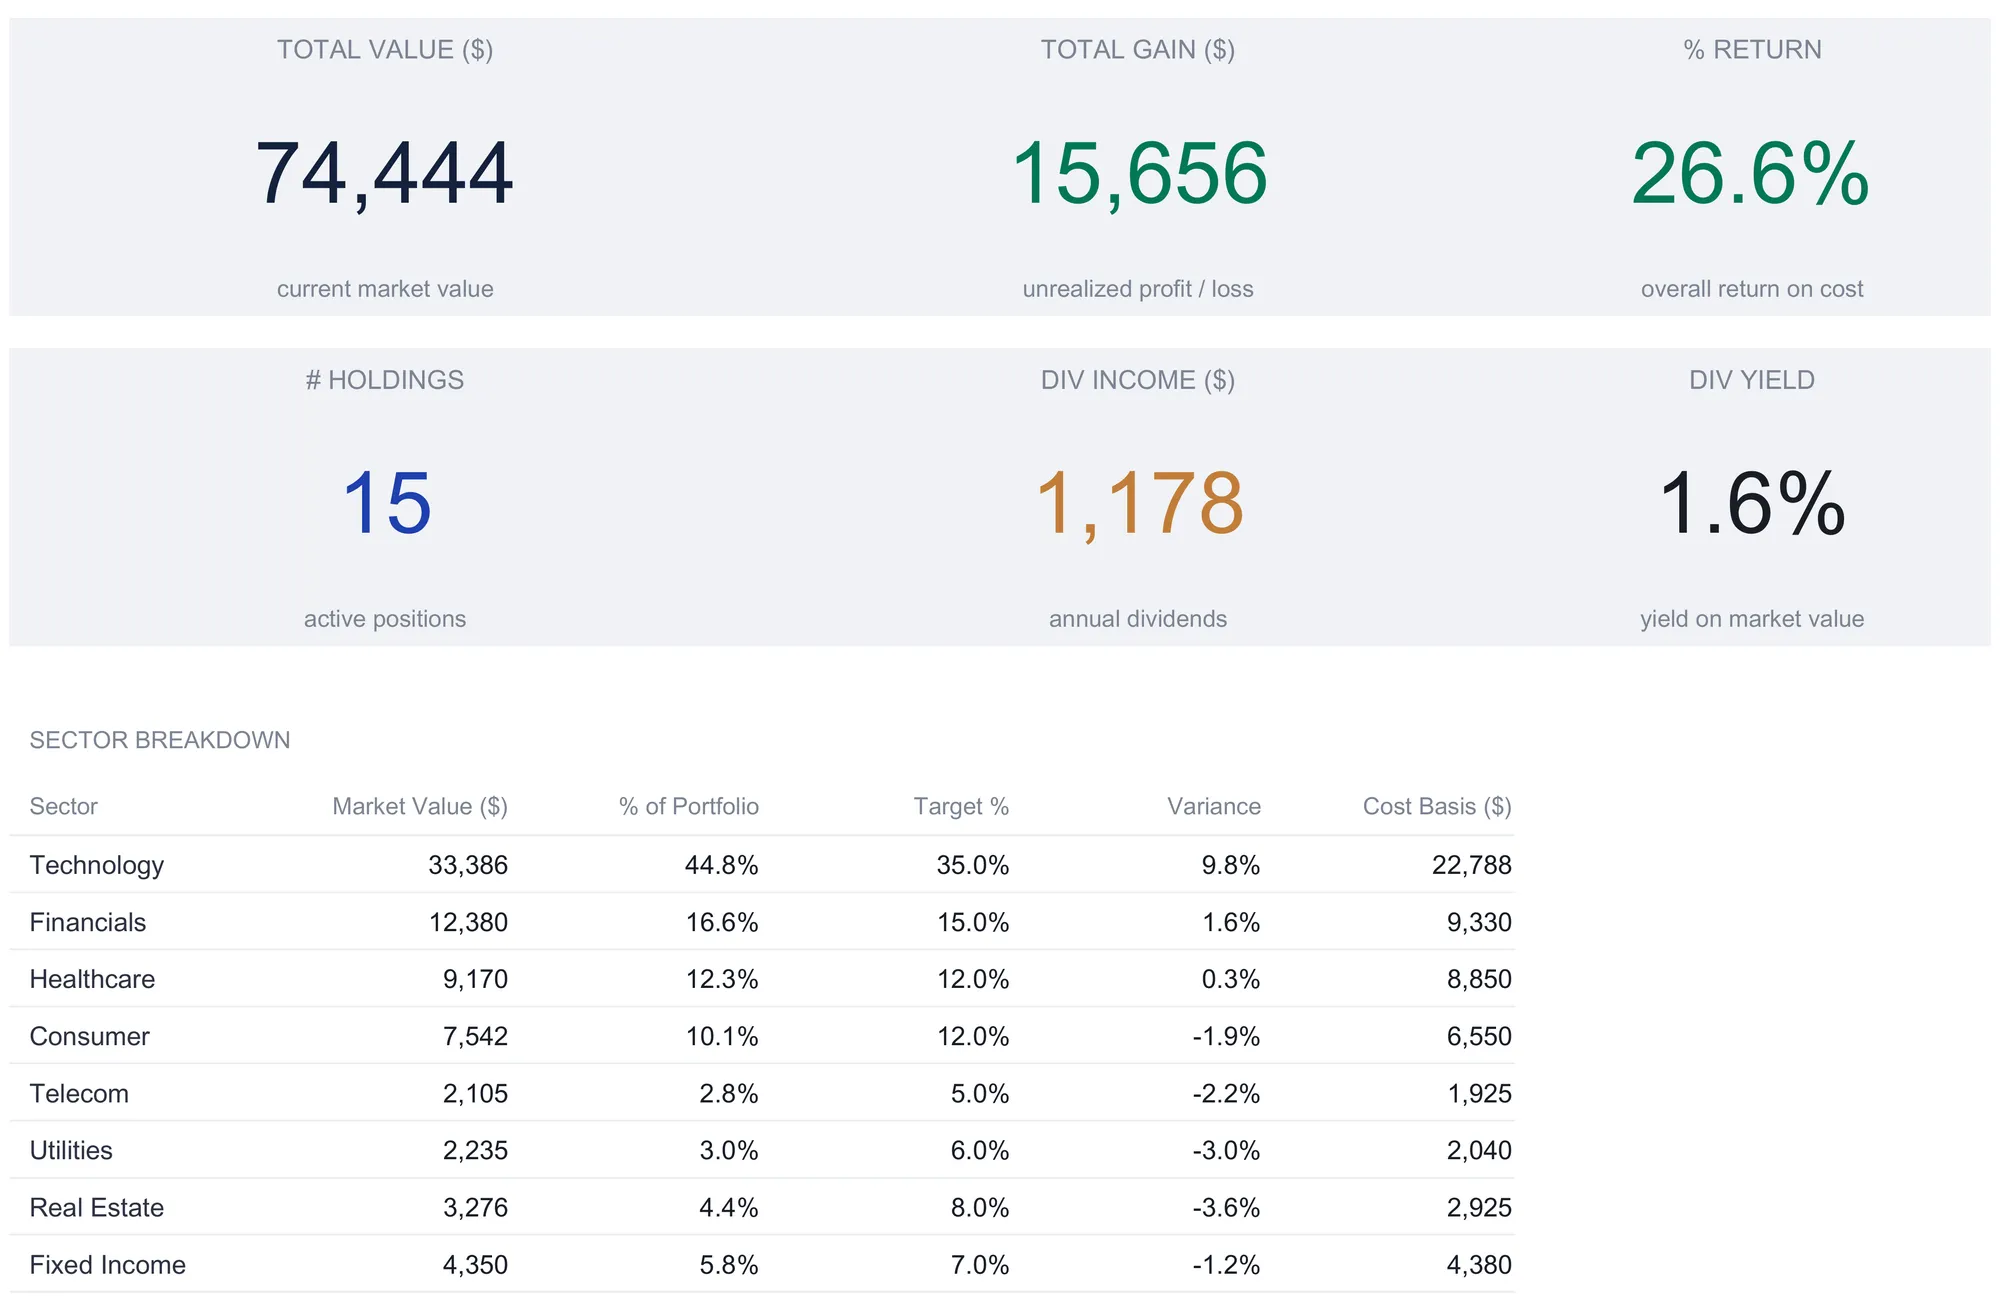
With the Holdings sheet filled and the targets set, the Dashboard states the whole portfolio in six tiles and a table. Nothing on it is typed.
| KPI | Sample value | What it reads |
|---|---|---|
| Total Value | $74,444 | Current market value of every holding |
| Total Gain | $15,656 | Unrealized profit or loss against cost |
| % Return | 26.6% | Overall gain over total cost basis |
| # Holdings | 15 | Rows that carry a ticker |
| Div Income | $1,178 | Annual dividends across the portfolio |
| Div Yield | 1.6% | Dividend income over market value |
The two return figures deserve a second look, because they measure the same money against different baselines. Total Gain, $15,656, is the raw dollars the portfolio is up. Percentage return, 26.6 percent, is that gain over the $58,787 cost basis rather than over the current value, so it answers “how much has this grown relative to what I put in?” The dividend tiles sit beside them as a reminder that a portfolio returns in two currencies, price appreciation and income, and the dashboard keeps both on the same screen.
Below the tiles, a Sector Breakdown table lays out all eight sectors at once with market value, percent of portfolio, target, variance, and cost basis side by side, and a pie chart reads that table directly, so renaming a sector in the table renames the matching slice. The cost basis column is the one figure the allocation sheet does not repeat, and it earns its spot: setting Technology’s $33,386 of current value against its $22,788 cost basis shows how much of that sector’s weight is money you put in versus gains that have accrued on top. This is the dashboard version of the allocation analysis, condensed so the drift toward Technology and away from the smaller sectors is visible without leaving the front page. Because every figure traces back to the Holdings sheet, the dashboard and the detail sheets cannot disagree; the front page is a summary of the same numbers, never a separate copy that could fall out of step.
Asset allocation and yield in plain terms
A few of the tracker’s numbers carry more jargon than meaning, so it is worth restating them in plain language, because each is a simple division of figures the Holdings sheet already holds.
Actual allocation (Technology’s $33,386 over the $74,444 total, or 44.8 percent) is just how much of the portfolio a sector represents right now.
Variance (44.8 percent actual minus a 35 percent target, or plus 9.8 points) is the distance between where a sector sits and where you aimed it.
Dividend yield (the portfolio’s $1,178 over its $74,444 value, or 1.6 percent) is income as a percentage of current worth.
Percentage return ($15,656 of gain over the $58,787 cost basis, or 26.6 percent) is growth measured against what you paid.
The one distinction the whole workbook hinges on is which denominator a ratio uses. Percentage return divides by cost basis, because the question is how far a position has moved from your purchase price. Dividend yield divides by market value, because the question is what the holding earns relative to what it is worth today.
Where dividends land at tax time
For US investors, the dividend income the tracker totals also carries a tax character. Dividends are classified as either ordinary or qualified, and the two are taxed differently. Ordinary dividends are included in ordinary income, while qualified dividends can be taxed at lower capital-gain rates, and the payer identifies which is which on the Form 1099-DIV you receive. The spreadsheet does not make that distinction, and it does not need to: it totals the income so you arrive at tax time with the annual figure already in hand, and IRS Topic no. 404 covers how dividends and other corporate distributions are reported. A tax professional can confirm how a specific holding is treated.
Excel or Google Sheets for a portfolio tracker
The tracker is an .xlsx file built entirely on plain formulas, with no macros and no add-ons, so it runs identically in Microsoft Excel, in Google Sheets after upload, and in LibreOffice Calc. Google Sheets suits an investor who wants the file on any device and does not mind refreshing prices in a browser; Excel suits one who prefers a local copy and a desktop. A currency selector on the Dashboard relabels every money column and KPI across the workbook from a list of symbols, though it relabels only and does not convert the underlying numbers. The structure described here is equally buildable in either program, and the same one-list discipline is what keeps it honest wherever it runs.
Which tracker fits which investor
- Investment Portfolio Tracker Ultimate Spreadsheet Template ($29) is the workbook this walkthrough follows: the holdings list, the target-versus-actual allocation and rebalancing guide, the year-over-year performance view, the dividend income sheet, and the six-tile dashboard, for up to 50 holdings.
- The free Investment Portfolio Tracker is a single-sheet start for anyone who just wants to list positions and see the totals, with no allocation or dividend views yet, and the Investment Portfolio Tracker Essentials ($19) adds a holdings sheet feeding a value and return dashboard between the two.
- Dividend Tracker Ultimate Spreadsheet Template ($29) goes deeper on the income side than the portfolio tracker’s single dividend sheet, with dividend history, monthly income projections, yield-on-cost analysis, and a DRIP calculator, for an investor whose focus is the dividend stream itself rather than the whole allocation picture.
Related
- Investment Portfolio Tracker (Excel, With Dividend Log and ROI) - the general guide to the three-part structure and the ROI and XIRR formulas behind it
- Bond vs Dividend Stock Spreadsheet - comparing two income approaches side by side in a sheet
- How to Track Net Worth in a Spreadsheet - the same one-list discipline applied to the whole balance sheet, with your portfolio as one line on it
Frequently asked questions
Does the spreadsheet pull live stock prices automatically?
No. Current Price is a manual column on the Holdings sheet, and it is the one figure worth revisiting, because every valuation across every sheet reads it. There is no market data feed and no broker connection, so a valuation is only as current as the last time you updated the prices. That is the trade against a connected app: the spreadsheet stays entirely on your machine with formulas you can read and change, but nobody refreshes the numbers except you.
What is the difference between percentage return and dividend yield in this tracker?
They divide different things. Percentage return on the Holdings sheet is unrealized gain over what a position cost you, so it measures price appreciation against your purchase price. Dividend yield on the Dividends sheet is annual dividend income as a percentage of current market value, so it measures income against what the position is worth today. A holding can show a large percentage return and a tiny yield, or the reverse, because the two answer different questions.
How many holdings can the portfolio tracker hold?
Up to 50 positions out of the box. The sample file fills 15 rows, and the formulas already run down all 50, so the next holding goes on the first free row and every sheet updates without dragging a formula or extending a range. The dashboard's active-positions count reflects how many rows actually carry a ticker.
What happens if I enter a sector the template does not list?
The sector views recognize eight names: Technology, Financials, Healthcare, Consumer, Telecom, Utilities, Real Estate, and Fixed Income. Anything outside that list, whether a ninth sector, a typo, or a blank, lands in the Other row. Other is worked out as the portfolio total minus the eight named sectors, so the breakdown always adds up to your whole portfolio and the percentages always reach 100 percent.
How are dividends from a portfolio taxed?
In the US, dividends are classified as either ordinary or qualified, and the two are taxed differently: ordinary dividends are included in ordinary income, while qualified dividends can be taxed at lower capital-gain rates. The payer identifies which is which on the Form 1099-DIV you receive. IRS Topic no. 404 covers dividends and other corporate distributions, and a tax professional can confirm how a specific holding is treated.
Sources
- Topic no. 404, Dividends and other corporate distributions - Internal Revenue Service
- Asset Allocation and Diversification - U.S. Securities and Exchange Commission (Investor.gov)
About this article
Sheets, input cells, formulas and sample figures checked on 2026-09-10 against the shipped Investment Portfolio Tracker Ultimate workbook (Dashboard, Holdings, Performance, Dividends, Allocation and How to Use sheets), the file customers download. IRS Topic no. 404 and the Investor.gov asset allocation page checked against the live sources at writing time. Last reviewed September 2026.