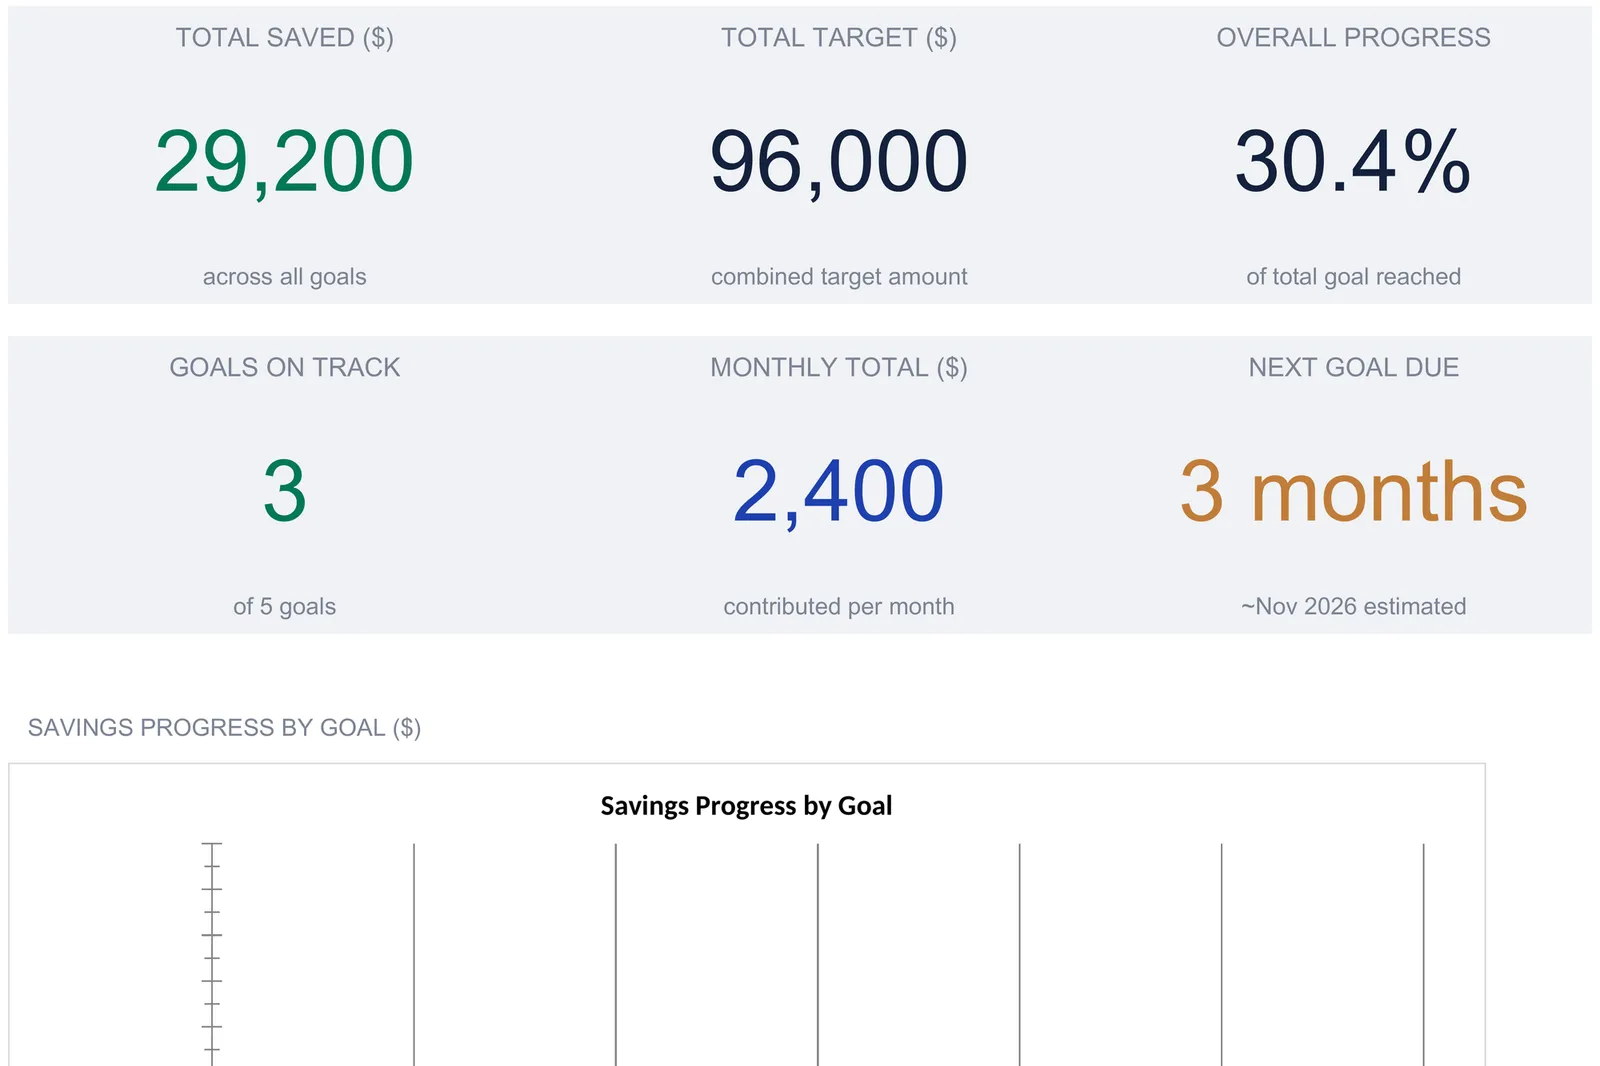
A savings goal tracker spreadsheet keeps every goal on a single setup sheet and derives everything else from it: percent complete, months remaining at your contribution, a per-goal progress view, a what-if grid, a year-over-year comparison, and a KPI dashboard. This walkthrough follows the full structure using a worked example, five goals totaling a $96,000 target with $29,200 saved, 30.4% overall progress, and three goals on track. Our Savings Goal Tracker Ultimate ($29) ships the whole thing ready-made for Excel and Google Sheets.
Most people can name their savings goals without thinking. A house down payment, a wedding, a replacement car, a trip, a cushion for emergencies. What is much harder to answer off the top of your head is which of those is on schedule, which has quietly fallen behind, and how a single bank balance splits across all of them. A savings account shows one number. The plan behind it lives in the gap between that number and the several targets it is meant to reach, and a spreadsheet is well suited to holding that gap open where you can read it.
The structure comes down to one thing done well: a single goals list, entered once, feeding every other view by formula. Get that right and the percent complete, the months remaining, the per-goal progress table, the what-if projections, and a headline dashboard all fall out without a second round of typing. The examples below come from our Savings Goal Tracker Ultimate Spreadsheet Template ($29), which ships the whole thing ready-made for Excel and Google Sheets. The layout is reproducible by hand if you would rather build your own savings goal tracker spreadsheet from scratch.
The reason to prefer that structure over a page of standalone tables is drift. When two summaries hold the same fact independently, the day one is updated and the other is not, they disagree, and a goal tracker that quietly disagrees with itself is worse than none. Reading everything off one list removes the possibility: the progress view, the what-if sheet, and the dashboard are not copies of the goals numbers, they are functions of them, so they move the instant the source does. That single idea is what the rest of this walkthrough is about, sheet by sheet.
What a savings goal tracker spreadsheet has to hold
Strip away the banking app and there are only a few kinds of data behind a savings plan:
- Per-goal records. A name, a target amount, the current balance, a planned monthly contribution, a priority label, and a target date for each goal. This is the raw material for everything else.
- Actual deposits. What you genuinely paid into each goal, month by month, which is not always the same as the plan.
- Prior-year balances. Where each goal stood at the end of the last couple of years, for the year-over-year comparison.
- Derived views. Percent complete, months remaining, remaining amount, the what-if projections, the growth percentages, and the dashboard KPIs. These are calculations, not entries. In a well-built sheet, nothing here is ever typed.
The tracker gives each of these its own sheet: Goals Setup for the goals, Monthly Contributions for the deposit log, Progress Dashboard for the per-goal view, What-If Scenarios for the projections, Year-over-Year for the trajectory, and a Dashboard on top, with a How to Use sheet carrying the instructions. Three of those sheets hold the raw entries, Goals Setup, Monthly Contributions and Year-over-Year, and What-If Scenarios takes a goal name plus its own contribution and rate ladders. The Progress Dashboard and the Dashboard take nothing at all, because every cell on them reads the goals list.
Start with the goals: the Goals Setup sheet
The Goals Setup sheet is the only place a goal is ever defined, and it is where every other number in the workbook begins. Each row is one goal, with six columns you fill in and three that calculate.
The columns you type are Goal Name, Target Amount, Current Saved, Monthly Contribution, Priority, and Target Date. Everything to the right of them is a formula:
- Status reads the goal against its date and reports Complete, On Track, Behind, or In Progress
- % Complete = current saved divided by target
- Months Remaining = the target minus the current balance, divided by the monthly contribution, rounded up to a whole month
One row makes the flow concrete. The sample’s Emergency Fund has a $15,000 target with $9,000 saved, so it is 9,000 over 15,000, or 60 percent complete. The remaining $6,000 divided by the $500 monthly contribution rounds up to 12 months. Because the Target Date is December 2027 and twelve months comfortably fits before then, the Status reads On Track. Every one of those three figures is computed from the numbers typed into the row.
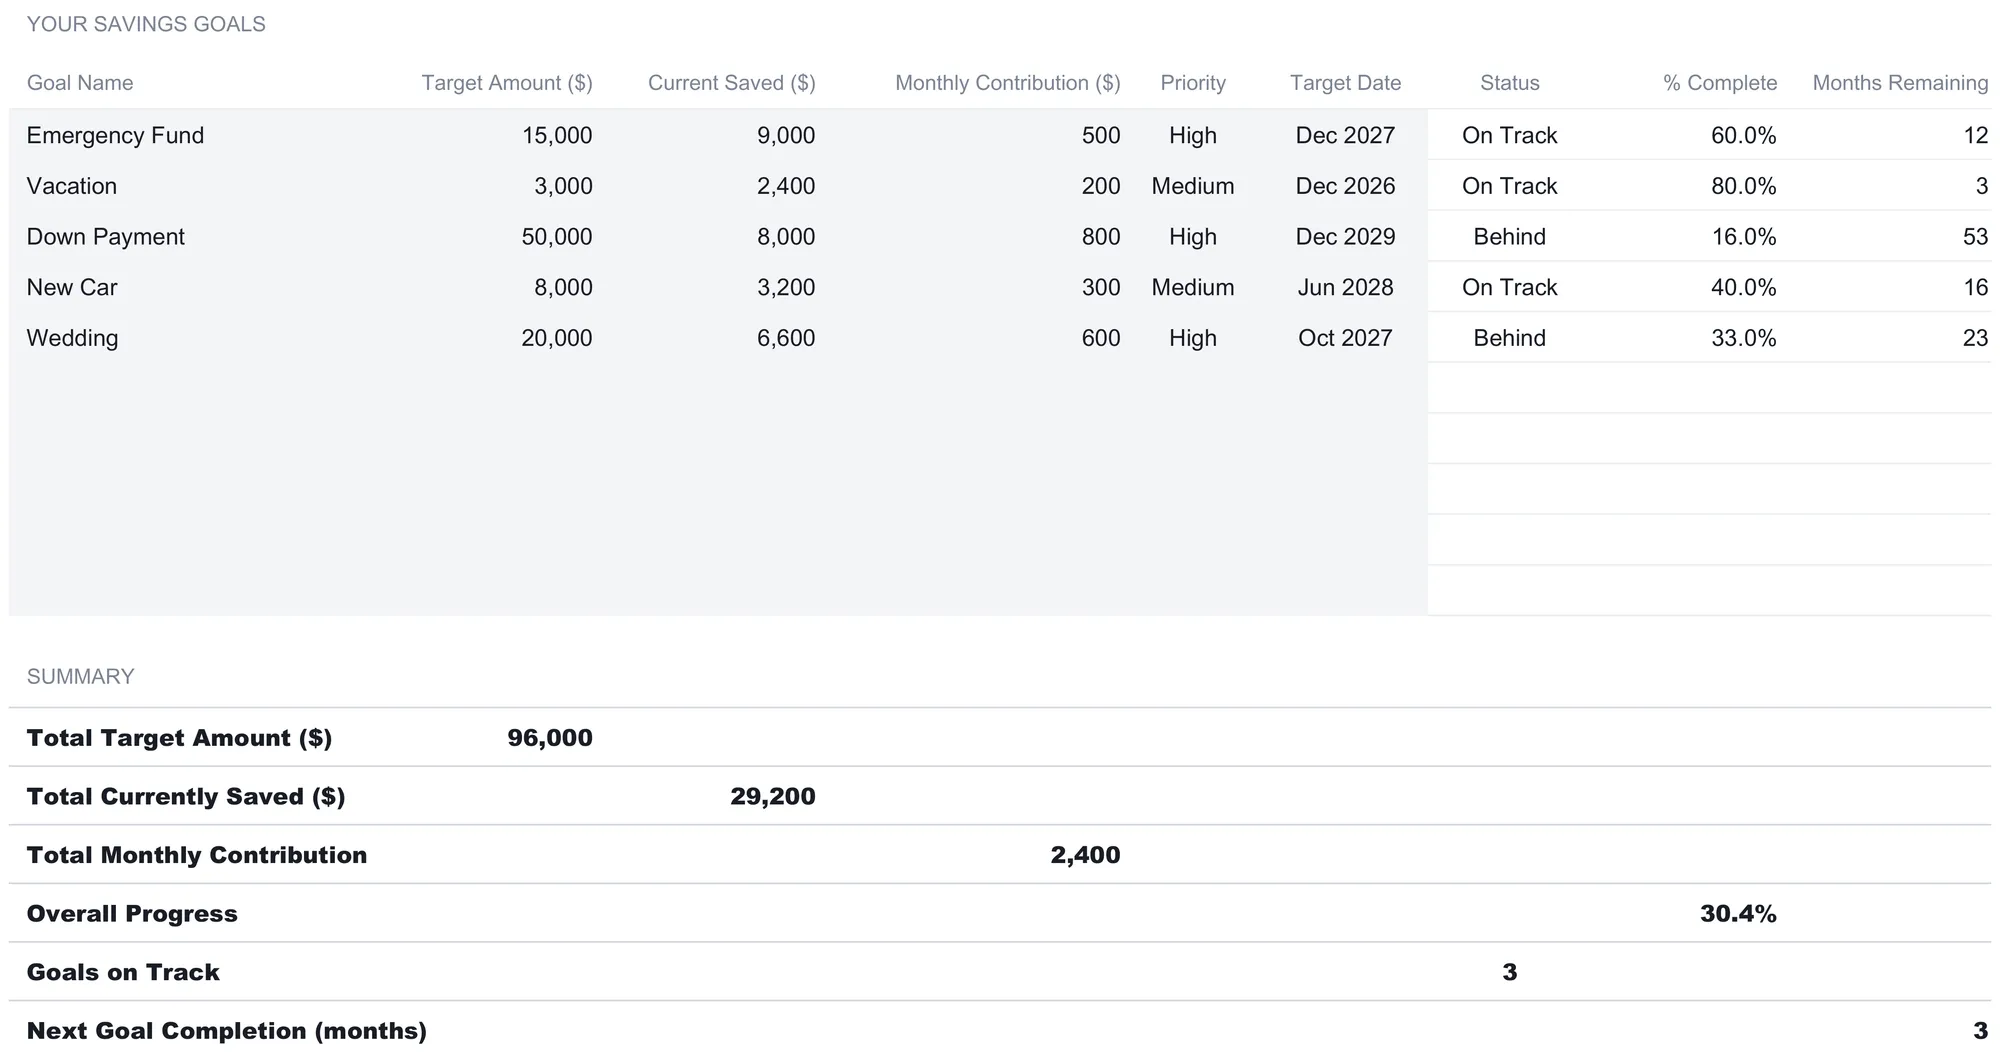
The full sample is five goals, and the spread of results is the point of laying them side by side. The Down Payment aims at $50,000 with $8,000 saved, so it is 16 percent complete and needs 53 months at its $800 contribution, which lands past its December 2029 date and prints Behind. The Vacation is 80 percent complete with three months to go and reads On Track. The Wedding, at 33 percent complete and 23 months out against an October 2027 date, reads Behind. Add the Emergency Fund and the New Car and three goals sit On Track, two Behind, and the numbers, not an opinion, decide which is which.
Two design details are worth copying into any hand-built version. First, the sheet supports up to 10 goals and the formulas already run down all ten rows, so a new goal goes on the first free row and the whole workbook updates with nothing to drag. Second, the Priority column, High, Medium, or Low, records your own ranking and nothing more. Nothing on the sheet sorts, counts, or weights goals by it, so it is a note to yourself rather than an input the math reads.
Below the goal rows, a summary block totals the plan. The five targets add to a $96,000 combined target, the balances to $29,200 currently saved, and the contributions to $2,400 a month. Overall Progress is the $29,200 saved over the $96,000 target, which is 30.4 percent. Goals on Track counts the Complete and On Track rows, which is three, and Next Goal Completion reports the soonest finish among the outstanding goals, three months, the Vacation. Each of those is a plain sum or ratio of the rows above it, which is what lets the same figures reappear untouched on the dashboard.
A note on color before you start typing. The file uses one convention throughout: tinted cells are the ones you fill in, and white cells hold formulas that update on their own. Status text is the one place color carries meaning, green for Complete or On Track and amber for Behind or an In Progress goal with no date to judge against, so the state of each goal reads at a glance rather than row by row.
Log what you actually paid: the Monthly Contributions sheet
The Goals Setup contribution is a plan. The Monthly Contributions sheet is the record of what happened, and keeping the two apart is what makes the tracker honest. Each goal gets a row with twelve month columns, January through December, and a Total that sums them.
The sample logs deposits from January through August and leaves the later months blank, because the totals only count what has been entered. The Emergency Fund’s row reads 500 in most months, a 300 in April, a skipped July, and a 600 in August, totaling $3,400 for the year so far. The Vacation totals $1,500, the Down Payment $5,600, the New Car $2,250, and the Wedding $4,200. Add the goal rows together and the year-to-date deposits come to $16,950, with monthly totals that swing from $1,650 in June to $2,450 in May depending on which goals got funded that month.
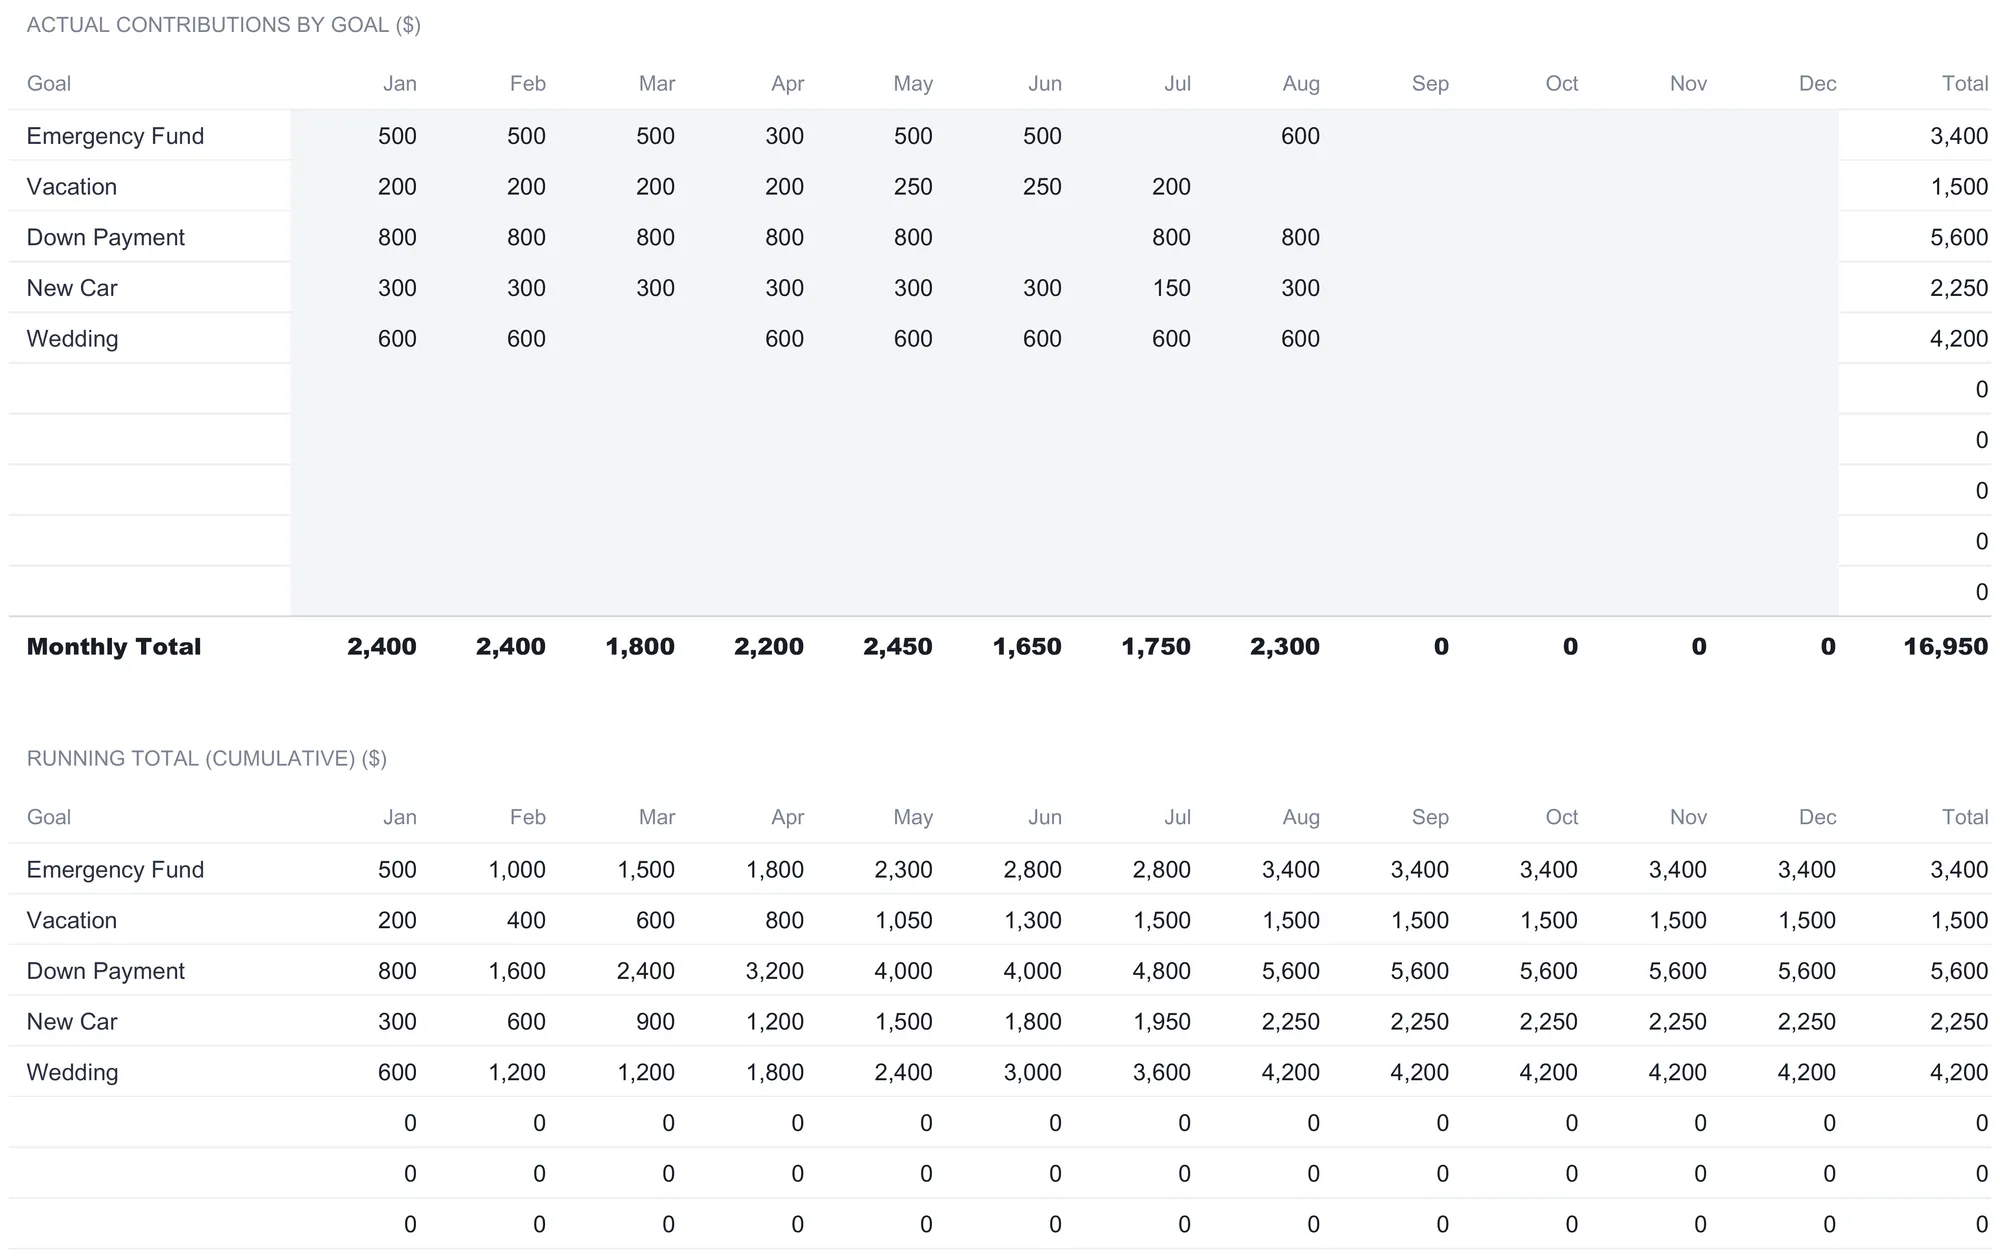
Below the entry grid sits a running total that turns each row into a cumulative line. The Emergency Fund reads 500 in January, 1,000 in February, 1,500 in March, and climbs to 3,400 by August before flattening across the empty months, because a blank month adds nothing to the running figure. That cumulative view is where a stalled goal shows itself: a line that goes flat mid-year is a goal that stopped receiving deposits, which is exactly the kind of thing a single account balance hides.
This is also the sheet that answers a question the plan cannot. The plan says $2,400 a month across all goals. The log shows that only two of the eight recorded months hit that figure, with the rest coming in lower because a contribution was reduced or skipped. Neither number is wrong. One is the intention and the other is the outcome, and having both side by side is what a plan-versus-actual view is for. Nothing here is advice on how much to deposit; the sheet simply records what was deposited and lets you read it against what you planned.
See every goal at once: the Progress Dashboard sheet
The Progress Dashboard is a read-only view built entirely from Goals Setup, and it exists to put the per-goal picture on one screen. It carries two tables. The first, Goal Progress, lists each goal’s current balance, target, progress percentage, and remaining amount. The second, Months Remaining to Goal, restates each goal’s target, current balance, monthly contribution, and the months left at that contribution.
The Remaining column is the one worth pausing on, because it is the gap stated in dollars rather than a percentage. The Emergency Fund shows $6,000 left of its $15,000 target, the Vacation $600, the New Car $4,800, the Wedding $13,400, and the Down Payment $42,000. It is computed as the target minus the current balance, floored at zero so a goal that overshoots reads zero rather than a negative number. Percent complete tells you how far along a goal is; the remaining amount tells you how much cash still has to arrive, which is the figure a contribution plan actually has to cover.
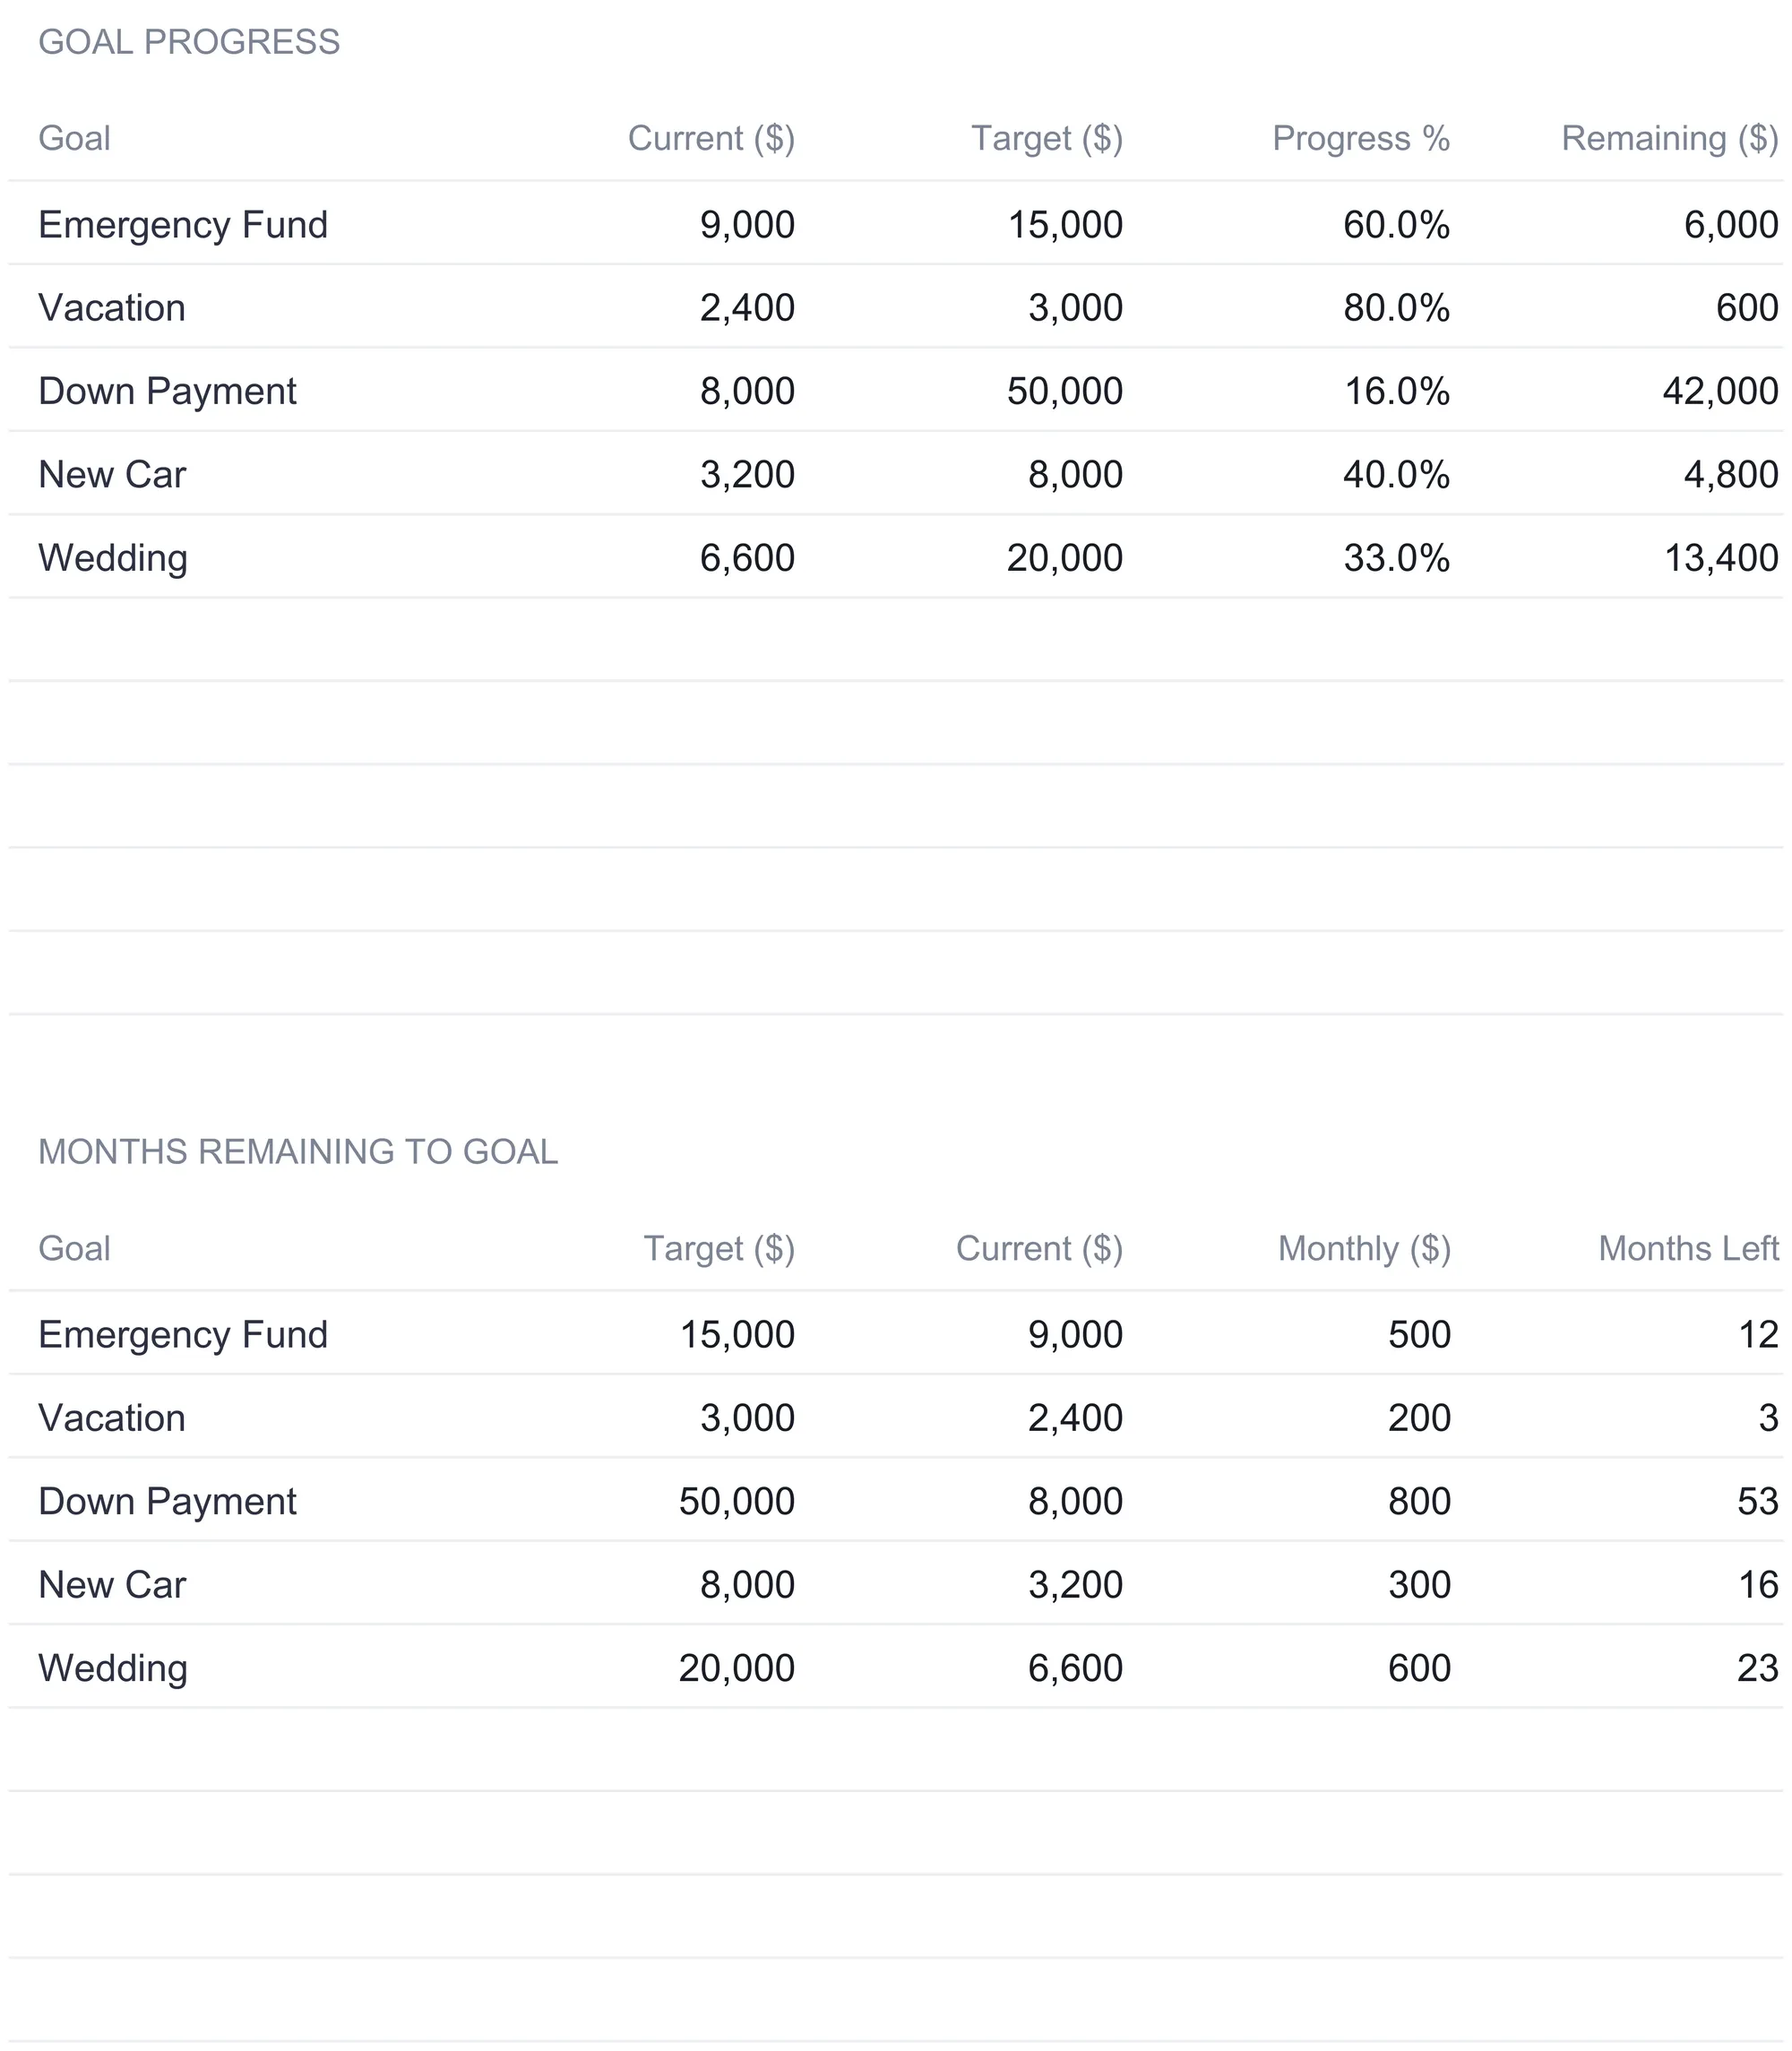
The second table lays the timelines next to each other: 12 months for the Emergency Fund, 3 for the Vacation, 53 for the Down Payment, 16 for the New Car, and 23 for the Wedding. Those are the same Months Remaining figures from Goals Setup, restated here beside the amounts that produce them, so the reason one goal takes four times as long as another is visible in one glance rather than inferred. Because every cell references Goals Setup, changing a target or a contribution there updates both tables here at once, with no second edit to keep in sync.
Test the plan before you commit: the What-If Scenarios sheet
The What-If Scenarios sheet is where the tracker stops describing the present and starts projecting. You pick one goal in the cell at the top, and both grids below solve for it. The sample has the Emergency Fund selected, and the sheet looks up its $15,000 target and $9,000 balance automatically, leaving a $6,000 remaining gap to close.
The first grid, Months to Goal, is a table with monthly contribution amounts down the side, from $200 to $800, and annual interest rates across the top, from 0 to 5 percent. Each cell answers a single question: at this contribution and this rate, how many months until the gap closes? At a $200 monthly contribution and a 0 percent rate the answer is 30 months, which is simply the $6,000 gap divided by $200. Raise the rate to 5 percent and it falls to 25, because returns do part of the work. Move down to $500 a month and the figure is 12 from 0 through 4 percent, matching the Months Remaining that Goals Setup shows for this goal, then 11 at 5 percent. At $800 a month it is 8 across the whole row. A dash would mean a combination that never closes the gap, so there is no figure to report.
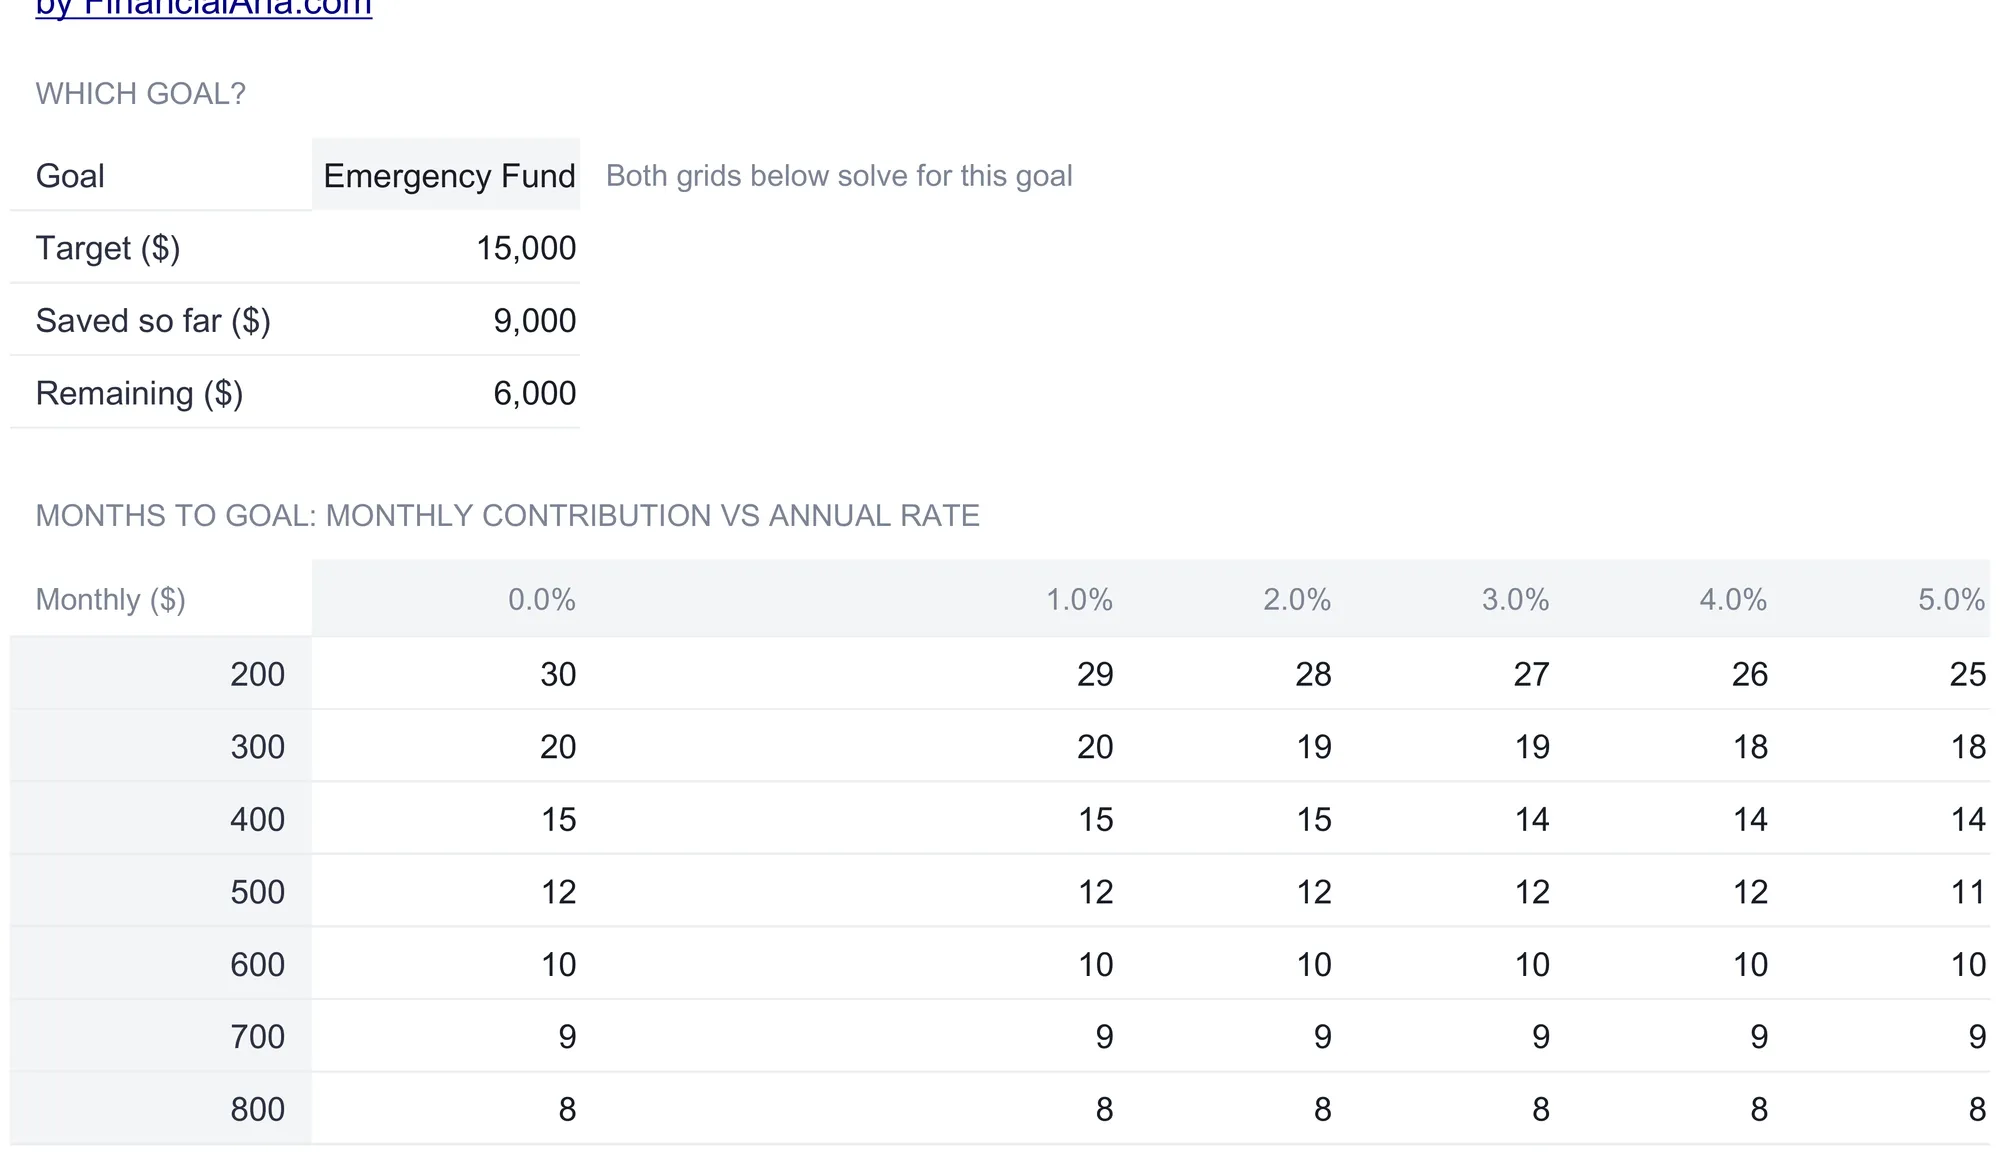
The math under those cells is the NPER function, the standard time-value-of-money calculation a financial calculator runs, treating the goal as a balance you are funding at a fixed monthly amount and a fixed rate. A second grid, below the one in the crop, mirrors the same contribution and rate ladders and reports the interest earned over the solved months, meaning the balance when the goal is reached less what you put in. At a 0 percent rate that grid comes to zero, because money with no return earns no interest. At higher rates it fills in, so you can see how much of the finish came from deposits and how much from growth. The contribution and rate ladders are yours to edit, and because both grids read the same ladders, they always answer for the same combinations.
Two things are worth being clear about. The grid is a projection, not a promise: it assumes a steady contribution and a constant rate, and real deposits and real savings rates both wobble. And it is deliberately silent on which combination anyone should choose. It lays out the trade between contribution size, rate, and time, and leaves the choosing to the reader. The Investor.gov compound interest calculator runs the same kind of projection from the regulator’s own site, and it is a useful cross-check on any figure the grid produces.
Read the trajectory: the Year-over-Year sheet
The last data sheet zooms out to the multi-year view. Year-over-Year sets each goal’s balance at the end of 2024 and 2025 against where it stands today, and the Today column reads Current Saved straight from Goals Setup, so it never has to be retyped. Two columns then compare the present against the most recent full year: Change in dollars, and Change as a percentage.
The sample tells a clear growth story. The Emergency Fund went from $3,200 at the end of 2024 to $5,600 at the end of 2025 to $9,000 today, a $3,400 gain, or 60.7 percent, over the last full year. The Down Payment climbed from $900 to $2,400 to $8,000, and the New Car from $400 to $950 to $3,200, both showing triple-digit percentage jumps off small prior balances. Add the goals up and the totals read $5,600 saved through 2024, $12,250 through 2025, and $29,200 today, a $16,950 change from last year, which is 138.4 percent.
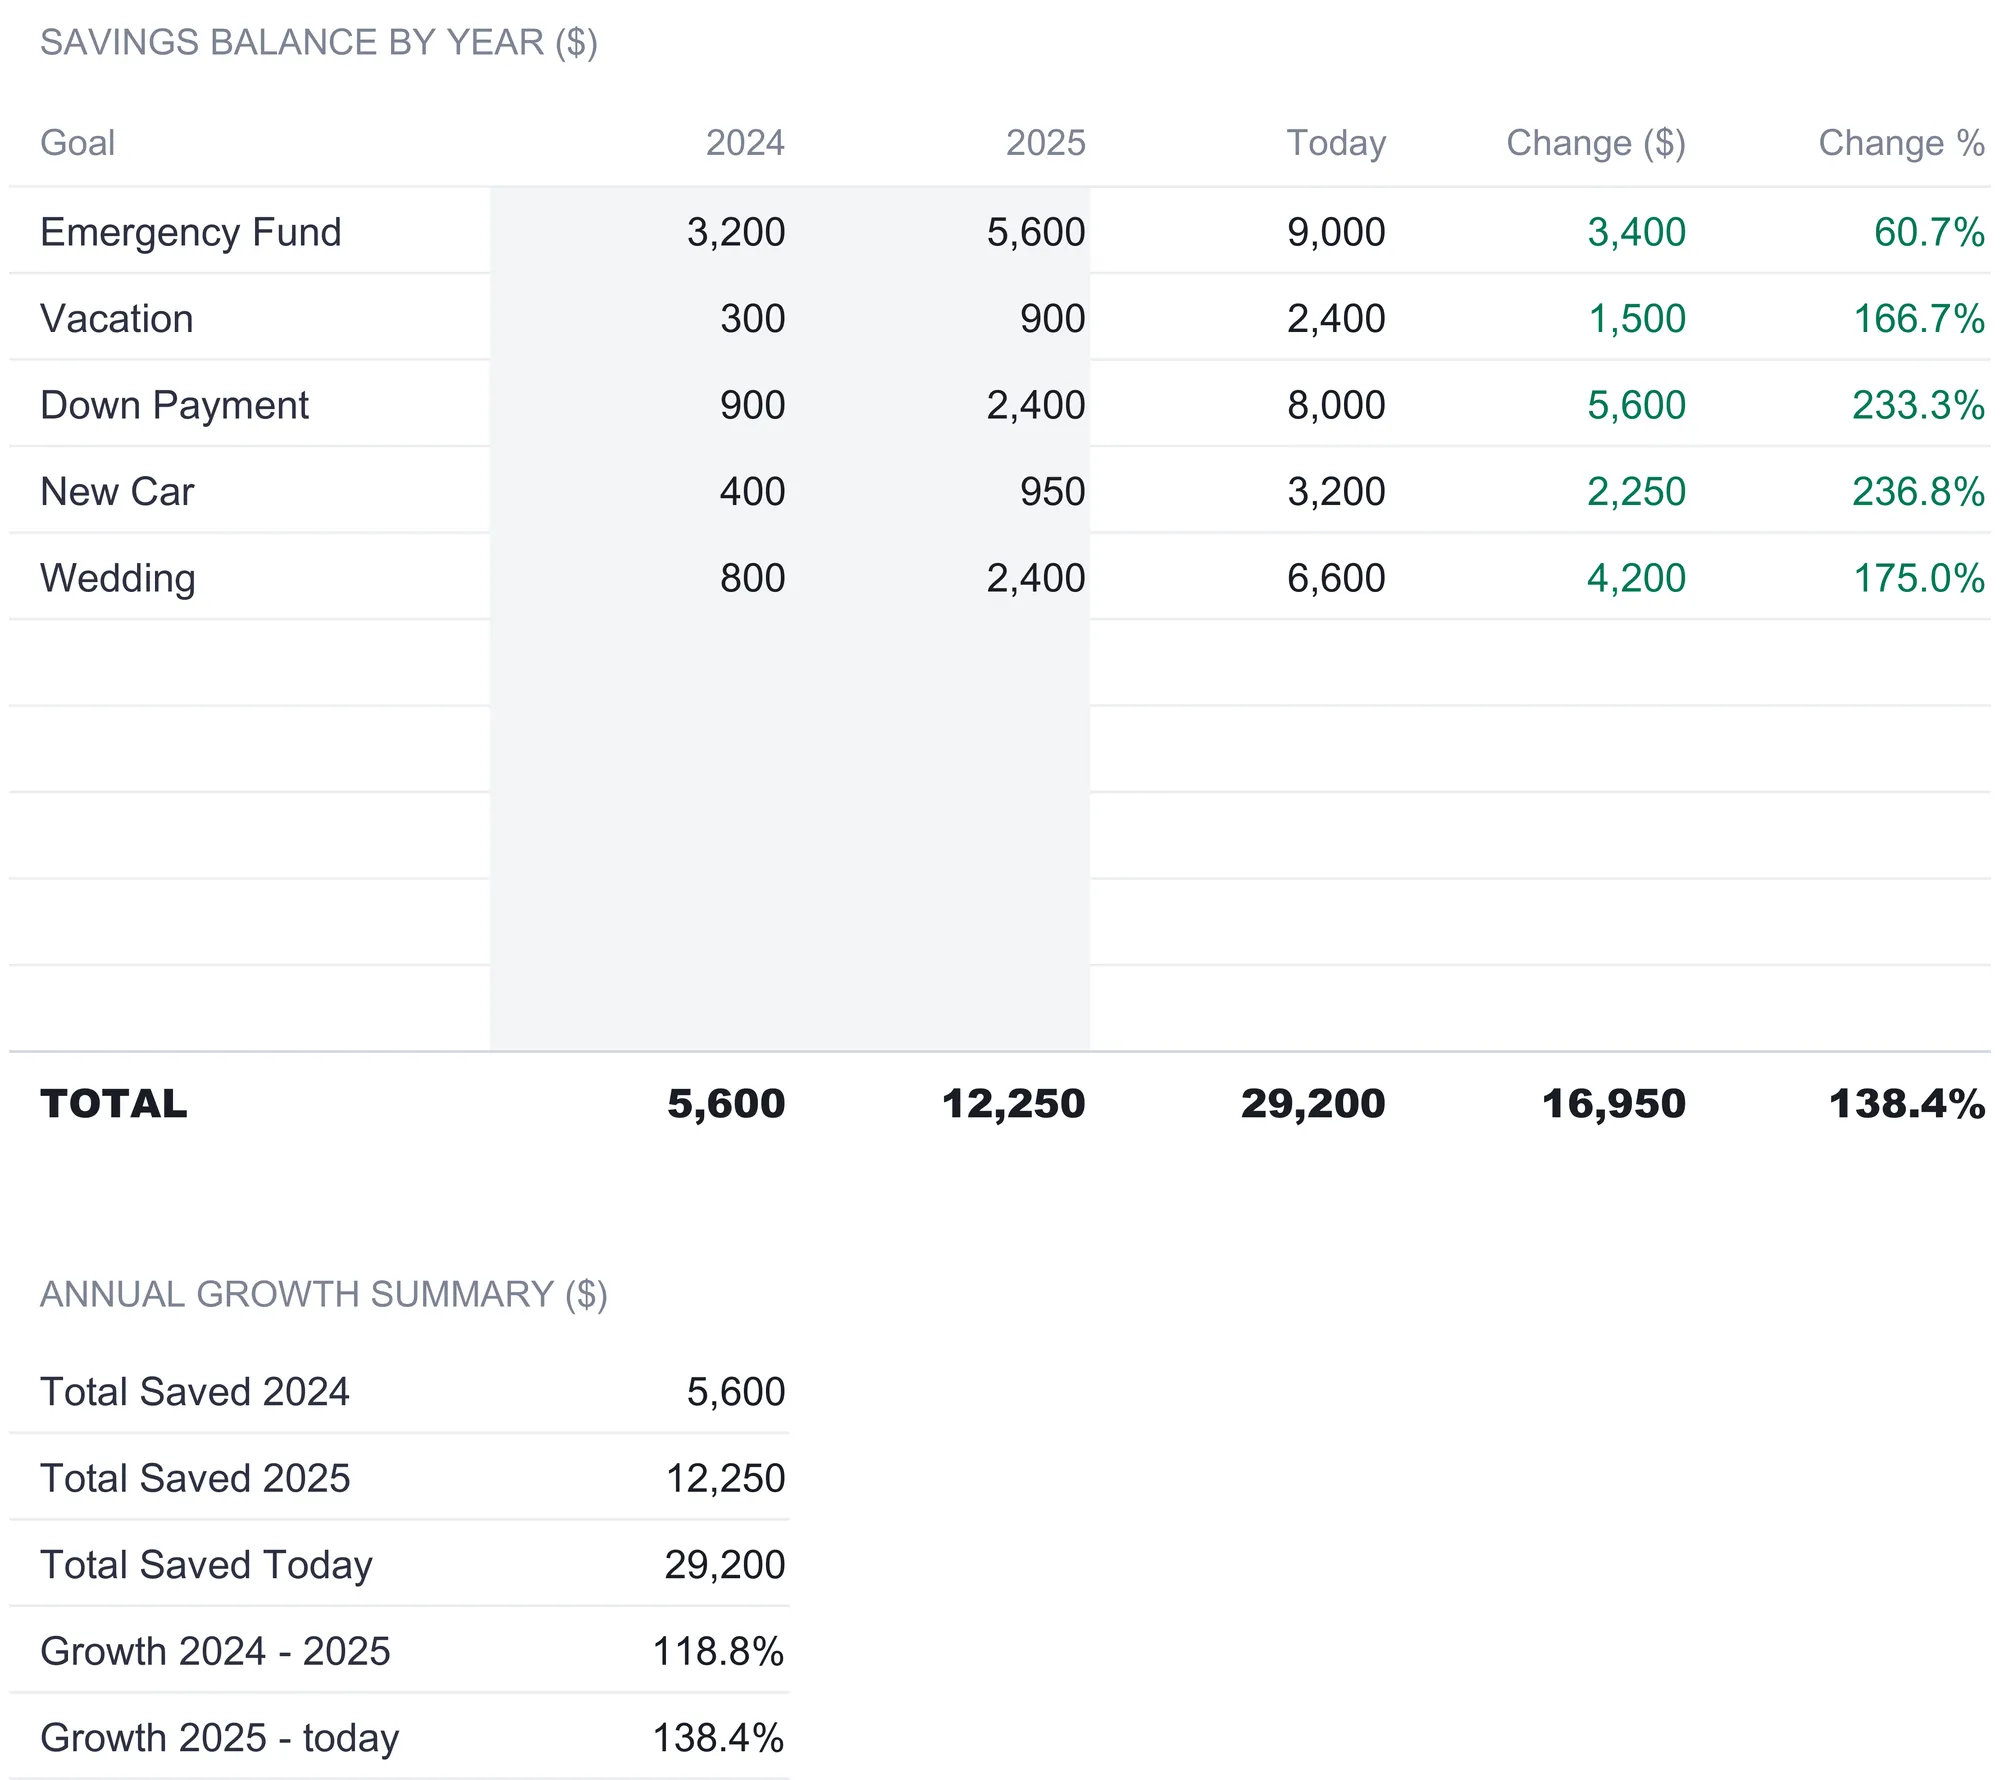
That $16,950 total change is worth noticing, because it is the same figure the Monthly Contributions sheet reports for the year-to-date deposits. The balances grew from last year by exactly what the deposit log recorded, which is the kind of tie-out a one-list workbook produces on its own: two sheets built for different purposes agree because they draw on the same underlying entries. A small growth summary at the bottom restates the totals and the two year-over-year growth rates, 118.8 percent from 2024 to 2025 and 138.4 percent from 2025 to today, for a quick read on whether the pace is holding. The 2024 and 2025 balances are the only figures you type here; everything else is carried or calculated.
The dashboard: six numbers and two charts
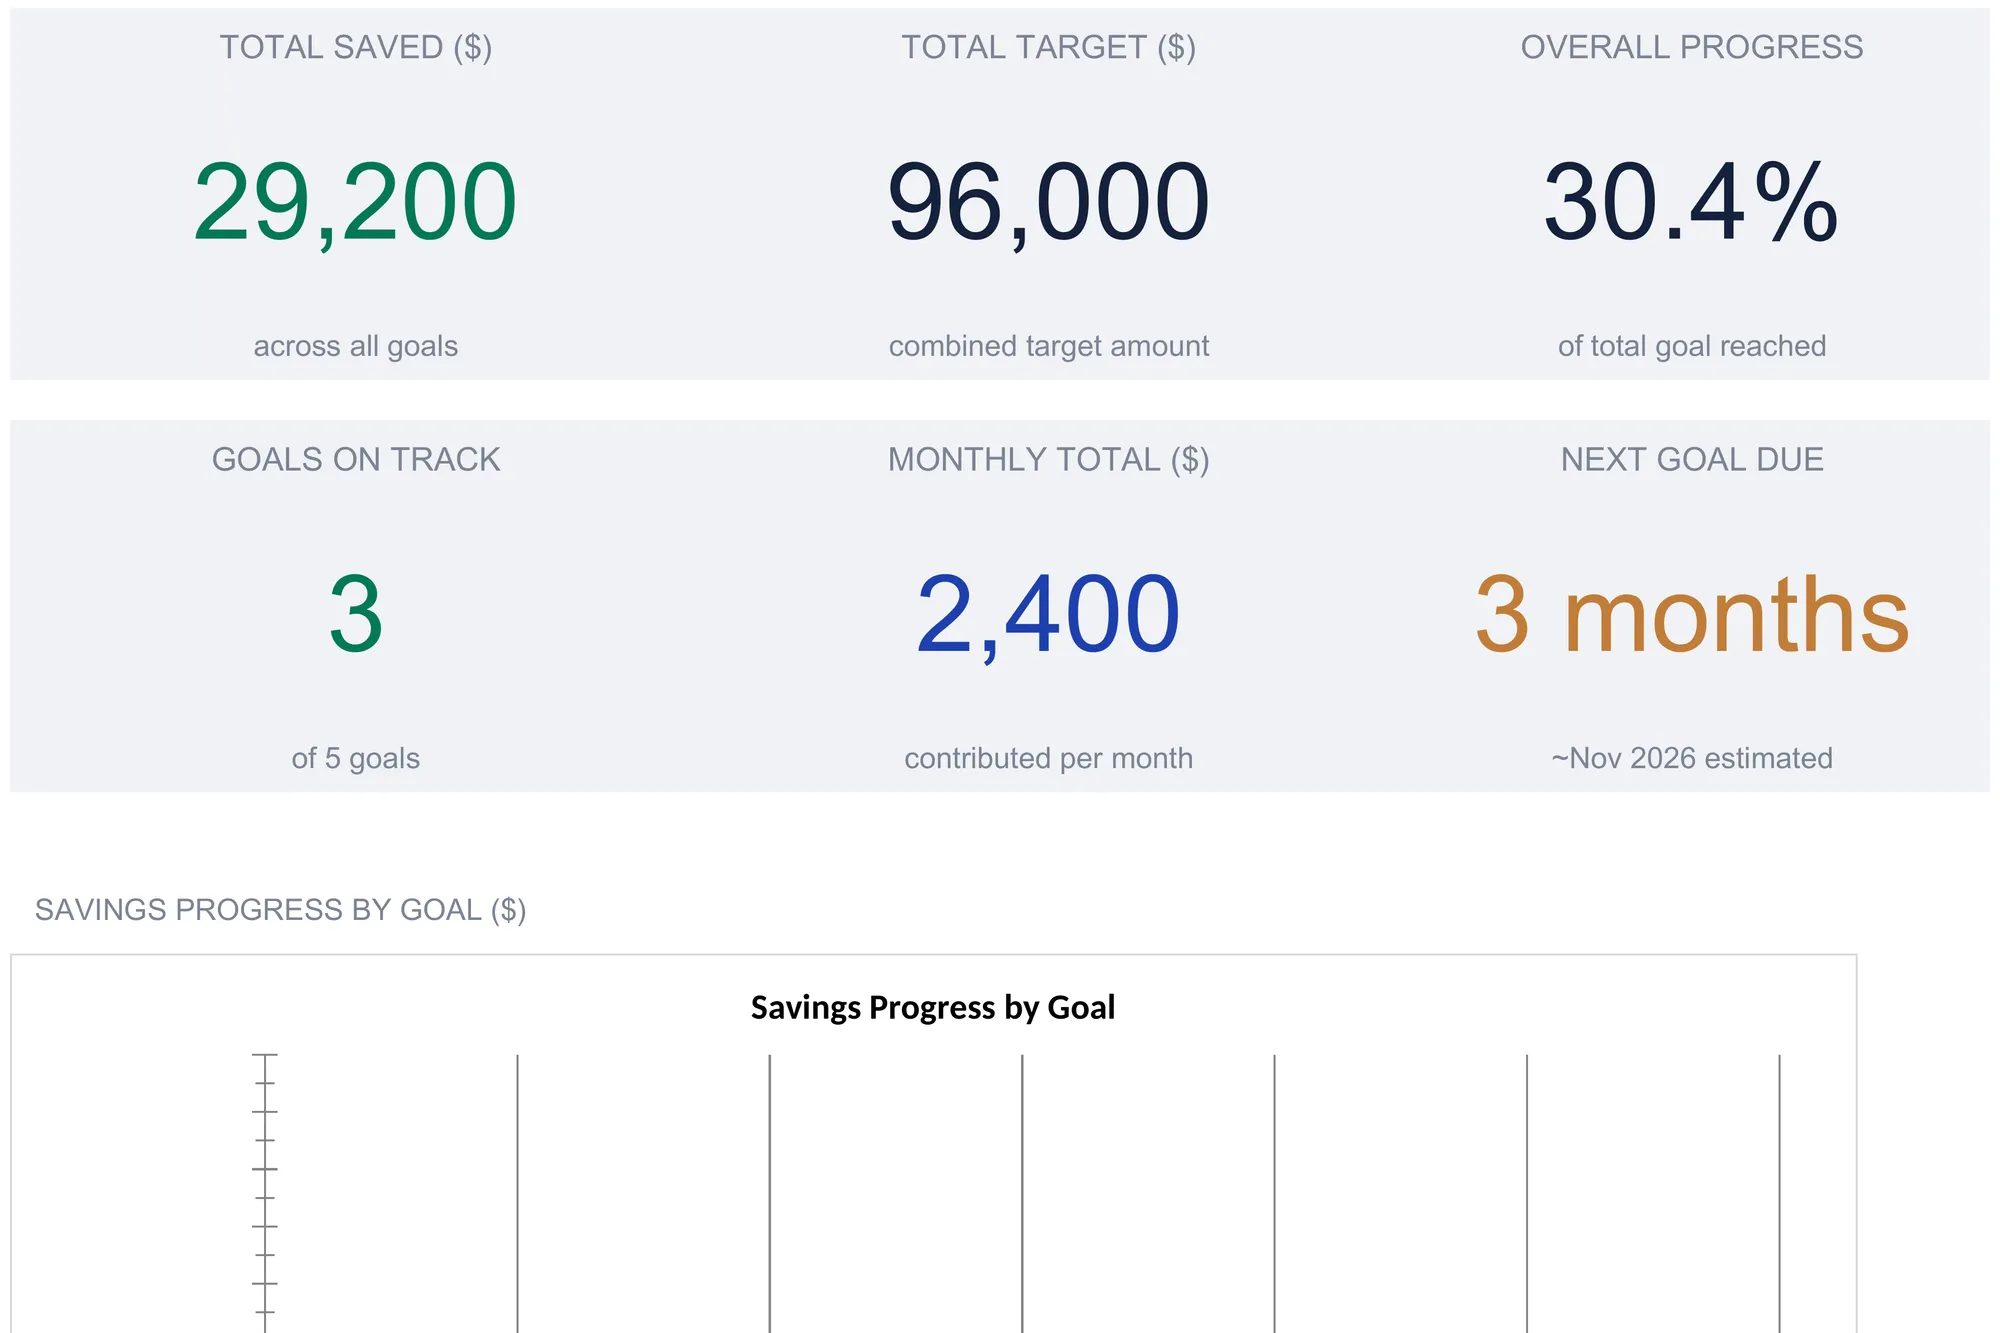
With the goals defined and the deposits logged, the Dashboard reads the year in one screen. Six KPI tiles sit across the top and a pair of charts sit below them, and every value is pulled from the sheets already covered rather than entered here.
| Metric | Sample value | How it is derived |
|---|---|---|
| Total Saved | $29,200 | Sum of every goal’s current balance |
| Total Target | $96,000 | Sum of every goal’s target |
| Overall Progress | 30.4% | Total saved divided by total target |
| Goals on Track | 3 of 5 | Count of Complete and On Track goals |
| Monthly Total | $2,400 | Sum of the planned monthly contributions |
| Next Goal Due | 3 months | Soonest completion among outstanding goals |
The Next Goal Due tile pairs its month count with an estimated calendar month, reading “around November 2026” in the sample by adding the three months to the current date, so the soonest finish line has a date on it and not just a countdown. Below the tiles, a bar chart compares Saved against Target for each goal, and a pie chart shows how the saved dollars are allocated across goals. Both charts read the same ten goal slots the rest of the workbook uses, so a sixth or seventh goal appears on them the moment it is added.
The value of the dashboard is that it is derived, not maintained. It holds no numbers of its own, so there is nothing on it to update and nothing that can fall out of step with the goals list. Change a target on Goals Setup or log a deposit on Monthly Contributions, and the tiles and charts move on their own. That is the whole argument for the one-list structure, compressed into a single screen.
Percent complete, months remaining, and status in plain terms
Three of the tracker’s figures do most of the work, and each is a plain operation on numbers the goals list already holds.
Percent complete (9,000 ÷ 15,000 = 60 percent for the Emergency Fund) is how far a goal has come toward its target.
Months remaining (6,000 ÷ 500 = 12 months) is how long the gap takes to close at the contribution you entered, rounded up to a whole month.
Status compares those months against the calendar. It measures the months the plan needs against the months left until your target date, and reports On Track when the plan fits and Behind when it does not. Complete is a balance that has reached its target, and In Progress is a goal with no date to measure against.
Because months remaining divides the gap by the contribution, it responds to only two levers, the size of the gap and the size of the deposit, which is what makes the what-if grid so direct: it walks the contribution up and down and reads the months back out. None of these figures carries a recommendation. They restate what the inputs imply, and the choices about targets, dates, and contributions stay entirely with the person filling in the tinted cells.
Excel or Google Sheets for a savings goal tracker
The tracker is an .xlsx file built on plain formulas, with no macros and no add-ons, so it runs the same way in Microsoft Excel, in Google Sheets after an upload, and in LibreOffice Calc. Every formula in the file uses functions Excel has had since 2010, including the NPER and FV functions behind the what-if grids, so older builds open it without errors. Google Sheets suits anyone who wants to log a deposit from a phone the day it clears; Excel and LibreOffice suit those who prefer a local file. The structure described here is equally buildable in any of them.
One workbook-wide convenience is the currency selector on the Dashboard, a dropdown of more than thirty symbols next to the title. Choosing one relabels every amount column and KPI across all sheets at once. It changes the label only, with no conversion of the underlying numbers, so it dresses the sheet in your currency without touching the math.
Which tracker fits which saver
- Savings Goal Tracker Ultimate Spreadsheet Template ($29) is the workbook this walkthrough follows: the goals list, the deposit log, the per-goal progress view, the what-if projection grids, the year-over-year comparison, and the six-tile dashboard, for up to 10 goals.
- The free Savings Goal Tracker is a single-sheet start for anyone who just wants to list goals with their targets, saved amounts, and dates, and the Savings Goal Tracker Essentials ($19) adds a goals sheet, a monthly tracking sheet, and a dashboard between the two.
- Emergency Fund Calculator Ultimate Spreadsheet Template ($29) goes deep on the single goal that most often anchors a savings plan, sizing a target against your own monthly expenses with a fund-building plan, a tiered-target view, and its own what-if scenarios, for a saver whose focus is the cushion rather than the whole slate of goals. The CFPB’s guide to building an emergency fund is a useful companion read on the savings-habit side of that goal.
Related
- How to Build a Savings Goal Tracker in Google Sheets (Step by Step) - the from-scratch build of this layout, with the progress-bar and status formulas written out cell by cell
- How to Track Multiple Savings Goals in Google Sheets - the bucket-allocation method for running many goals out of one bank account, with a reconciliation row
- How to Track Net Worth in a Spreadsheet - the same one-list discipline applied to the whole balance sheet, with your savings goals as lines on it
Frequently asked questions
How does the tracker work out months remaining for a goal?
It divides the gap by the monthly contribution and rounds up. Months Remaining on the Goals Setup sheet takes the target minus the current balance, divides by the monthly contribution you entered, and rounds up to a whole month. The Emergency Fund sample needs 15,000 and holds 9,000, so the 6,000 gap over a 500 monthly contribution comes to 12 months. Change the contribution and the figure moves. With no contribution entered there is nothing to divide by, so the cell shows a dash rather than a number.
What is the difference between the monthly contribution on Goals Setup and the Monthly Contributions sheet?
One is a plan, the other is a record. The Monthly Contribution column on Goals Setup is a single planned figure the projections use, such as 500 a month for the Emergency Fund. The Monthly Contributions sheet is a twelve-column log of what you actually deposited each month, which can differ from the plan. In the sample the logged deposits total 16,950 across January through August, and comparing that log against the plan is how the sheet surfaces the months a deposit came in short or got skipped.
How many savings goals can the spreadsheet hold?
Up to 10 goals. The sample fills five rows, and the formulas already run down all ten, so a sixth goal goes on the first free row and every sheet updates without dragging a formula or extending a range. The dashboard's goal count reflects how many rows carry a name, which is why it reads 'of 5 goals' in the sample.
What do the On Track and Behind labels in the Status column mean?
They compare the time the plan needs against the time left until your target date. On Track means the months required at your contribution fit inside the months remaining until the Target Date you set. Behind means they do not, so at that contribution the goal lands after the date. Complete means the balance has reached the target, and In Progress appears when no Target Date is entered, so there is no date to measure against. These are descriptions of the numbers you typed, not judgments about the goals themselves.
Does the what-if grid account for interest on savings?
Yes. The What-If Scenarios sheet solves the months to reach a goal across a grid of monthly contributions and annual interest rates, using the same time-value-of-money math a financial calculator uses, and a second grid shows the interest earned over those months. At a 0 percent rate the answer is simply the remaining gap divided by the contribution. A higher rate reaches the goal a little sooner, and the interest grid reports how much of the final balance came from returns rather than deposits.
Sources
- Compound Interest Calculator - U.S. Securities and Exchange Commission (Investor.gov)
- An essential guide to building an emergency fund - Consumer Financial Protection Bureau
About this article
Every figure, column name, formula, and feature description checked on 2026-09-10 against the shipped Savings Goal Tracker Ultimate workbook (Dashboard, Goals Setup, Monthly Contributions, Progress Dashboard, What-If Scenarios, Year-over-Year and How to Use sheets). The Investor.gov compound interest calculator and the CFPB emergency fund guide checked against the live sources at writing time. Last reviewed September 2026.