Free Profit and Loss Projection Spreadsheet Template
Project revenue, costs, and profit over a specified period. Useful for business planning, forecasting, and evaluating financial scenarios.
Your template is downloading!
Here's what you could do with the Pro version:
- Project revenue and expenses for a single scenario across 6 months
- Dashboard with gross profit and net income
- Basic P&L structure with revenue minus costs
- Works in Excel and Google Sheets
- Revenue Forecast sheet with up to 10 product or service lines, monthly projections, and annual totals with growth rate tracking
- COGS sheet breaking down direct material, direct labor, and overhead costs per revenue line with gross margin calculations
- Operating Expenses sheet with 12 expense categories across 12 monthly columns and annual budget vs actual tracking
- Consolidated P&L statement pulling from all input sheets: revenue, COGS, gross profit, operating expenses, operating income, and net income
- Dashboard with 6 KPI cards: annual revenue, annual COGS, gross margin %, operating income, net income, and break-even month
Free vs Pro - here's the difference
- Project revenue and expenses for a single scenario across 6 months
- Dashboard with gross profit and net income
- Basic P&L structure with revenue minus costs
- Works in Excel and Google Sheets
- Revenue Forecast sheet with up to 10 product or service lines, monthly projections, and annual totals with growth rate tracking
- COGS sheet breaking down direct material, direct labor, and overhead costs per revenue line with gross margin calculations
- Operating Expenses sheet with 12 expense categories across 12 monthly columns and annual budget vs actual tracking
- Consolidated P&L statement pulling from all input sheets: revenue, COGS, gross profit, operating expenses, operating income, and net income
- Dashboard with 6 KPI cards: annual revenue, annual COGS, gross margin %, operating income, net income, and break-even month
What's Included
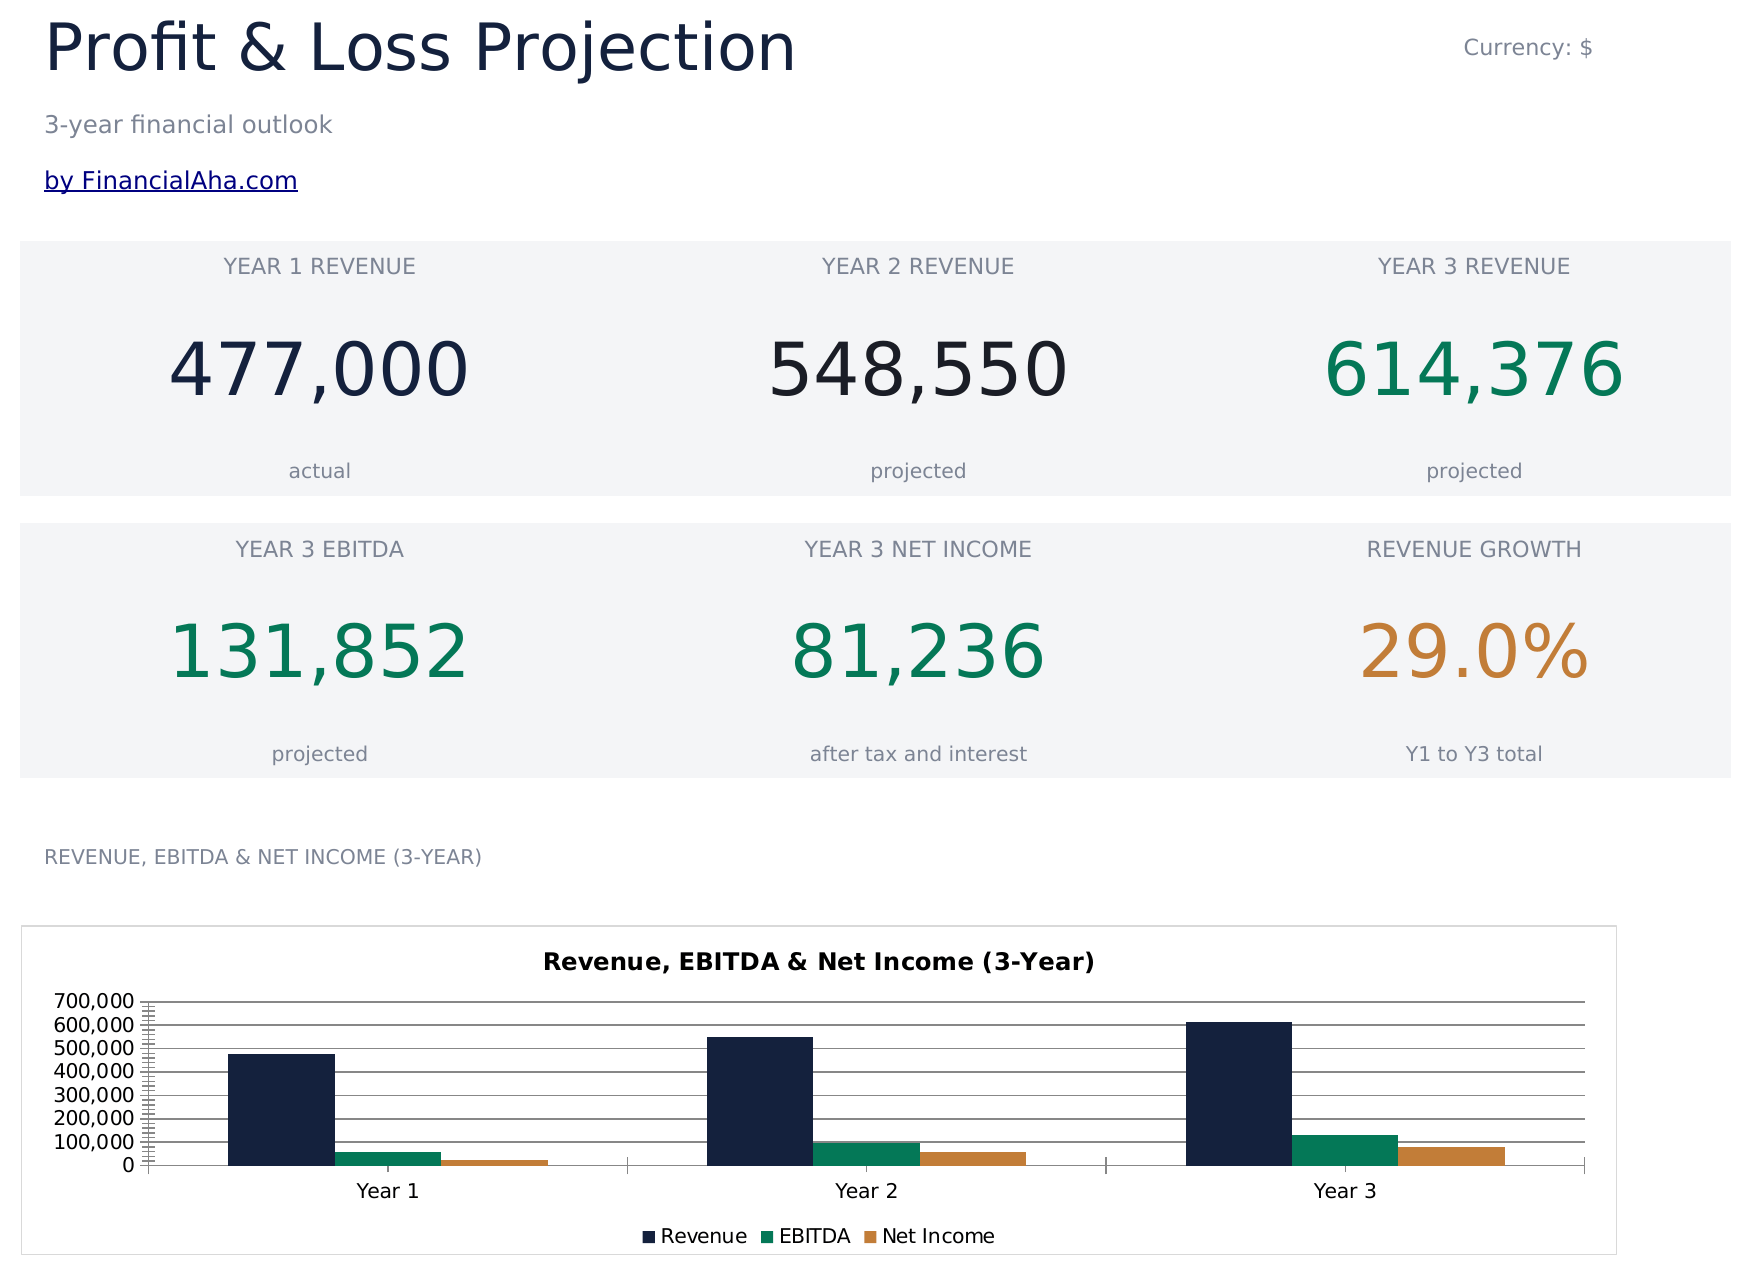
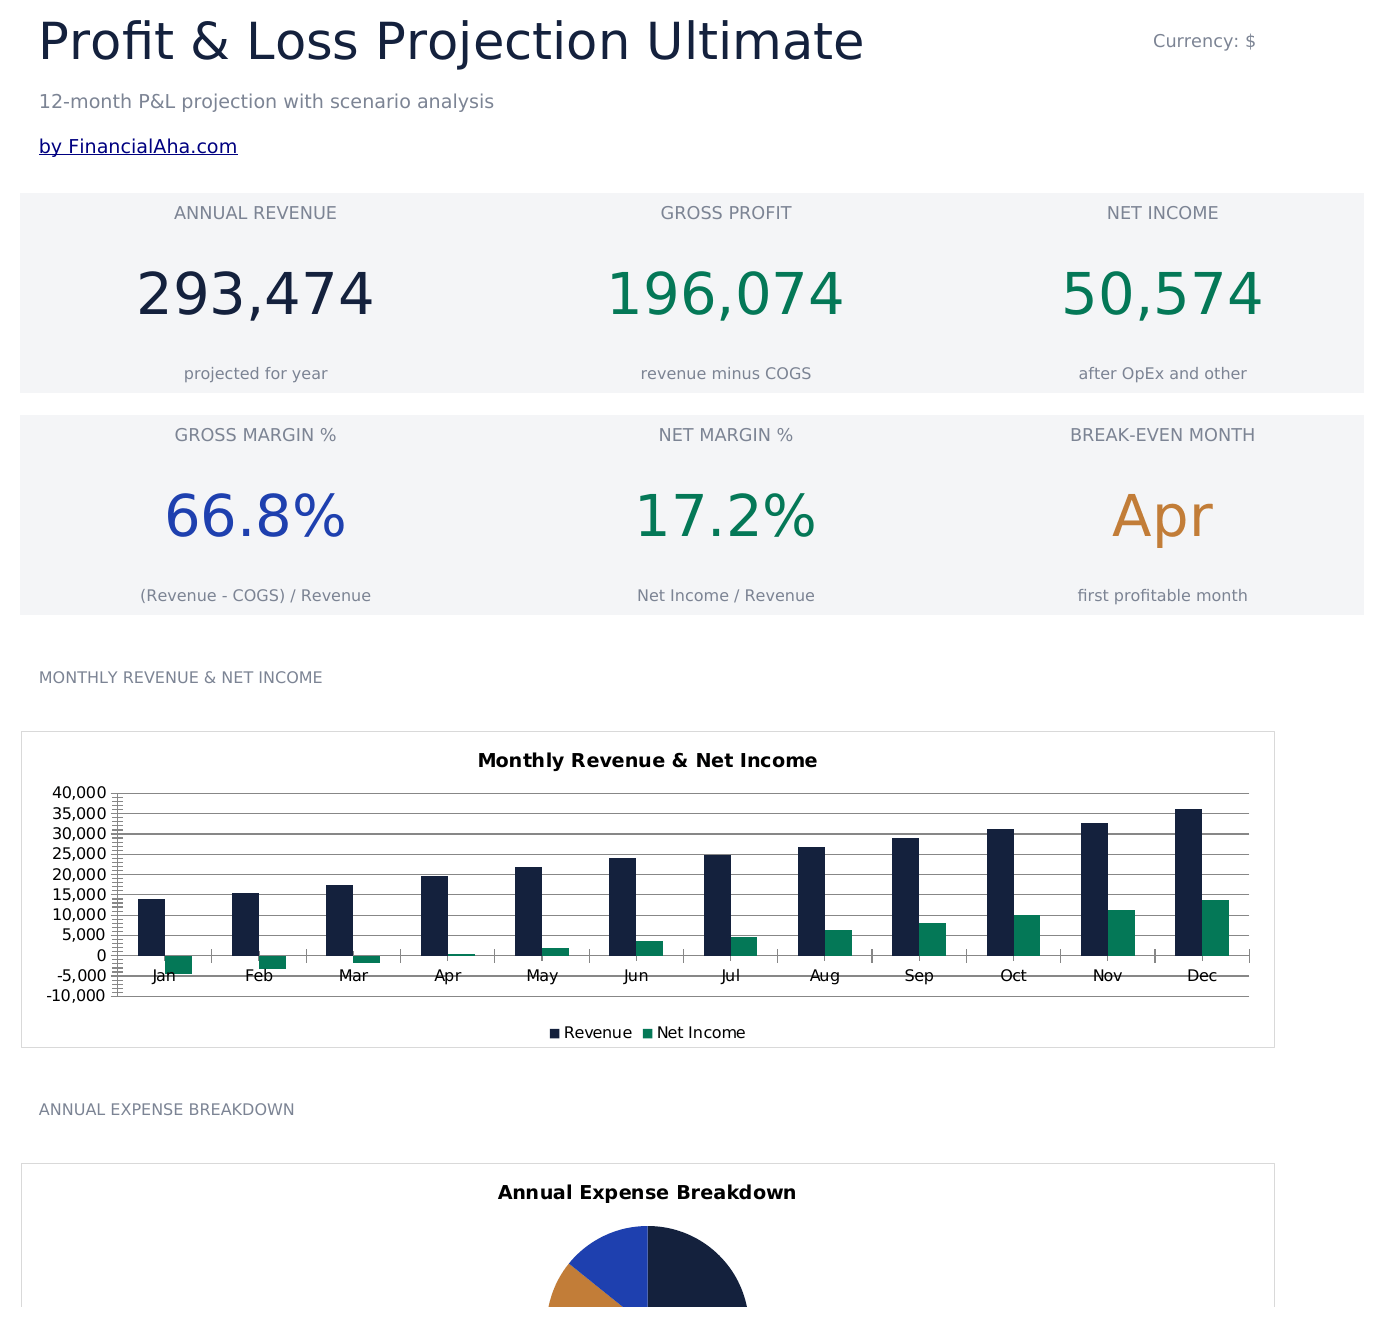
- Dashboard with P&L overview showing total revenue, cost of goods sold, gross profit, and net profit
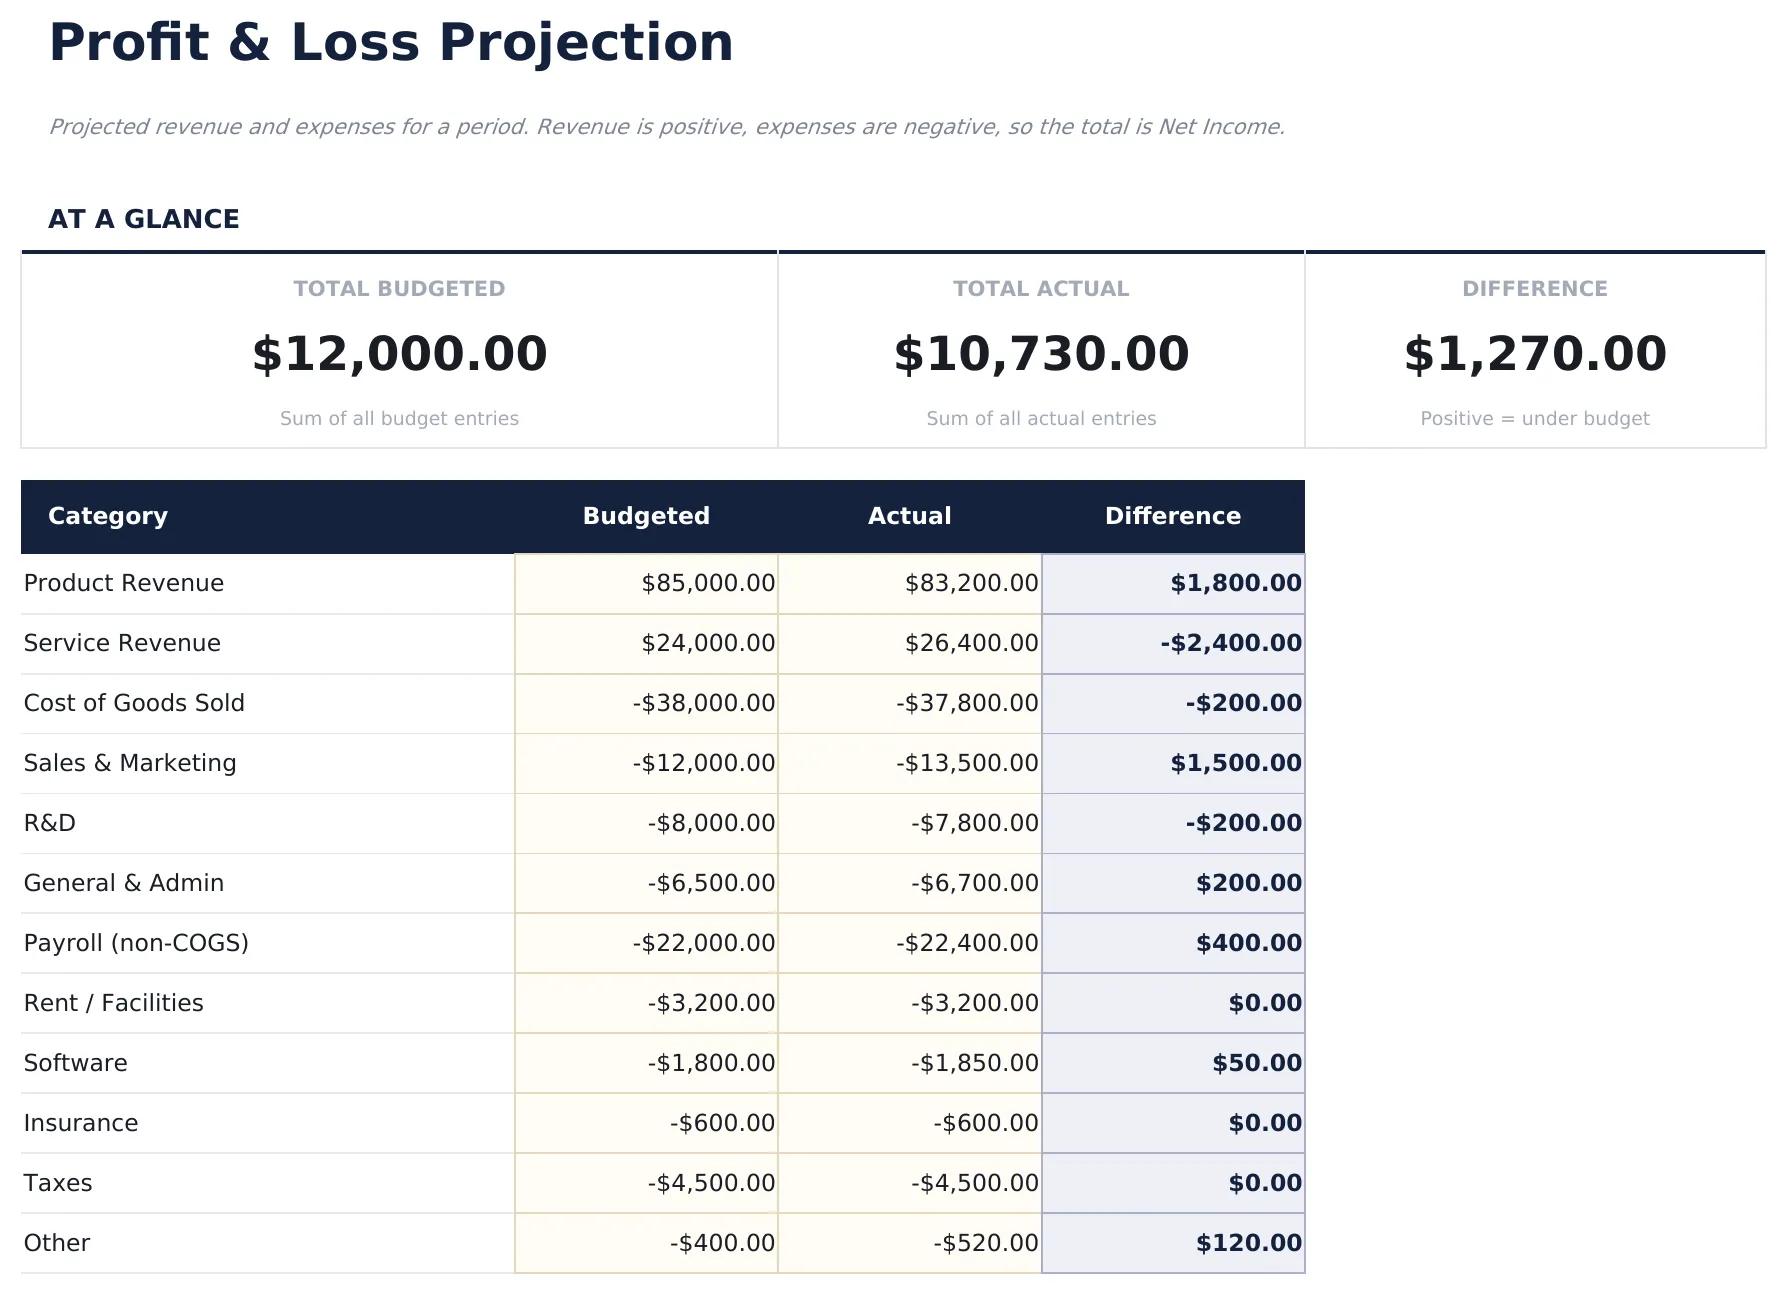
- P&L statement with revenue lines, direct costs, operating expenses, and net income with automatic subtotals
- Gross profit and net profit calculations with automatic margin percentages displayed alongside dollar amounts
- Monthly or quarterly projection columns spanning up to 12 months with automatic annual totals at the end
- Margin percentage display with color-coded input cells (yellow) and formula-driven projections (blue)
- Works in Microsoft Excel, Google Sheets, and LibreOffice Calc with no setup required
Need more from this template?
The free version covers the basics. The Pro version goes further.
- Project revenue and expenses for a single scenario across 6 months
- Dashboard with gross profit and net income
- Basic P&L structure with revenue minus costs
- Works in Excel and Google Sheets
- Revenue Forecast sheet with up to 10 product or service lines, monthly projections, and annual totals with growth rate tracking
- COGS sheet breaking down direct material, direct labor, and overhead costs per revenue line with gross margin calculations
- Operating Expenses sheet with 12 expense categories across 12 monthly columns and annual budget vs actual tracking
- Consolidated P&L statement pulling from all input sheets: revenue, COGS, gross profit, operating expenses, operating income, and net income
- Dashboard with 6 KPI cards: annual revenue, annual COGS, gross margin %, operating income, net income, and break-even month
Preview
See what's inside this template


How to Use This Profit and Loss Projection Template
Enter revenue projections
List each revenue stream with projected monthly or quarterly amounts across the projection period.
Add cost of goods sold
Enter direct costs associated with delivering your product or service. Gross profit calculates automatically.
Fill in operating expenses
Add monthly estimates for payroll, rent, marketing, utilities, insurance, and other operating costs.
Review net profit
The dashboard shows projected revenue, gross margin, operating expenses, and net profit with margin percentages.
Built by Claude AI. Perfected by us.
We use Claude AI to draft each template, after a deep research. Then our team steps in. We refine the layout, stress-test every formula, fix edge cases, and polish the design until it feels like something we would actually use ourselves. The AI gets us 80% there. The last 20% is all human judgment.
Your template is downloading!
Here's what you could do with the Pro version:
- Project revenue and expenses for a single scenario across 6 months
- Dashboard with gross profit and net income
- Basic P&L structure with revenue minus costs
- Works in Excel and Google Sheets
- Revenue Forecast sheet with up to 10 product or service lines, monthly projections, and annual totals with growth rate tracking
- COGS sheet breaking down direct material, direct labor, and overhead costs per revenue line with gross margin calculations
- Operating Expenses sheet with 12 expense categories across 12 monthly columns and annual budget vs actual tracking
- Consolidated P&L statement pulling from all input sheets: revenue, COGS, gross profit, operating expenses, operating income, and net income
- Dashboard with 6 KPI cards: annual revenue, annual COGS, gross margin %, operating income, net income, and break-even month
Free vs Pro - here's the difference
- Project revenue and expenses for a single scenario across 6 months
- Dashboard with gross profit and net income
- Basic P&L structure with revenue minus costs
- Works in Excel and Google Sheets
- Revenue Forecast sheet with up to 10 product or service lines, monthly projections, and annual totals with growth rate tracking
- COGS sheet breaking down direct material, direct labor, and overhead costs per revenue line with gross margin calculations
- Operating Expenses sheet with 12 expense categories across 12 monthly columns and annual budget vs actual tracking
- Consolidated P&L statement pulling from all input sheets: revenue, COGS, gross profit, operating expenses, operating income, and net income
- Dashboard with 6 KPI cards: annual revenue, annual COGS, gross margin %, operating income, net income, and break-even month
Frequently Asked Questions
How many months can I project?
The template supports up to 12 monthly columns with an annual total. Adjust the date headers for your projection period.
What is gross profit vs net profit?
Gross profit is revenue minus direct costs (COGS). Net profit subtracts all operating expenses from gross profit. Both are shown with margin percentages.
Can I use quarterly instead of monthly?
Yes. Change the column headers from months to quarters and enter quarterly figures. The annual total still sums all columns.
Is this good for startup planning?
Yes. P&L projections are a core part of business plans. Combine this with the Startup Costs template for a complete financial picture.
How do I open this in Google Sheets?
Upload the .xlsx file to Google Drive, then open it with Google Sheets. All formulas and formatting will be preserved.
What license is this template under?
All free templates are released under CC BY 4.0 (Creative Commons Attribution). You can use, modify, and share them freely - including for commercial purposes - as long as you credit FinancialAha.com. They are provided as-is and do not constitute financial advice.
More Free Business Finance Templates
Cash Flow Statement
Prepare a cash flow statement with operating, investing, and financing activities. Track cash inflows and outflows to see net cash position.
FreeSales Forecast
Project future sales by product, service, or channel. Build revenue forecasts with growth assumptions and seasonal adjustments.
FreeStartup Costs
Estimate one-time and recurring costs for launching a new business. Categorize expenses and calculate total funding needed.
FreeBusiness Plan Workbook
Build a comprehensive business plan with financial projections. Includes revenue forecasts, expense estimates, and profit and loss projections.
FreeLooking for premium spreadsheet templates?
Our paid templates include advanced multi-sheet dashboards, native Excel charts, and ongoing updates.