Best Value All-in-One Financial Planning Bundle
✓ Financial Planning✓ Net Worth Tracker✓ Monthly Budgeting✓ Travel Budget Planner✓ Annual Budgeting Planner✓ Monthly Expense Tracker✓ Annual Tax Planner✓ Retirement Planning
View Bundle →
Pro Pro version available - Stock Trading Journal Pro
Free Download - Excel & Google Sheets

Free Stock Trading Journal Spreadsheet Template

Log stock trades with entry, exit, and profit/loss details. Track trading performance over time with running P&L calculations.

Works in Excel and Google Sheets · CC BY 4.0
Stock Trading Journal preview

What's Included

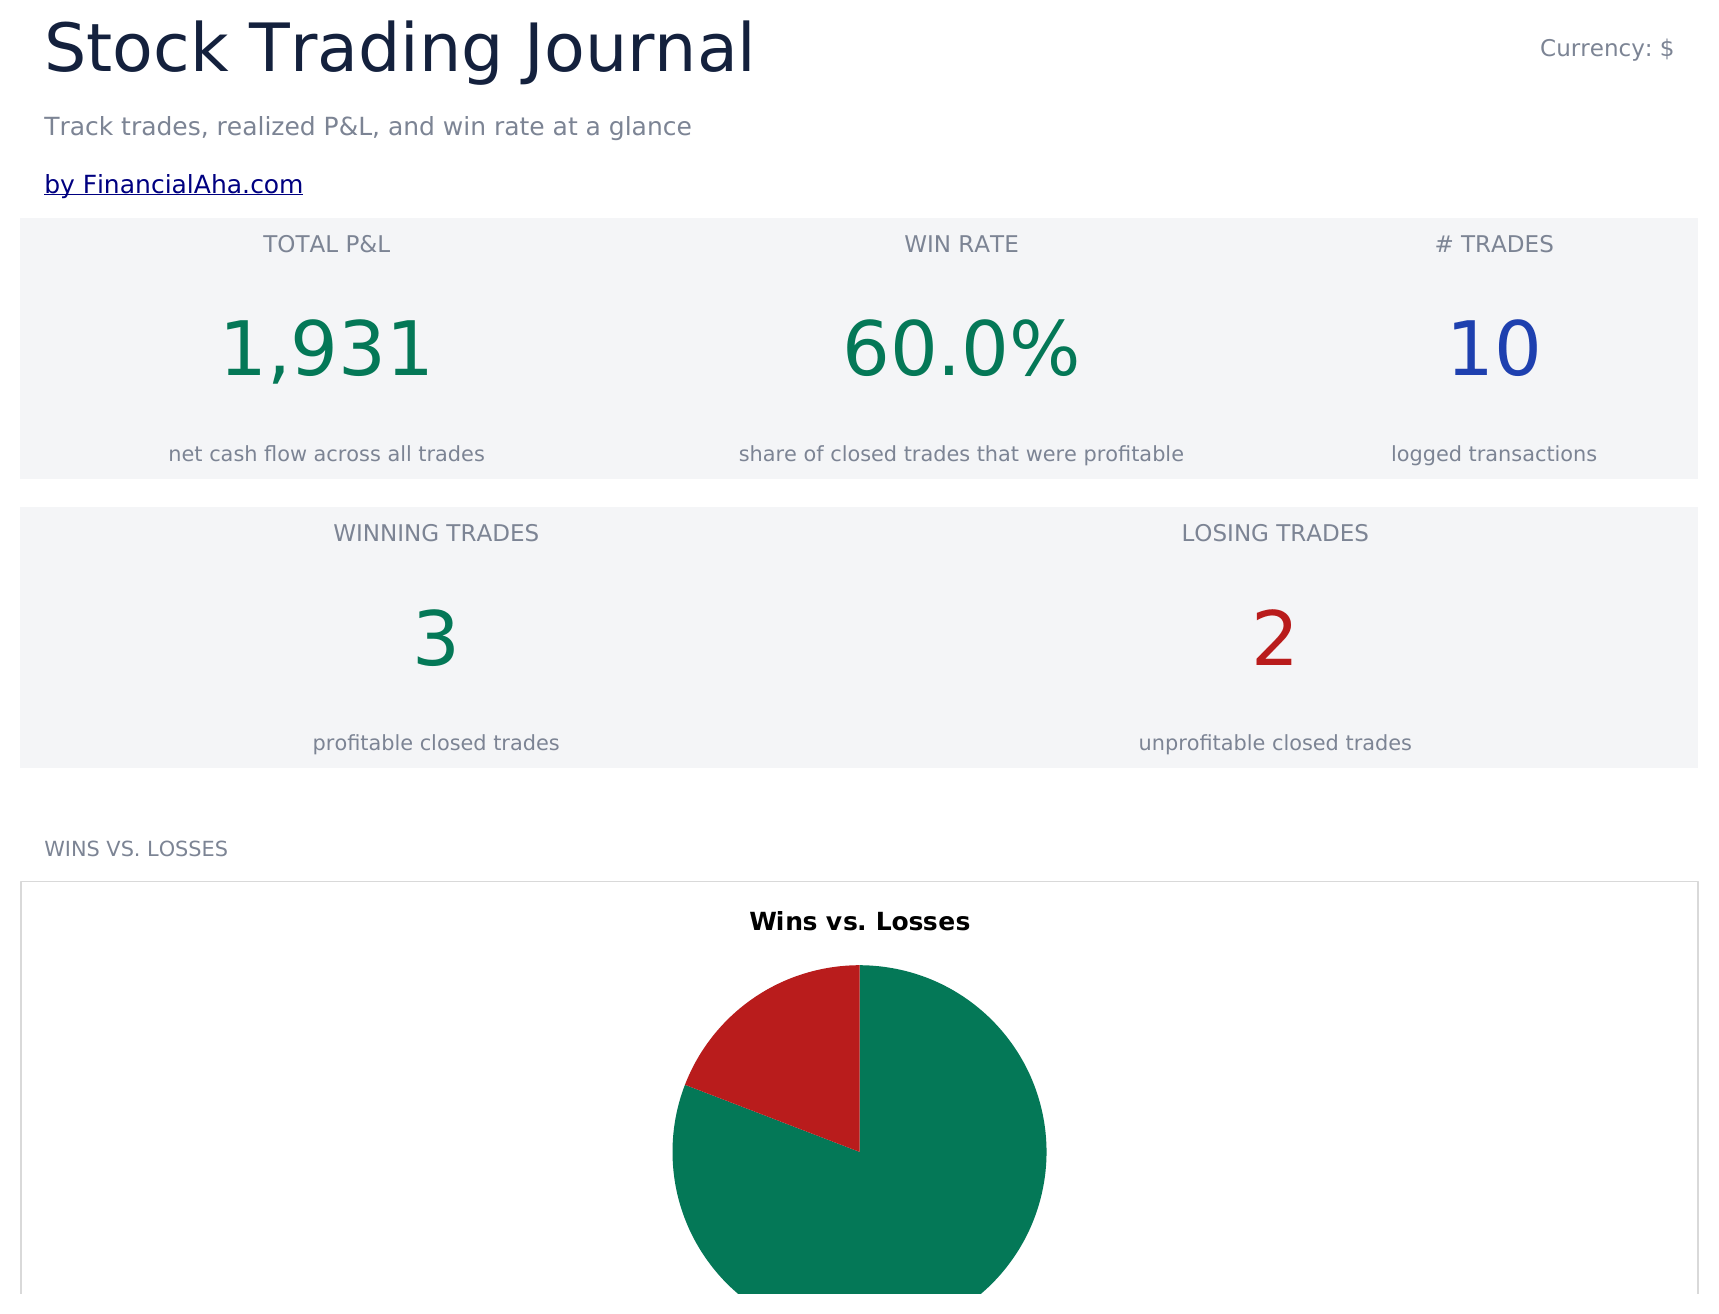
  • Dashboard with trading performance metrics showing total trades, win rate, average return, and cumulative P&L
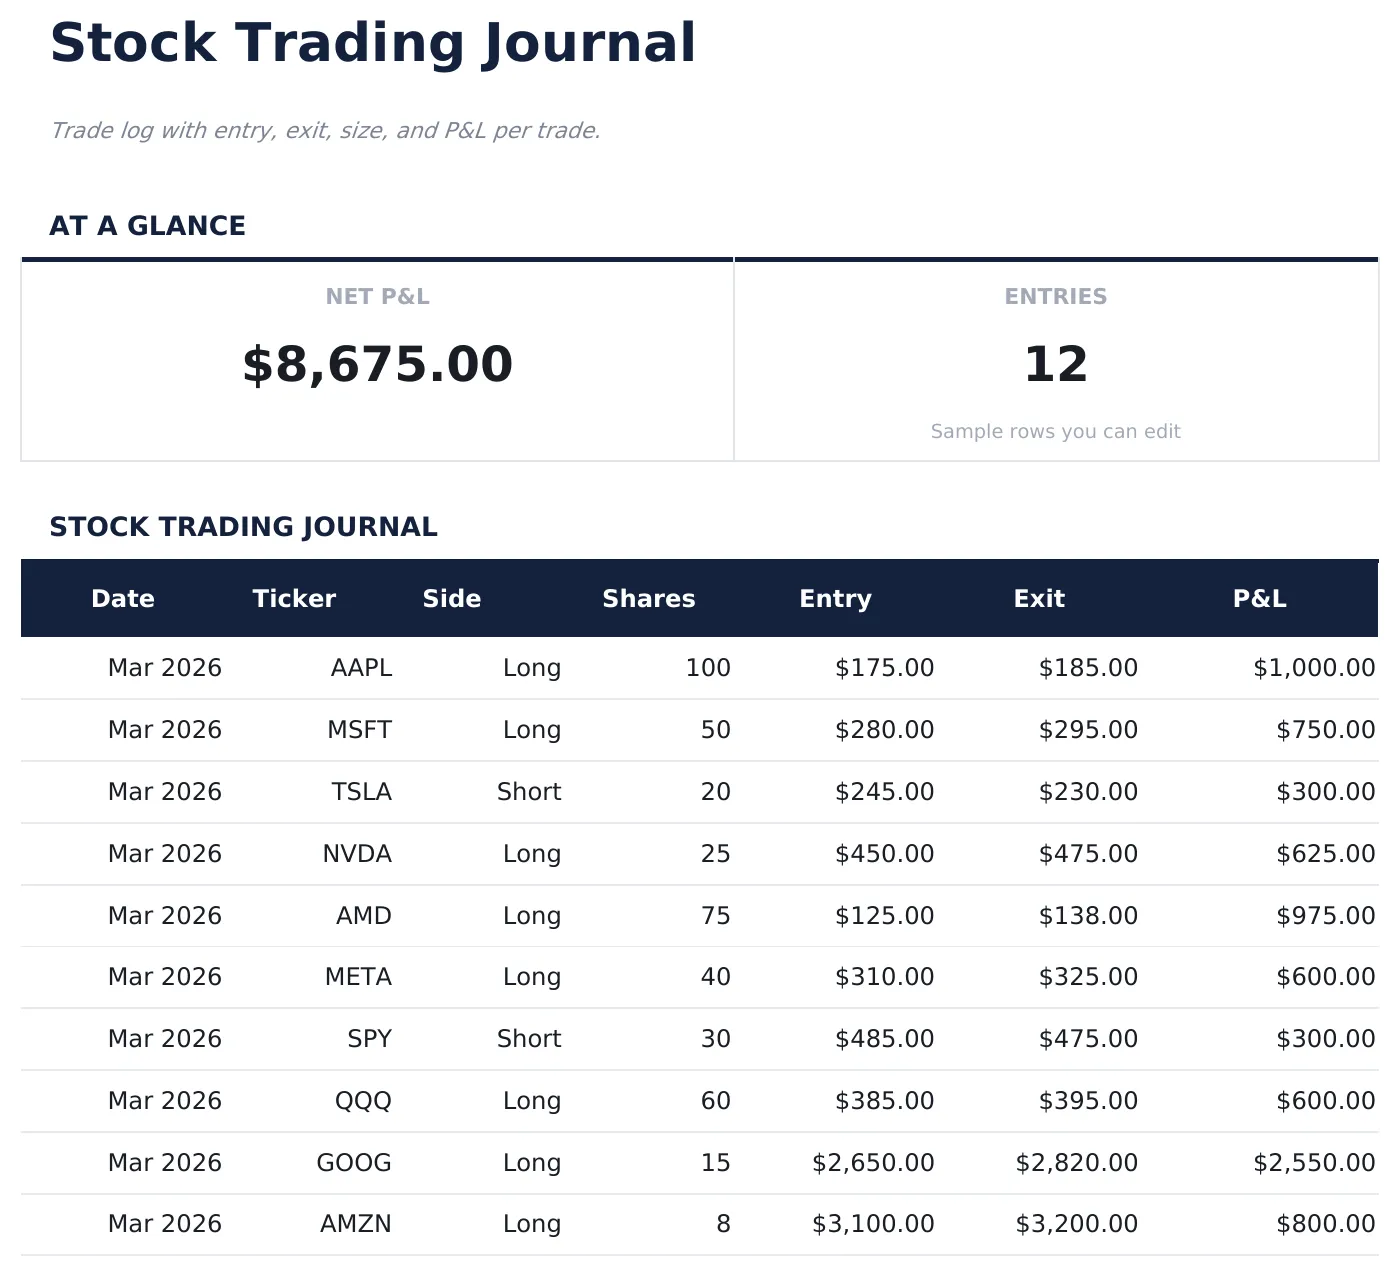
  • Trade log with columns for ticker, date entered, entry price, date exited, exit price, shares, and profit or loss
  • Profit and loss per trade calculated automatically from entry price, exit price, shares, and any commission costs
  • Win rate and average return calculations updated after each trade entry with separate long and short stats
  • Running cumulative P&L with color-coded input cells (yellow) and auto-calculated performance metrics (blue)
  • Works in Microsoft Excel, Google Sheets, and LibreOffice Calc with no setup required
Pro Version Available

Need more from this template?

The free version covers the basics. The Pro version goes further.

Free
  • Log up to 50 trades with ticker, entry, exit, and P&L
  • Dashboard with total P&L and win rate
  • Monthly trade count and net P&L summary
  • Works in Excel and Google Sheets
Pro
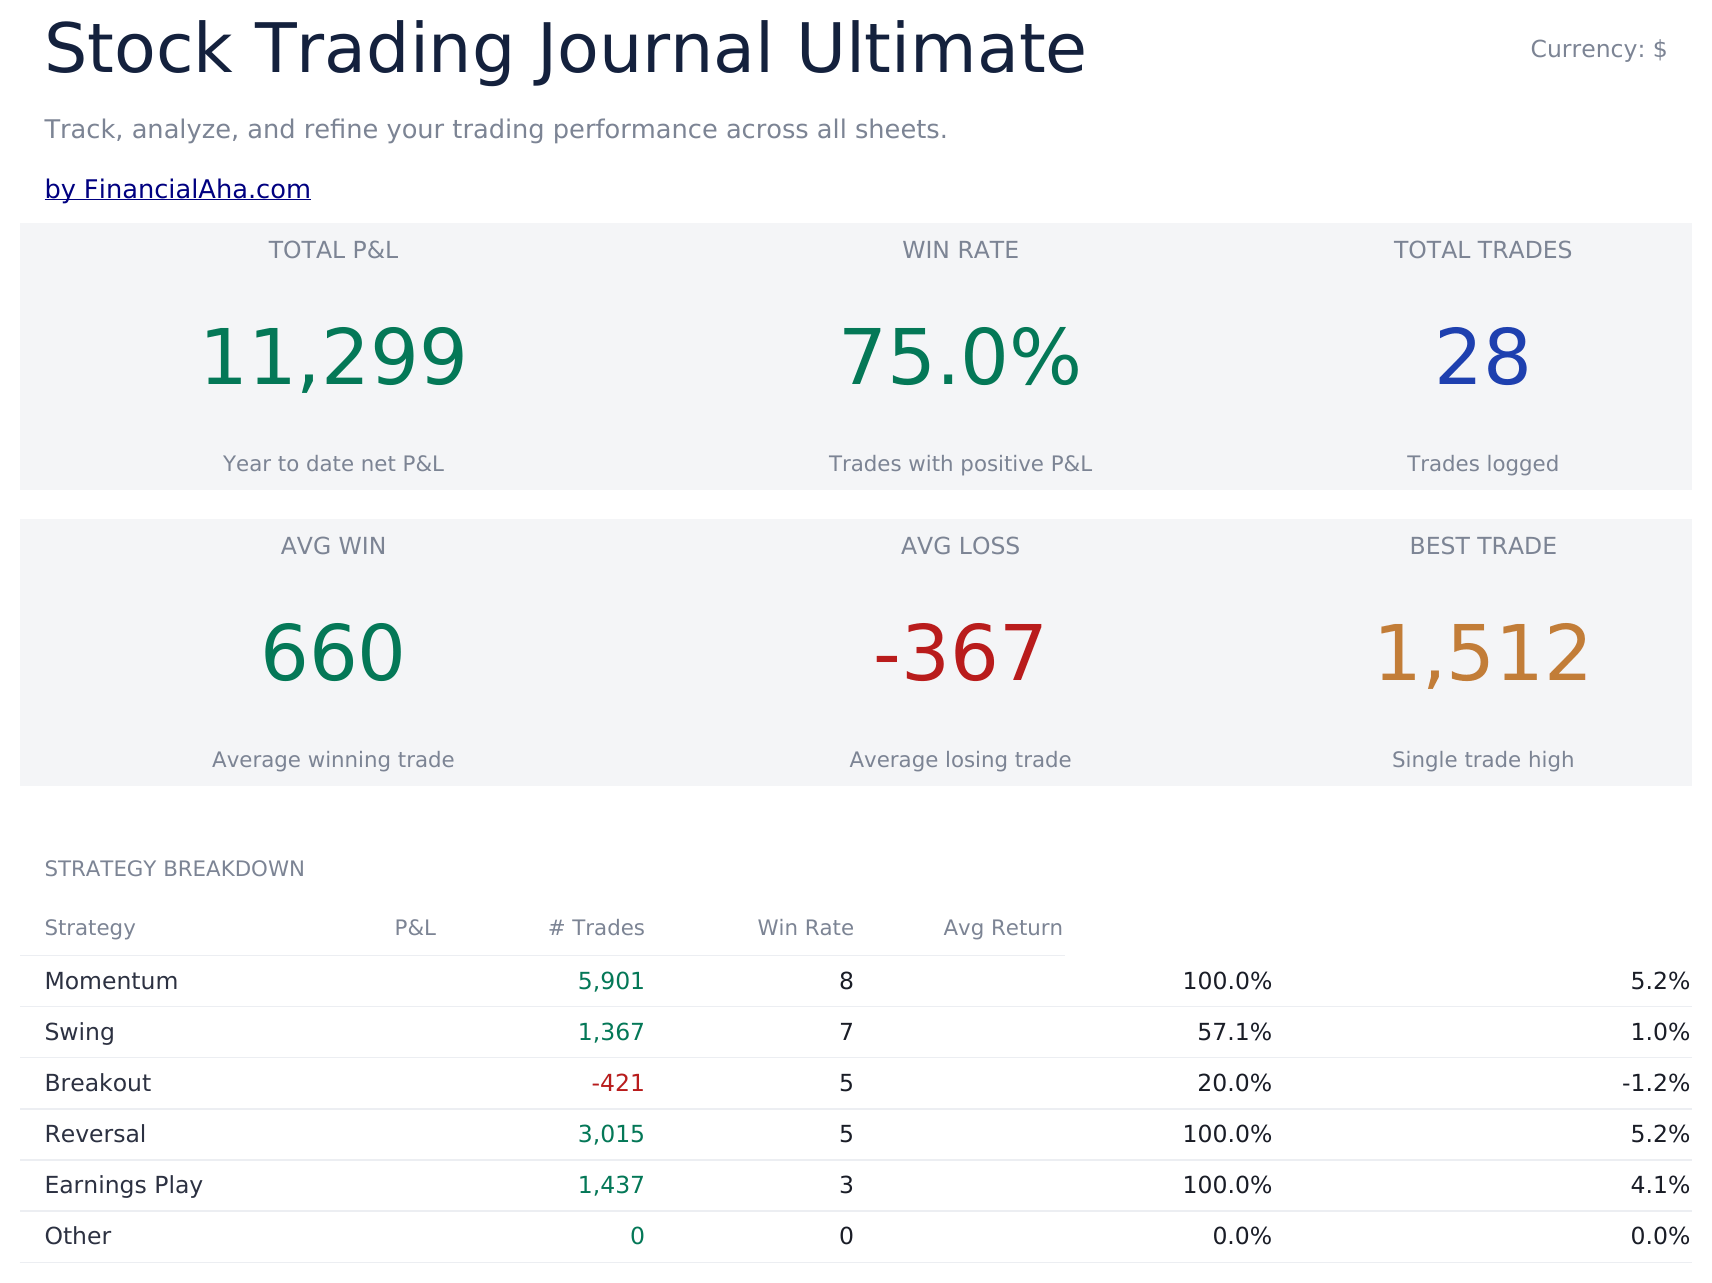
  • Log up to 200 trades with ticker, date, direction (Long/Short), shares, entry price, exit price, strategy, and notes
  • Dashboard with 6 KPI cards: total P&L, win rate, best trade, average win, average loss, and total trades
  • Performance Summary showing total trades, wins, losses, win rate, average gain, average loss, and largest win and loss by ticker
  • Monthly P&L sheet aggregating trades by month: total trades, wins, losses, gross profit, gross loss, and net P&L per month
  • Strategy Analysis breaking down performance by trading strategy: win rate, average P&L, net P&L, and trade count per strategy
See what's in the Pro version One-time purchase. No subscription.

How to Use This Stock Trading Journal Template

1

Log each trade

Enter the ticker, entry date, entry price, exit date, exit price, and number of shares for every completed trade.

2

Record your rationale

Add notes about why you entered and exited each position. This helps review decision patterns over time.

3

Review trade results

Profit or loss per trade calculates automatically from entry price, exit price, shares, and commissions.

4

Check performance metrics

The dashboard shows total trades, win rate, average gain, average loss, and cumulative P&L.

Built by Claude AI. Perfected by us.

We use Claude AI to draft each template, after a deep research. Then our team steps in. We refine the layout, stress-test every formula, fix edge cases, and polish the design until it feels like something we would actually use ourselves. The AI gets us 80% there. The last 20% is all human judgment.

Works in Excel and Google Sheets · CC BY 4.0

Frequently Asked Questions

Does it calculate win rate?

Yes. Win rate is the number of profitable trades divided by total trades. The dashboard updates after each new trade entry.

Can I track commissions?

Yes. Add commission costs per trade. They are subtracted from the profit or added to the loss for each position.

Does it support short selling?

Yes. For short trades, enter the short sale price as the entry and the cover price as the exit. The P&L calculation works correctly for both directions.

Can I see performance by ticker?

Filter or sort by ticker to see all trades in a single stock. This helps identify which tickers are most profitable.

How do I open this in Google Sheets?

Upload the .xlsx file to Google Drive, then open it with Google Sheets. All formulas and formatting will be preserved.

What license is this template under?

All free templates are released under CC BY 4.0 (Creative Commons Attribution). You can use, modify, and share them freely - including for commercial purposes - as long as you credit FinancialAha.com. They are provided as-is and do not constitute financial advice.

More Free Investing & Trading Templates

Looking for premium spreadsheet templates?

Our paid templates include advanced multi-sheet dashboards, native Excel charts, and ongoing updates.

Private & secure

Your financial data stays on your device. We never see it.

Learn more →

Need help?

Check our guides or reach out with questions.

View FAQ →