حاسبة الإيجار مقابل الشراء قالب Essentials
قارن النتائج المالية للإيجار مقابل الشراء خلال فترة زمنية محددة. ضع في الاعتبار الارتفاع في القيمة والآثار الضريبية وتكلفة الفرصة البديلة.
ماذا يتضمن
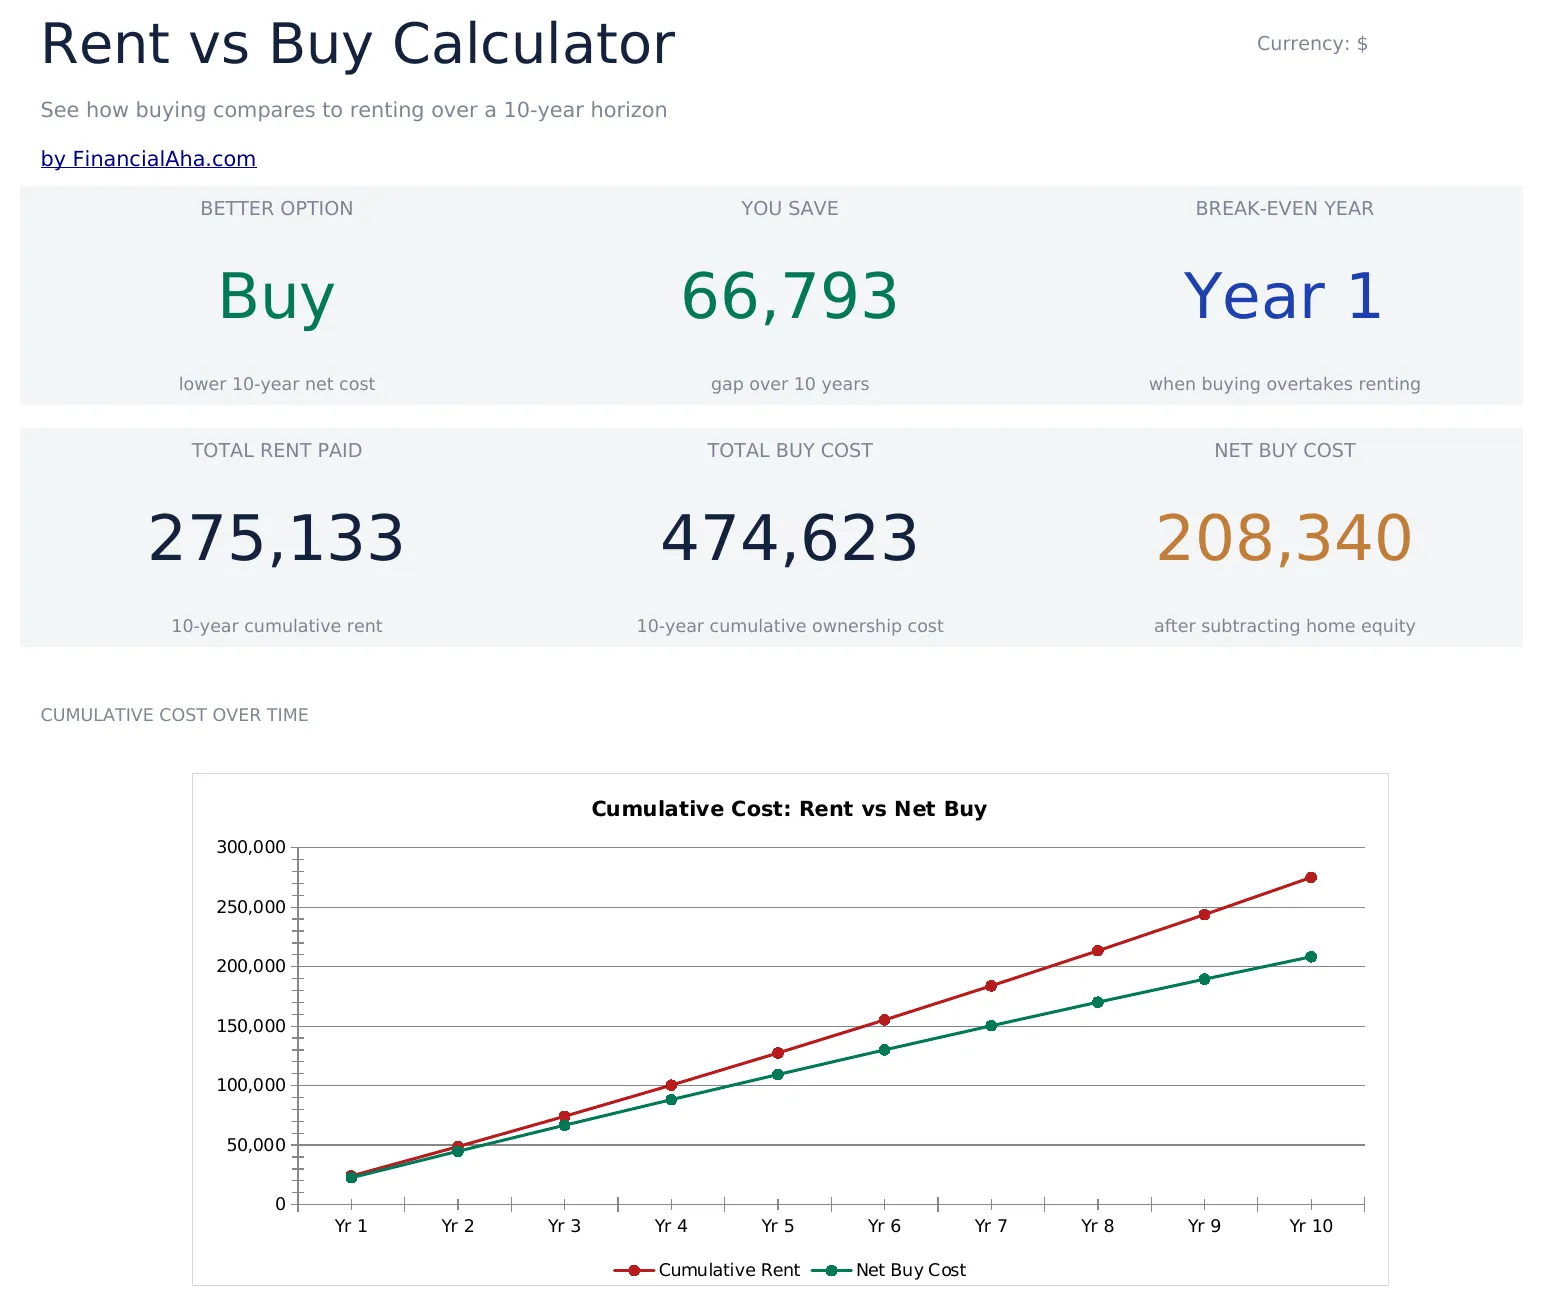
- لوحة متابعة بمقارنة الإيجار مقابل الشراء تعرض التكلفة الإجمالية للإيجار والتكلفة الإجمالية للشراء والفرق الصافي
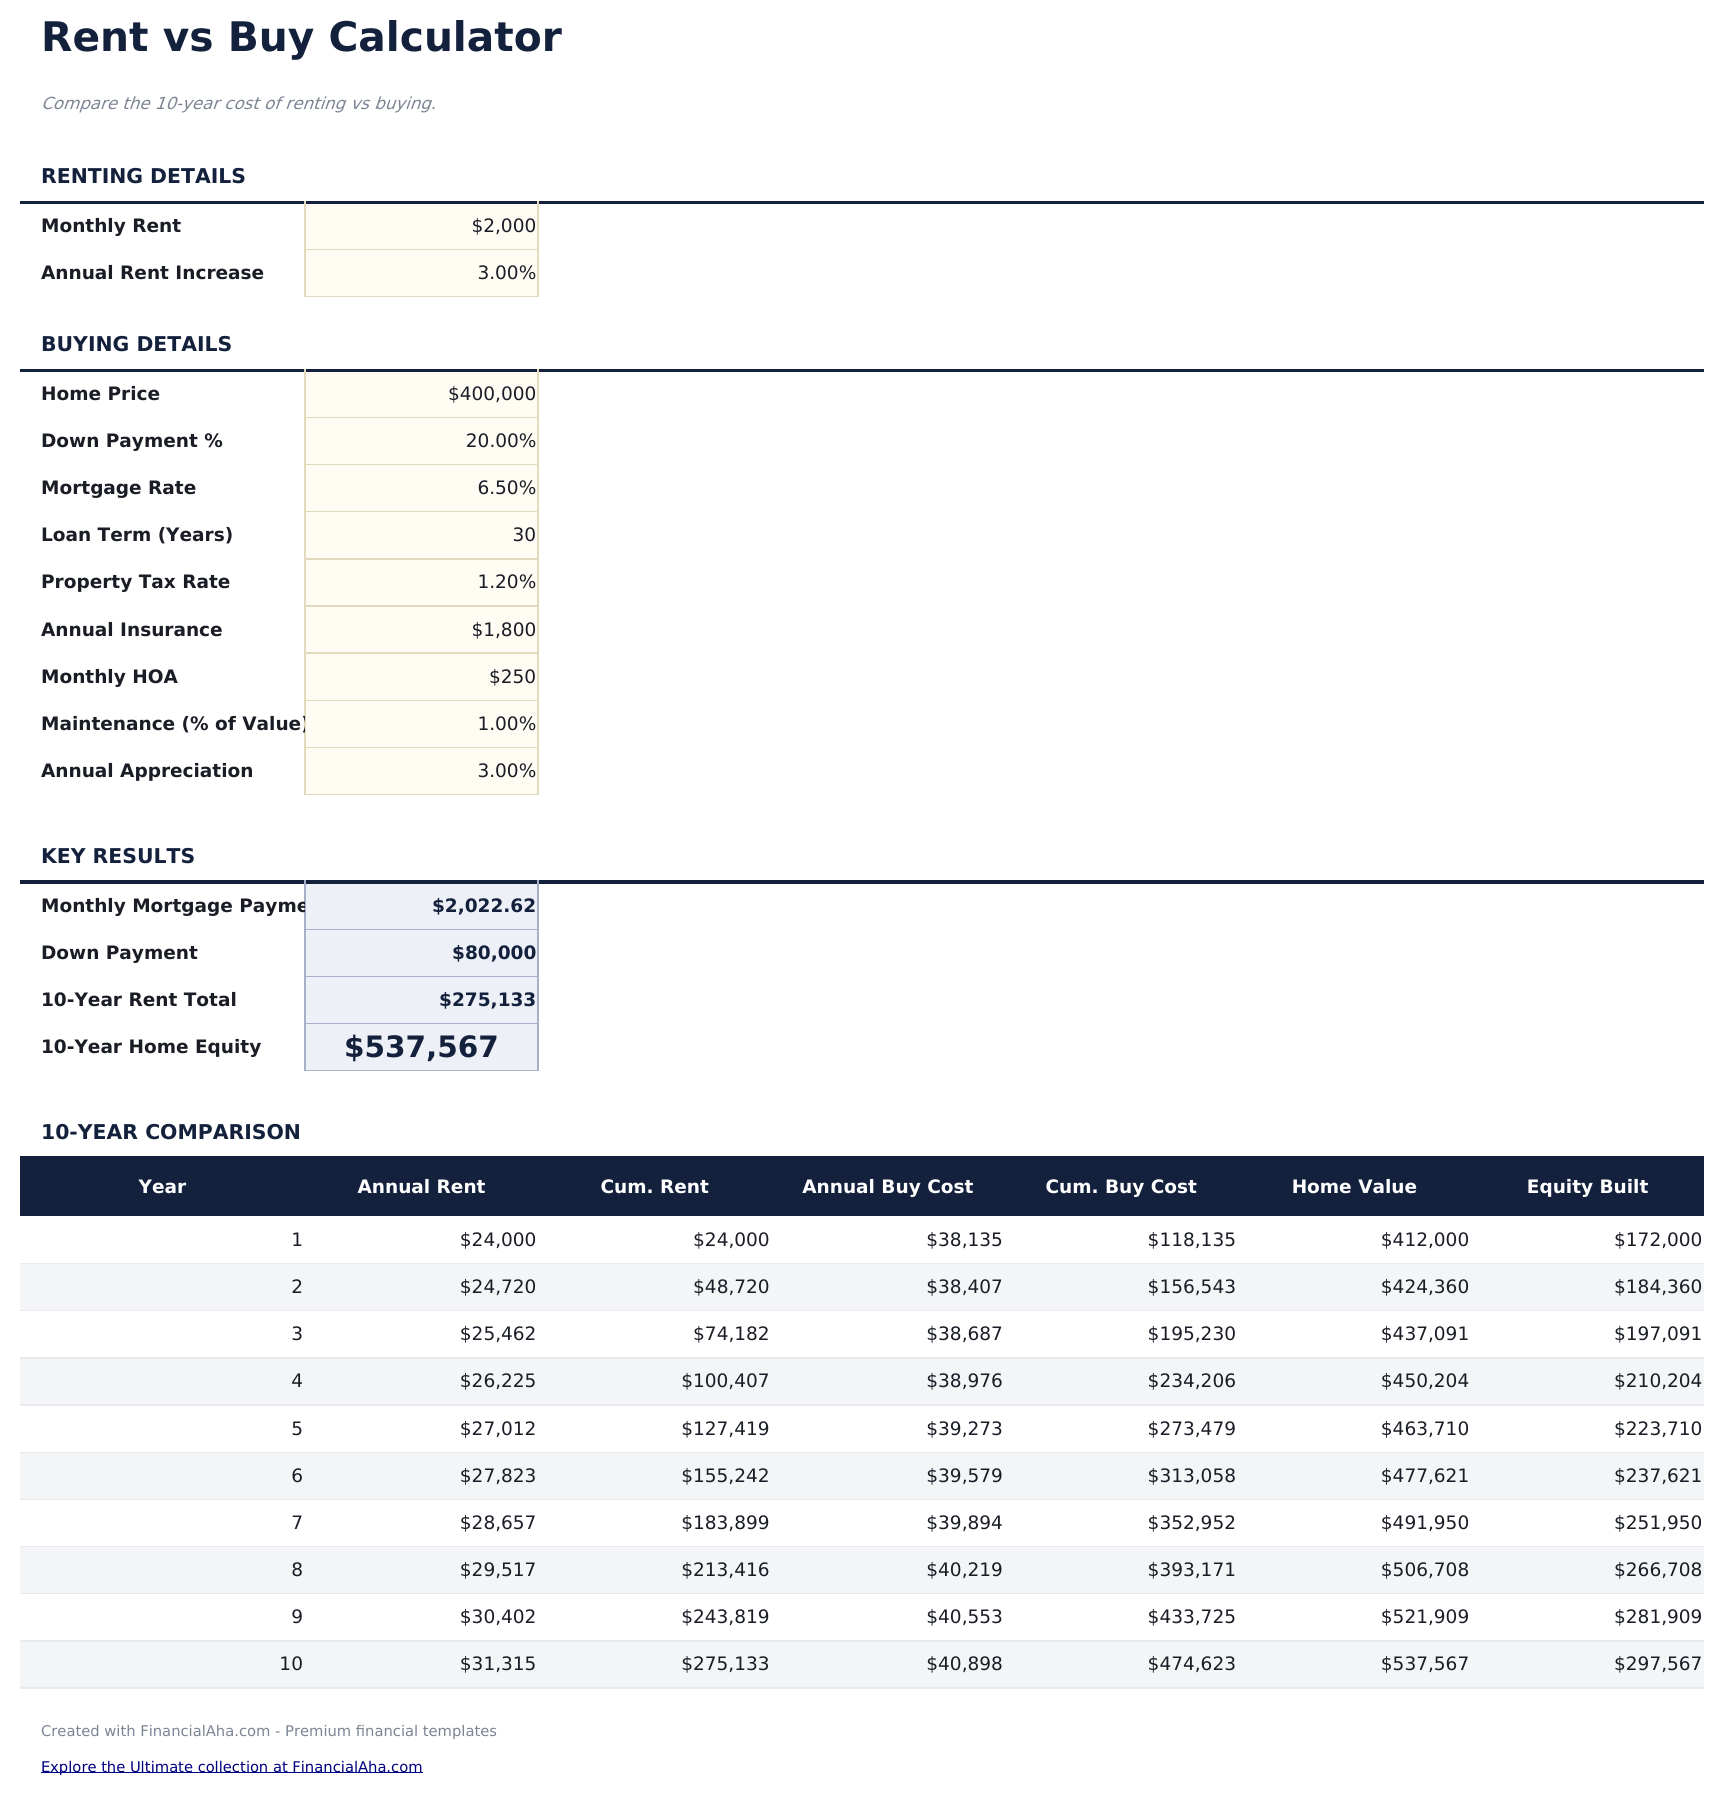
- حاسبة بمدخلات الإيجار (القسط الشهري والزيادة السنوية) ومدخلات الشراء (السعر والمعدل والدفعة الأولى)
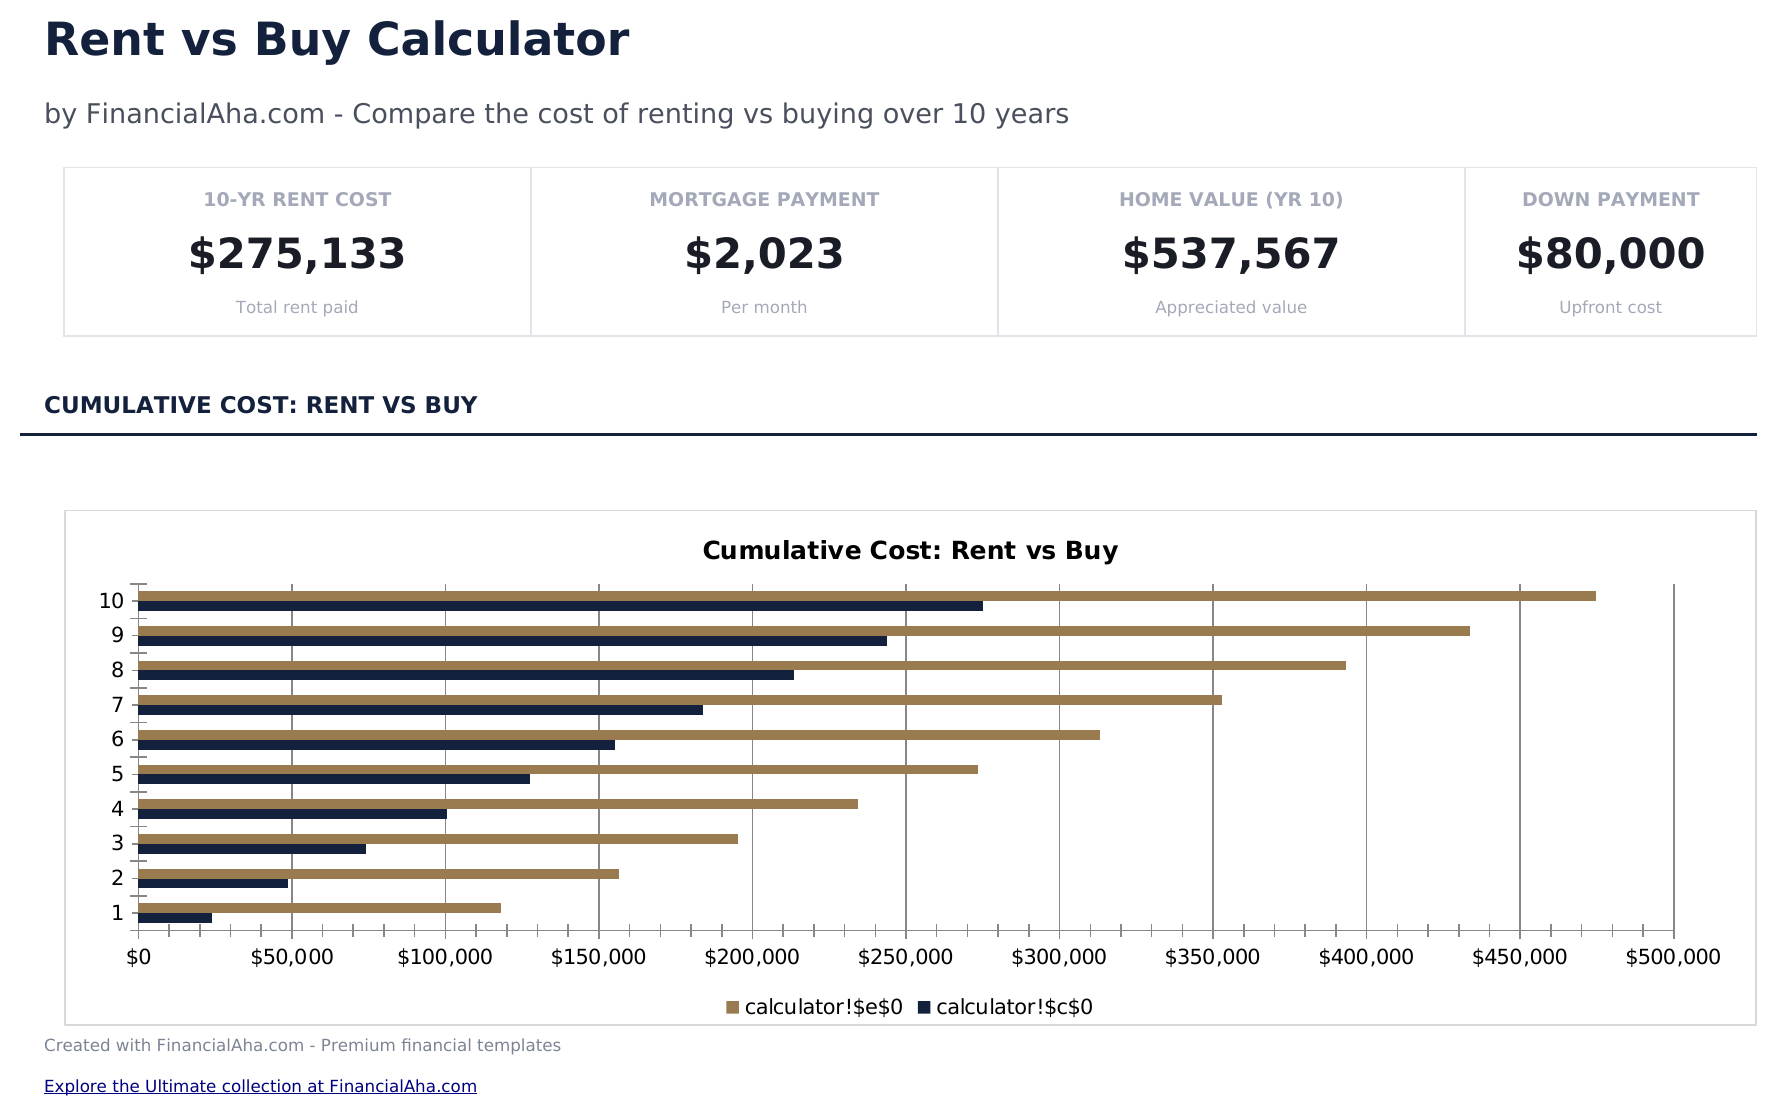
- جدول مقارنة التكلفة السنوية يعرض الإيجار التراكمي المدفوع مقابل تكاليف ملكية المنزل التراكمية بمرور الوقت
- تتبّع نمو حقوق الملكية يوضّح مقدار حقوق ملكية المنزل المكتسبة كل سنة من خلال سداد أصل دين الرهن
- تحليل التعادل مع خلايا إدخال ملوّنة يوضّح متى يصبح الشراء أقل تكلفة من الإيجار
- يعمل في Microsoft Excel وGoogle Sheets وLibreOffice Calc دون الحاجة لأي إعداد
Need more from this template?
The Essentials version covers everyday tracking. Ultimate goes further with multi-entity support, scenario analysis, and ultimate-grade reporting.
- لوحة متابعة بمقارنة الإيجار مقابل الشراء تعرض التكلفة الإجمالية للإيجار والتكلفة الإجمالية للشراء والفرق الصافي
- حاسبة بمدخلات الإيجار (القسط الشهري والزيادة السنوية) ومدخلات الشراء (السعر والمعدل والدفعة الأولى)
- جدول مقارنة التكلفة السنوية يعرض الإيجار التراكمي المدفوع مقابل تكاليف ملكية المنزل التراكمية بمرور الوقت
- تتبّع نمو حقوق الملكية يوضّح مقدار حقوق ملكية المنزل المكتسبة كل سنة من خلال سداد أصل دين الرهن
- ورقة افتراضات شاملة تغطي سعر الشراء والدفعة الأولى ومعدل الرهن ومعدل ضريبة العقار ورسوم الخدمة والصيانة وارتفاع قيمة العقار والإيجار ونمو الإيجار وعائد الاستثمار
- لوحة معلومات مع 6 بطاقات KPI: سنة التعادل وتكلفة الشراء لـ 10 سنوات وتكلفة الإيجار لـ 10 سنوات وصافي ميزة الشراء والقسط الشهري مقابل الإيجار والدفعة الأولى المطلوبة
- جدول مقارنة سنوي يعرض التكاليف التراكمية للشراء مقابل الإيجار على 10 سنوات مع الفرق الصافي لكل سنة
- تحليل نقطة التعادل يحدد السنة الدقيقة التي يصبح فيها الشراء أرخص من الإيجار على أساس تراكمي
- شبكة تحليل الحساسية تعرض سنة التعادل عند 5 معدلات ارتفاع قيمة متقاطعة مع 5 معدلات رهن (25 تركيبة)
معاينة
اطلع على محتويات هذا القالب
كيفية استخدام قالب حاسبة الإيجار مقابل الشراء هذا
أدخل تفاصيل الإيجار
أدخل الإيجار الشهري الحالي ونسبة الزيادة السنوية المتوقعة لفترة المقارنة.
أدخل تفاصيل الشراء
أضف سعر المنزل والدفعة الأولى ومعدل الرهن العقاري وضرائب العقار والتأمين وتقديرات الصيانة.
حدد الأفق الزمني
أدخل عدد السنوات للمقارنة. تتغيّر النتائج بشكل كبير حسب فترات الاحتفاظ المختلفة.
قارن النتائج
تعرض لوحة المتابعة التكلفة الإجمالية للإيجار مقابل التكلفة الإجمالية للشراء وحقوق الملكية المتراكمة وسنة التعادل.
Customer Reviews
What Our Customers Say
"If I get half as good at handling my finances as you are at customer service, this'll be the best $26 I've spent lately."
"Great tool! Simplifies financial planning without the hassle of complex spreadsheets."
"I recently purchased your super convenient spreadsheet, it really helps me!"
"They're great and super intuitive. Thank you!"
صُممت بواسطة Claude AI. أتقنّاها نحن.
نستخدم Claude AI لصياغة كل قالب بعد بحث معمّق. ثم يتدخل فريقنا. نحسّن التصميم، ونختبر كل صيغة، ونعالج الحالات الاستثنائية، وننقّح التصميم حتى يصبح شيئاً نستخدمه نحن فعلاً. الذكاء الاصطناعي يوصلنا إلى 80%. الـ 20% المتبقية هي حكم بشري بالكامل.
الأسئلة الشائعة
ما التكاليف المشمولة في جانب الشراء؟
أقساط الرهن العقاري وضرائب العقار والتأمين والصيانة ورسوم جمعية الملاك وتكلفة الفرصة البديلة للدفعة الأولى. تُحسب حقوق الملكية المتراكمة كرصيد.
هل يأخذ ارتفاع قيمة المنزل في الاعتبار؟
نعم. أدخل معدل ارتفاع سنوي متوقع. تأخذ الحاسبة في الاعتبار نمو قيمة العقار عند حساب التكلفة الصافية للشراء.
ما هي تكلفة الفرصة البديلة للدفعة الأولى؟
لو استُثمرت الدفعة الأولى بدلاً من استخدامها لشراء منزل، لحققت عوائد. تأخذ الحاسبة في الاعتبار نمو الاستثمار المفقود هذا.
متى يتعادل الشراء عادةً؟
يتفاوت كثيراً حسب السوق والمدخلات. يوضّح تحليل التعادل السنة المحددة التي تصبح فيها تكاليف الشراء التراكمية أقل من تكاليف الإيجار التراكمية لسيناريوك.
كيف أفتح هذا في Google Sheets؟
ارفع ملف .xlsx إلى Google Drive، ثم افتحه باستخدام Google Sheets. جميع الصيغ والتنسيقات ستبقى محفوظة.
المزيد من قوالب Essentials في الرهن العقاري والمنزل
أبرز النقاط:
تبحث عن قوالب جداول بيانات احترافية؟
القوالب المدفوعة تشمل لوحات معلومات متعددة الأوراق متقدمة، ورسوم بيانية أصلية في Excel، وتحديثات مستمرة.
احصل على كل قالب Ultimate بدلاً من ذلك
جميع الـ 58 قالب Ultimate في عملية شراء واحدة مقابل $299 - بقيمة $1,102، توفر $803.