Mieten-vs-Kaufen-Rechner Essentials-Vorlage
Vergleichen Sie die finanziellen Ergebnisse von Mieten und Kaufen ueber einen bestimmten Zeitraum. Beruecksichtigen Sie Wertsteigerung, steuerliche Auswirkungen und Opportunitaetskosten.
Was enthalten ist
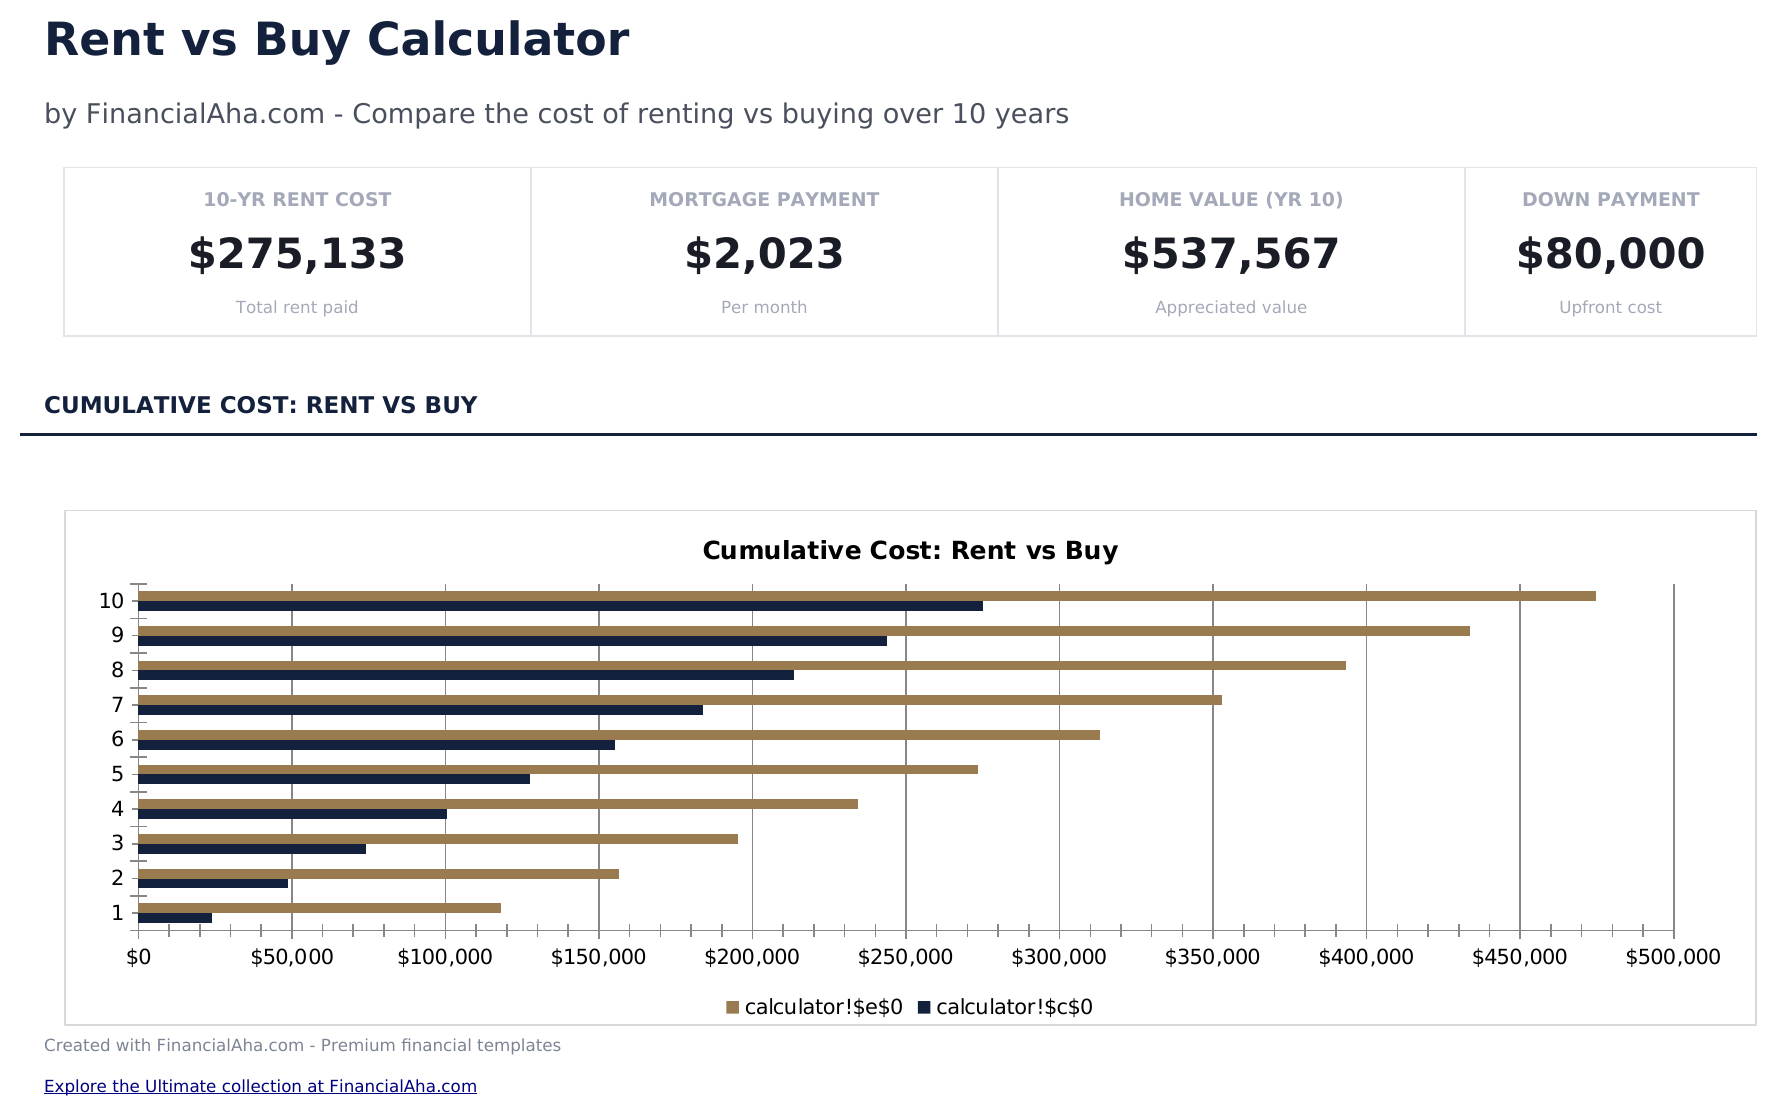
- Dashboard mit Mieten-vs-Kaufen-Vergleich, das Gesamtkosten des Mietens, Gesamtkosten des Kaufens und Nettodifferenz zeigt
- Rechner mit Mieteingaben (monatliche Miete, jaehrliche Erhoehung) und Kaufeingaben (Preis, Zinssatz, Anzahlung)
- Jahresweise Kostenvergleichstabelle mit kumulierter Miete vs. kumulierten Eigentumskosten ueber die Zeit
- Eigenkapitalaufbau-Verfolgung, die zeigt, wie viel Eigenkapital jedes Jahr durch Hypothekentilgung aufgebaut wird
- Break-even-Analyse mit farbcodierten Eingabezellen, die zeigt, wann Kaufen guenstiger wird als Mieten
- Funktioniert in Microsoft Excel, Google Sheets und LibreOffice Calc ohne Einrichtung
Need more from this template?
The Essentials version covers everyday tracking. Ultimate goes further with multi-entity support, scenario analysis, and ultimate-grade reporting.
- Dashboard mit Mieten-vs-Kaufen-Vergleich, das Gesamtkosten des Mietens, Gesamtkosten des Kaufens und Nettodifferenz zeigt
- Rechner mit Mieteingaben (monatliche Miete, jaehrliche Erhoehung) und Kaufeingaben (Preis, Zinssatz, Anzahlung)
- Jahresweise Kostenvergleichstabelle mit kumulierter Miete vs. kumulierten Eigentumskosten ueber die Zeit
- Eigenkapitalaufbau-Verfolgung, die zeigt, wie viel Eigenkapital jedes Jahr durch Hypothekentilgung aufgebaut wird
- Umfassendes Annahmenblatt mit Kaufpreis, Anzahlung, Hypothekenzins, Grundsteuerrate, Hausgeld, Instandhaltung, Wertsteigerung, Miete, Mietsteigerung und Investitionsrendite
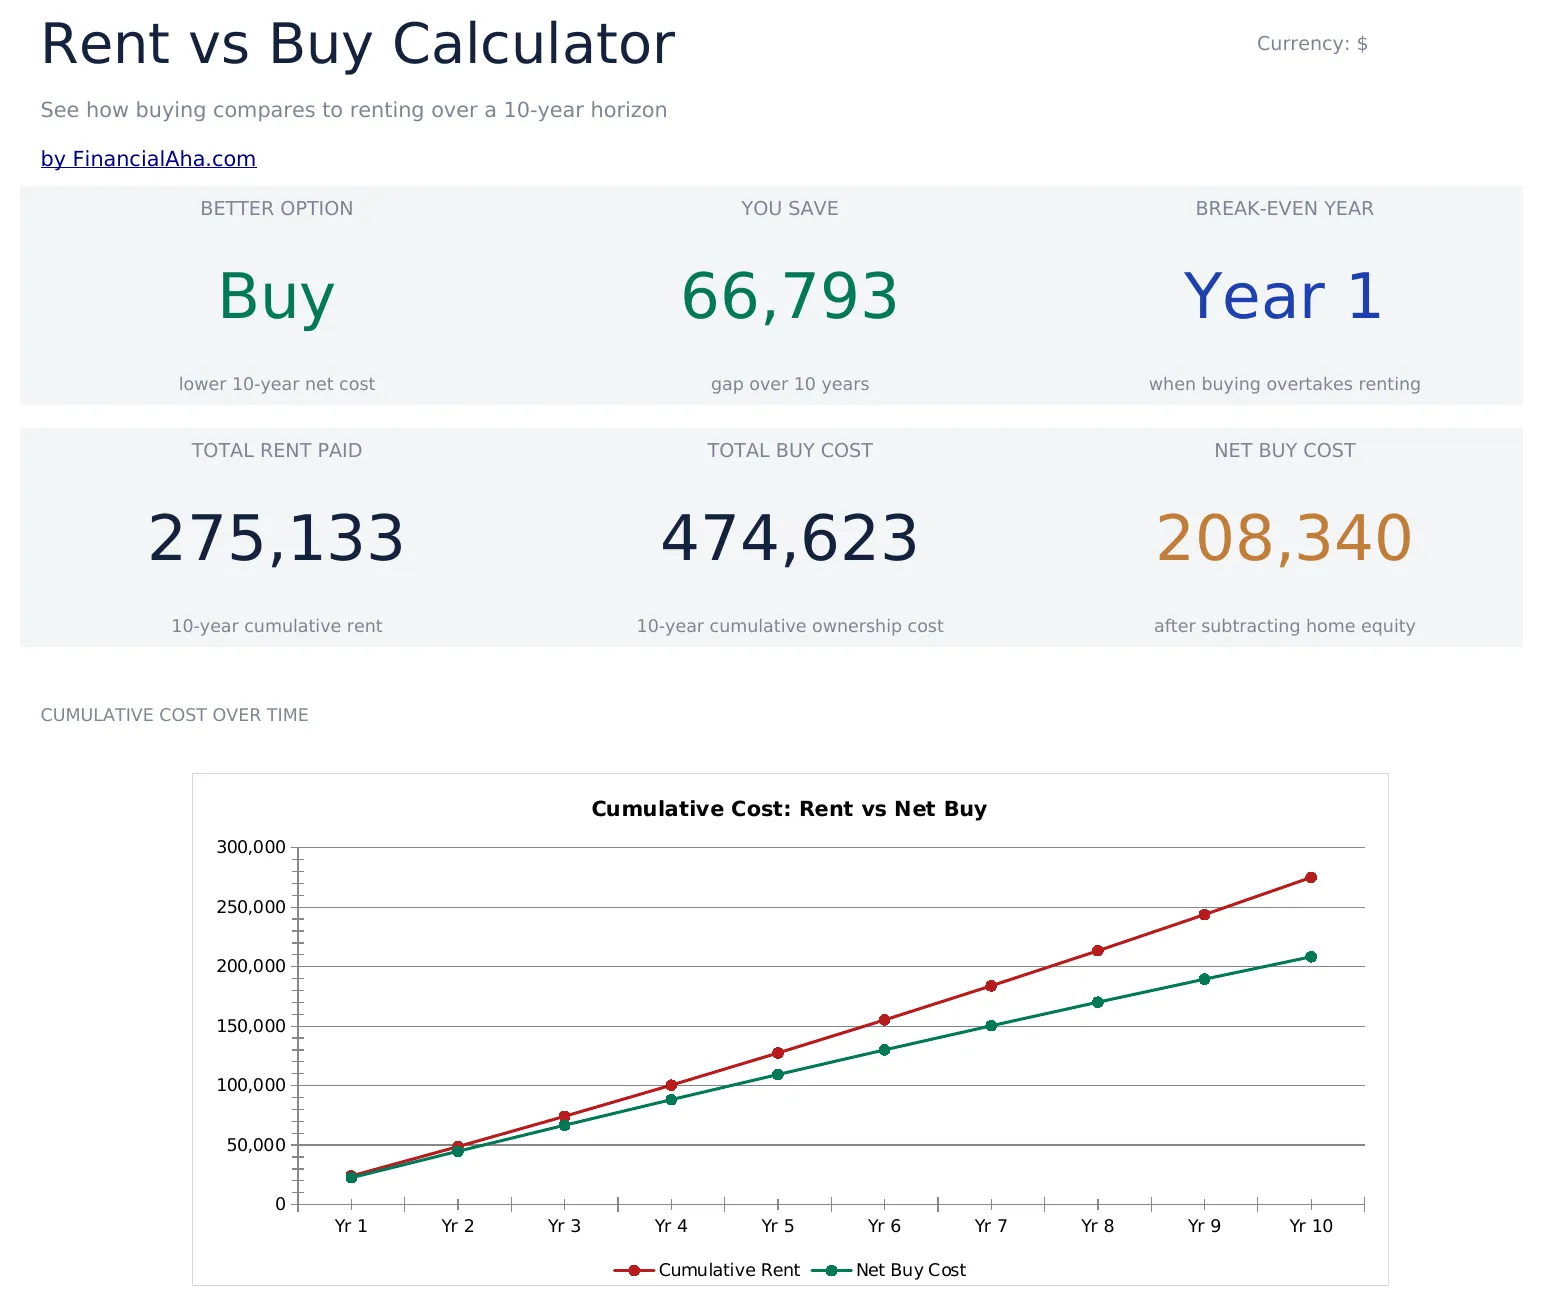
- Dashboard mit 6 KPI-Karten: Break-even-Jahr, 10-Jahres-Kaufkosten, 10-Jahres-Mietkosten, Netto-Kaufvorteil, Monatsrate vs. Miete und erforderliche Anzahlung
- Jahresvergleichstabelle mit kumulierten Kosten für Kaufen vs. Mieten über 10 Jahre mit Nettodifferenz pro Jahr
- Break-even-Analyse identifiziert das genaue Jahr, in dem Kaufen auf kumulativer Basis günstiger wird als Mieten
- Sensitivitätsanalyse-Raster zeigt das Break-even-Jahr bei 5 Wertsteigerungsraten gekreuzt mit 5 Hypothekenzinsen (25 Kombinationen)
Vorschau
Sehen Sie, was in dieser Vorlage enthalten ist
So verwenden Sie diese Mieten-vs-Kaufen-Rechner-Vorlage
Mietdetails eingeben
Geben Sie die aktuelle Monatsmiete und die erwartete jaehrliche Mieterhöhung in Prozent fuer den Vergleichszeitraum ein.
Kaufdetails eingeben
Fuegen Sie Immobilienpreis, Anzahlung, Hypothekenzins, Grundsteuern, Versicherung und Instandhaltungsschaetzungen hinzu.
Zeithorizont festlegen
Geben Sie die Anzahl der Vergleichsjahre ein. Ergebnisse aendern sich erheblich bei verschiedenen Haltedauern.
Ergebnisse vergleichen
Das Dashboard zeigt Gesamtkosten des Mietens vs. Gesamtkosten des Kaufens, aufgebautes Eigenkapital und das Break-even-Jahr.
Customer Reviews
What Our Customers Say
"If I get half as good at handling my finances as you are at customer service, this'll be the best $26 I've spent lately."
"Great tool! Simplifies financial planning without the hassle of complex spreadsheets."
"I recently purchased your super convenient spreadsheet, it really helps me!"
"They're great and super intuitive. Thank you!"
Erstellt von Claude AI. Verfeinert von uns.
Wir verwenden Claude AI, um jede Vorlage nach gründlicher Recherche zu entwerfen. Dann greift unser Team ein. Wir verfeinern das Layout, testen jede Formel auf Herz und Nieren, beheben Grenzfälle und polieren das Design, bis es sich anfühlt wie etwas, das wir selbst verwenden würden. Die KI bringt uns 80 % ans Ziel. Die letzten 20 % sind rein menschliches Urteilsvermögen.
Häufig gestellte Fragen
Welche Kosten sind auf der Kaufseite enthalten?
Hypothekenraten, Grundsteuern, Versicherung, Instandhaltung, HOA-Gebuehren und Opportunitaetskosten der Anzahlung. Eigenkapitalaufbau wird als Gutschrift beruecksichtigt.
Wird die Wertsteigerung der Immobilie beruecksichtigt?
Ja. Geben Sie eine erwartete jaehrliche Wertsteigerungsrate ein. Der Rechner beruecksichtigt das Immobilienwertwachstum bei der Berechnung der Netto-Kaufkosten.
Was sind Opportunitaetskosten der Anzahlung?
Wenn die Anzahlung stattdessen investiert wuerde, wuerde sie Renditen erzielen. Der Rechner beruecksichtigt dieses entgangene Anlagenwachstum.
Wann erreicht Kaufen typischerweise den Break-even?
Das variiert stark je nach Markt und Eingaben. Die Break-even-Analyse zeigt das spezifische Jahr, in dem die kumulierten Kaufkosten fuer Ihr Szenario niedriger werden als die kumulierten Mietkosten.
Wie öffne ich diese Vorlage in Google Sheets?
Laden Sie die .xlsx-Datei auf Google Drive hoch und öffnen Sie sie mit Google Sheets. Alle Formeln und Formatierungen bleiben erhalten.
Weitere Essentials-Vorlagen: Hypothek & Immobilien
Highlights:
Auf der Suche nach Premium-Tabellenvorlagen?
Unsere kostenpflichtigen Vorlagen umfassen erweiterte mehrseitige Dashboards, native Excel-Diagramme und laufende Aktualisierungen.
Holen Sie sich stattdessen jede Ultimate-Vorlage
Alle 58 Ultimate-Vorlagen in einem Kauf für $299 - $1,102 Wert, Sie behalten $803.