Calculateur location vs achat Modèle Essentials
Comparez les résultats financiers de la location par rapport à l'achat sur une période spécifiée. Tenez compte de l'appréciation, des implications fiscales et du coût d'opportunité.
Ce qui est inclus
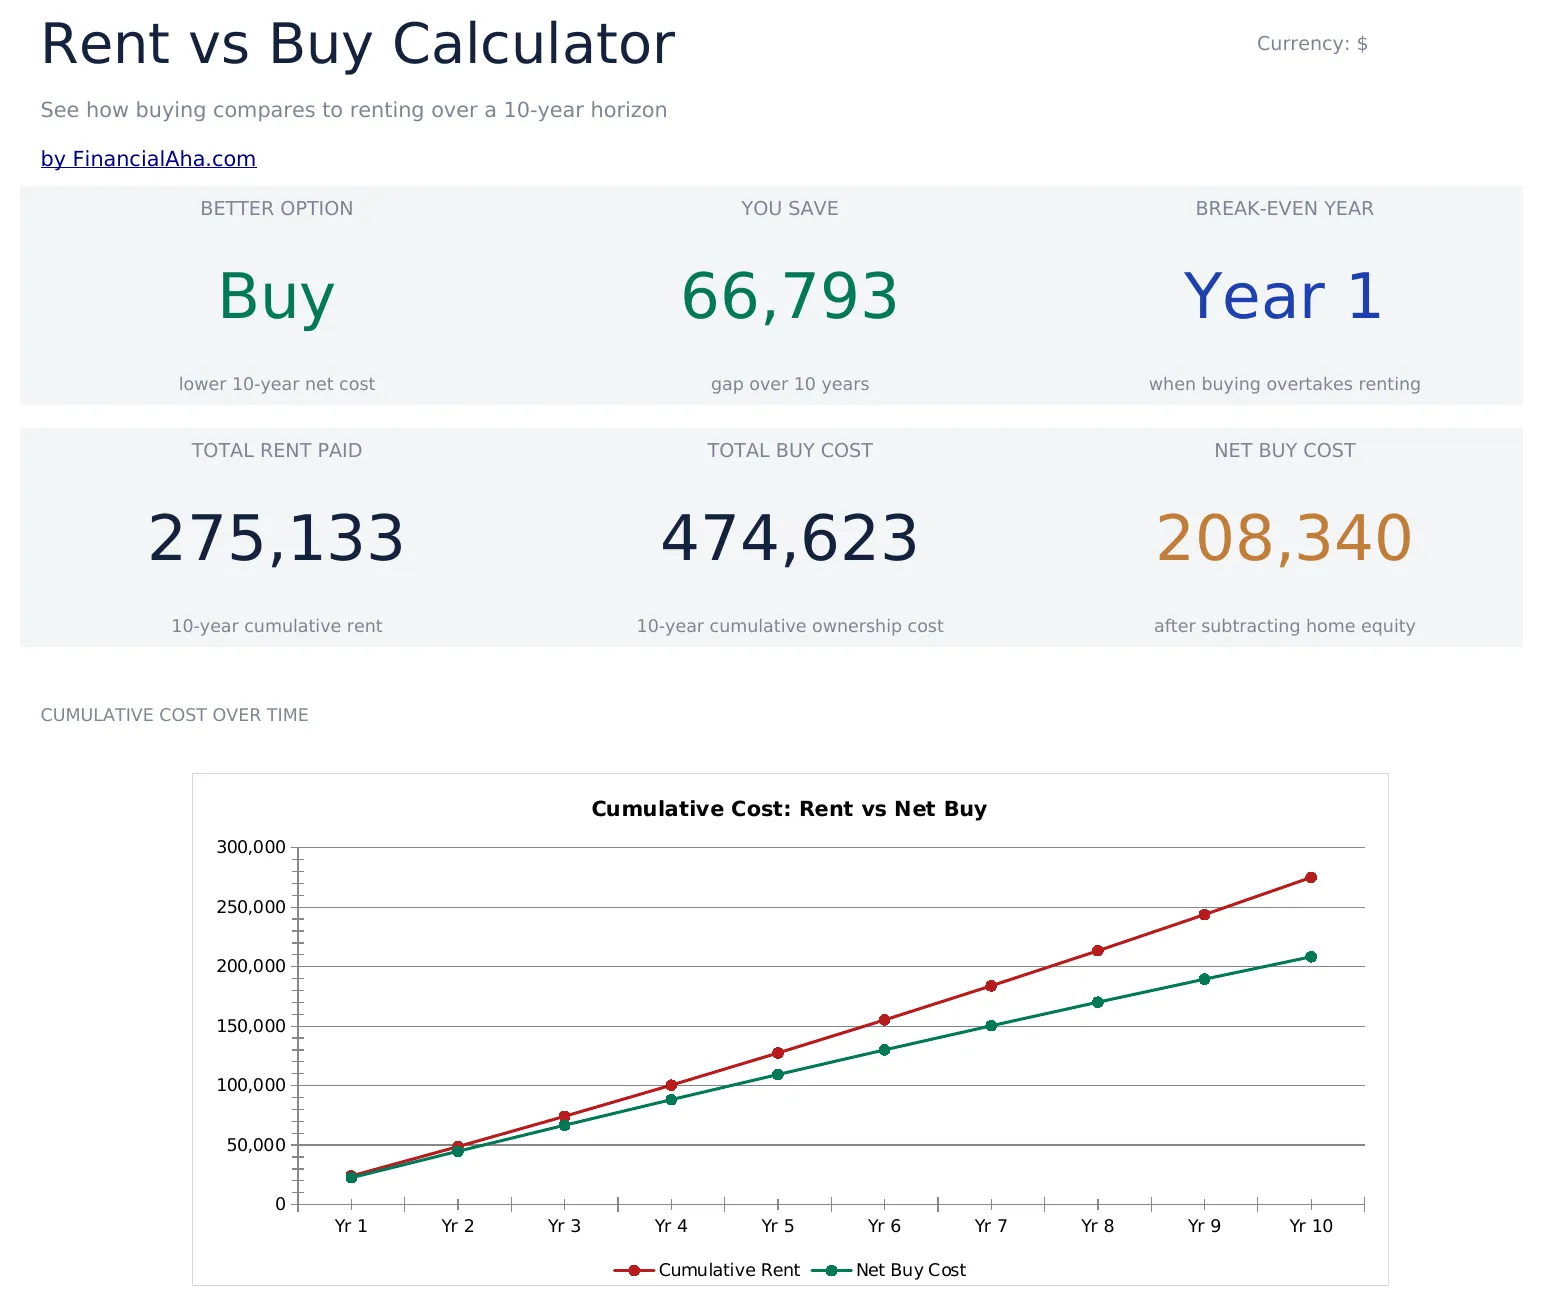
- Tableau de bord avec comparaison location vs achat montrant le coût total de la location, le coût total de l'achat et la différence nette
- Calculateur avec des entrées de location (loyer mensuel, augmentation annuelle) et des entrées d'achat (prix, taux, apport)
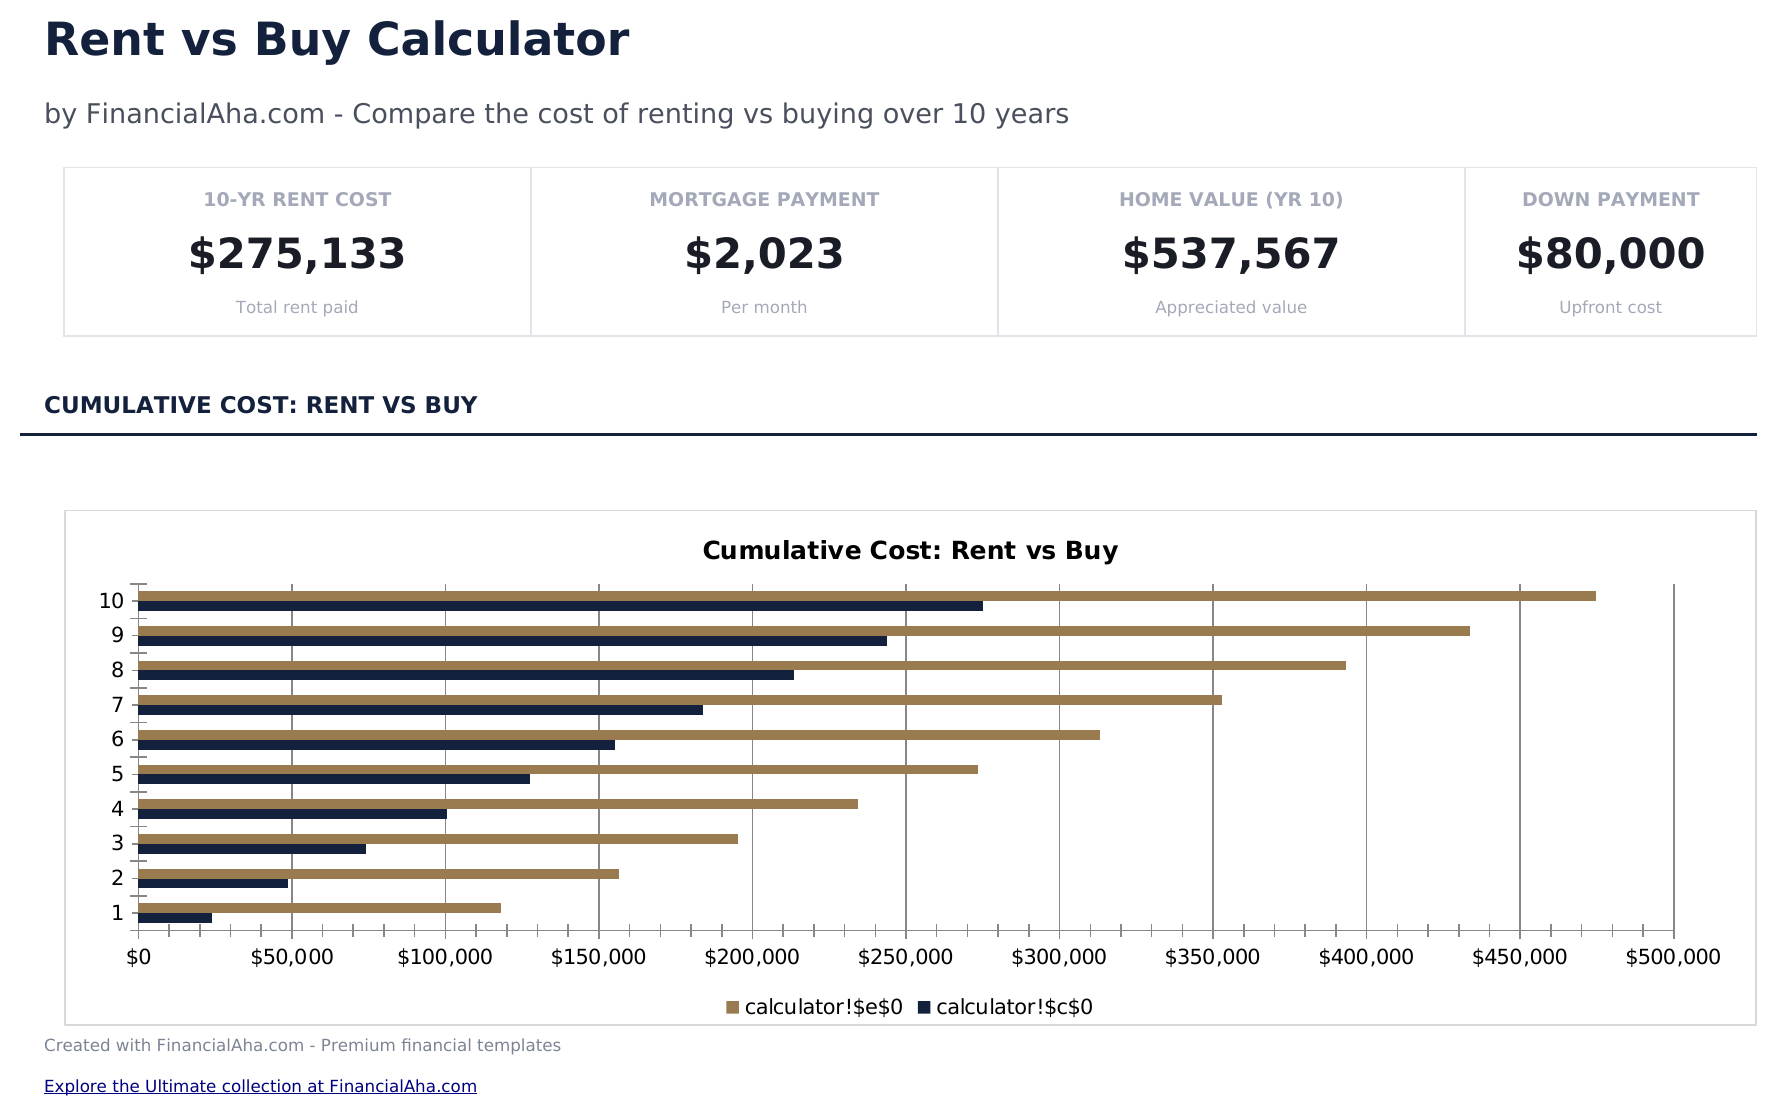
- Tableau de comparaison des coûts année par année montrant le loyer cumulé payé vs les coûts de propriété cumulés au fil du temps
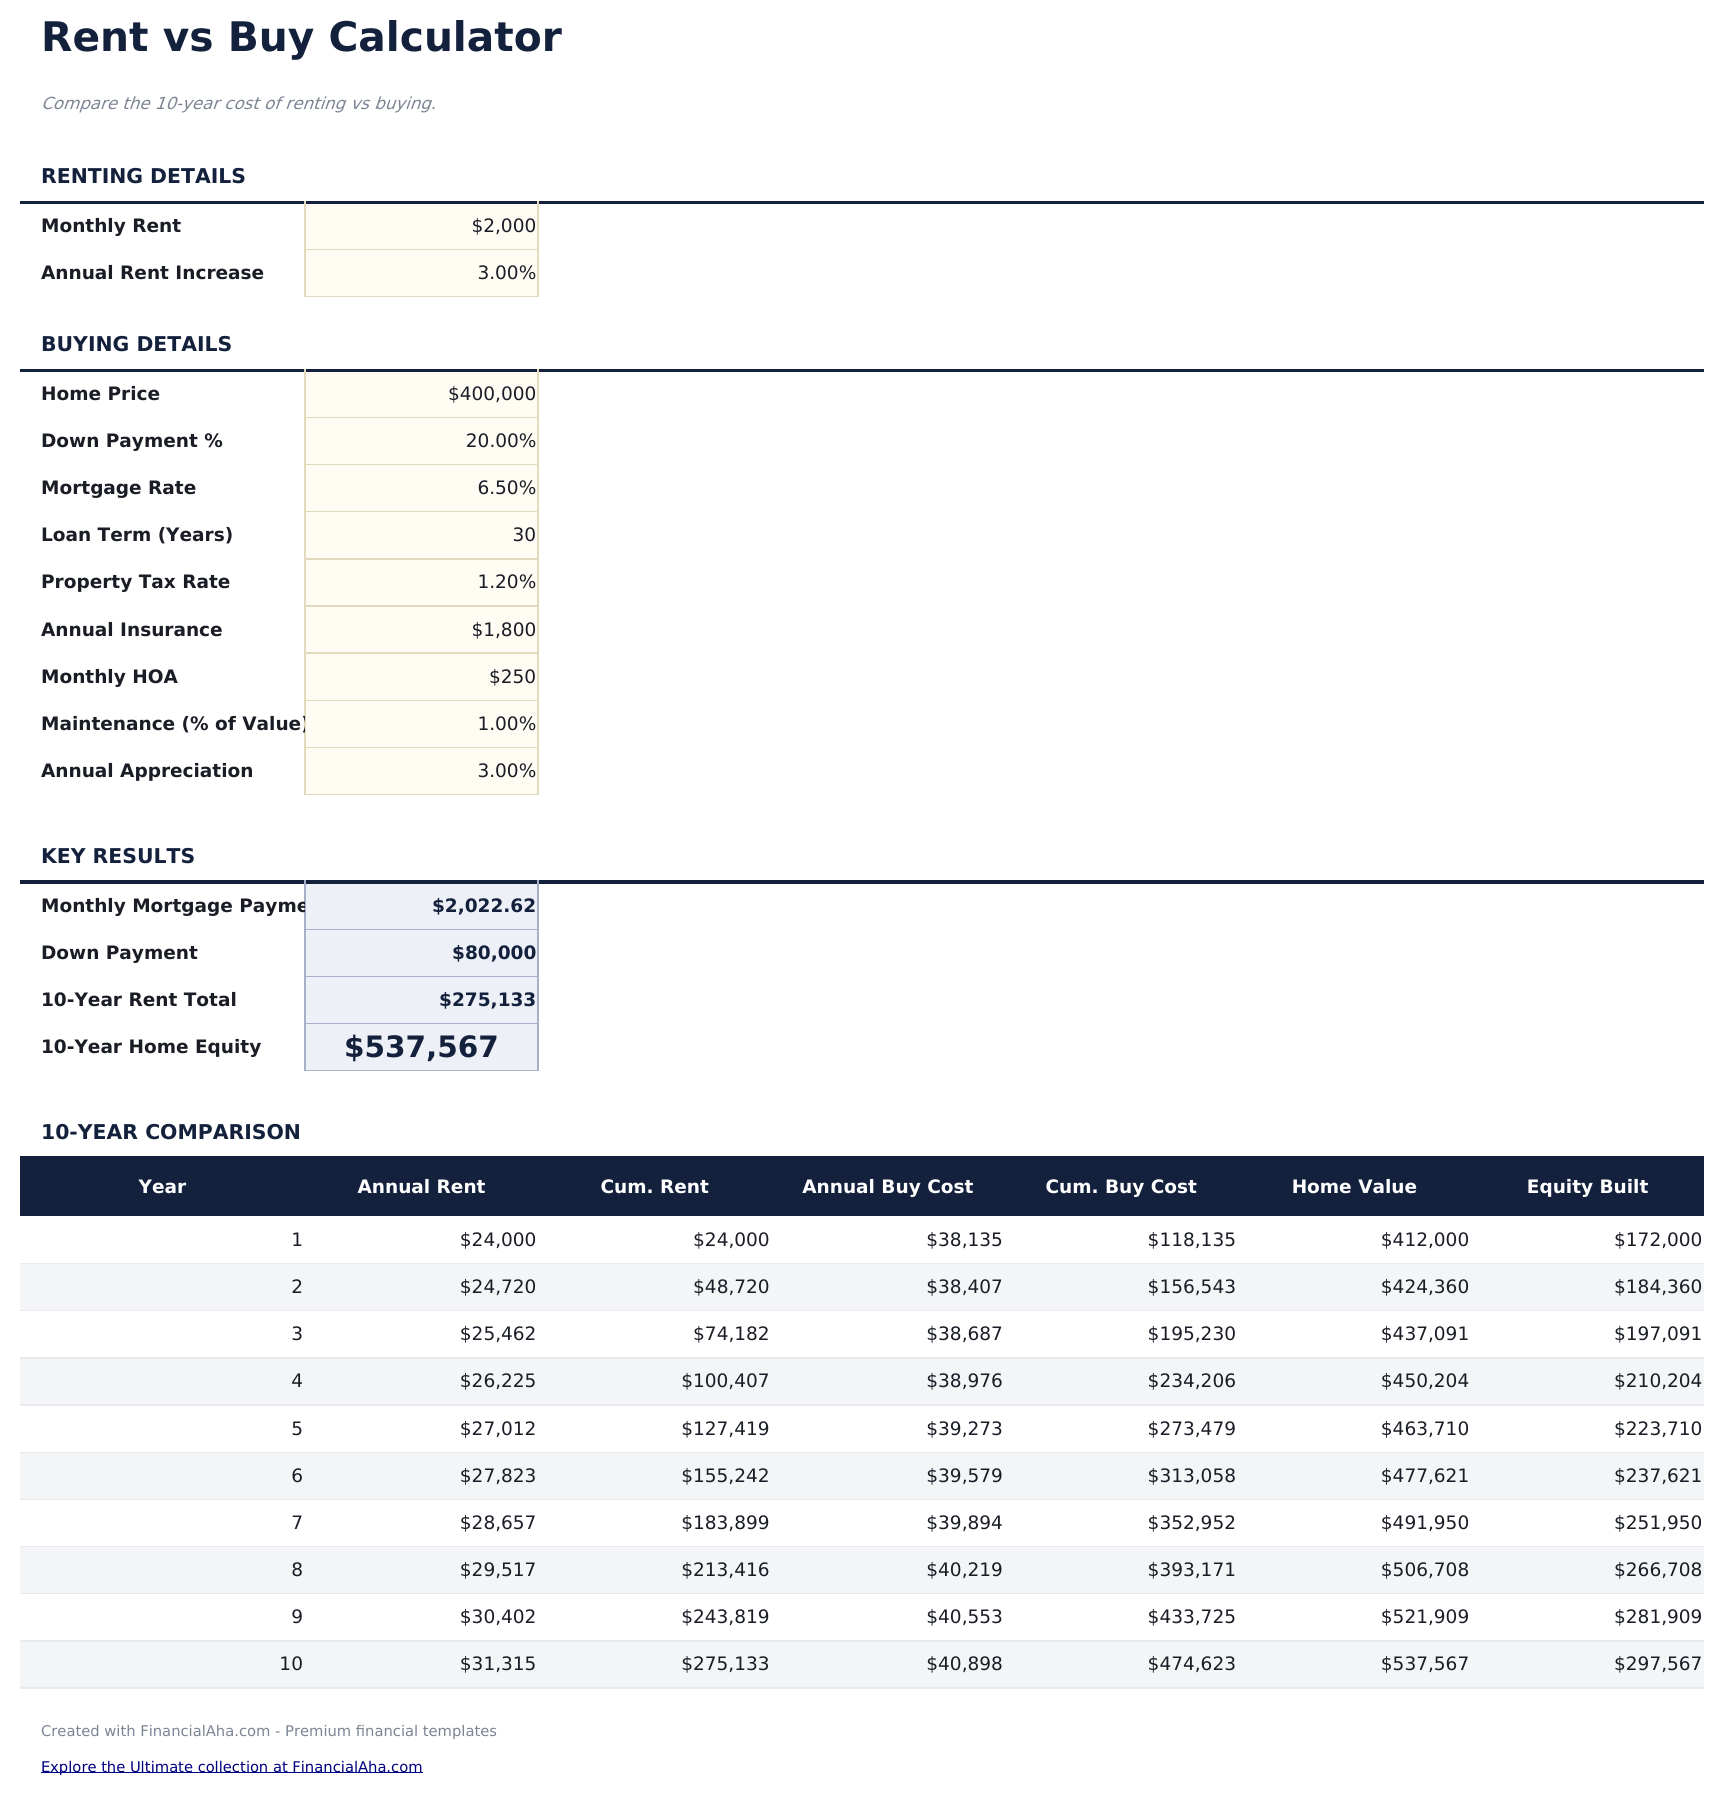
- Suivi de la constitution de valeur nette montrant combien de valeur nette immobilière est gagnée chaque année via les paiements de capital hypothécaire
- Analyse de rentabilité avec des cellules de saisie codées par couleur montrant quand l'achat devient moins cher que la location
- Fonctionne dans Microsoft Excel, Google Sheets et LibreOffice Calc sans aucune configuration requise
Need more from this template?
The Essentials version covers everyday tracking. Ultimate goes further with multi-entity support, scenario analysis, and ultimate-grade reporting.
- Tableau de bord avec comparaison location vs achat montrant le coût total de la location, le coût total de l'achat et la différence nette
- Calculateur avec des entrées de location (loyer mensuel, augmentation annuelle) et des entrées d'achat (prix, taux, apport)
- Tableau de comparaison des coûts année par année montrant le loyer cumulé payé vs les coûts de propriété cumulés au fil du temps
- Suivi de la constitution de valeur nette montrant combien de valeur nette immobilière est gagnée chaque année via les paiements de capital hypothécaire
- Feuille d'hypothèses complète couvrant prix d'achat, apport, taux hypothécaire, taux d'imposition foncière, charges de copropriété, entretien, appréciation du bien, loyer, augmentation du loyer et rendement des investissements
- Tableau de bord avec 6 indicateurs clés : année d'équilibre, coût d'achat sur 10 ans, coût de location sur 10 ans, avantage net de l'achat, comparaison mensualité vs loyer et apport requis
- Tableau de comparaison année par année montrant les coûts cumulés d'achat vs location sur 10 ans avec différence nette chaque année
- Analyse du point d'équilibre identifiant l'année exacte où l'achat devient moins cher que la location sur une base cumulative
- Grille d'analyse de sensibilité montrant l'année d'équilibre pour 5 taux d'appréciation croisés avec 5 taux hypothécaires (25 combinaisons)
Aperçu
Découvrez le contenu de ce modèle
Comment utiliser ce modèle Calculateur location vs achat
Saisissez les détails de location
Entrez le loyer mensuel actuel et le pourcentage d'augmentation annuelle attendu pour la période de comparaison.
Saisissez les détails d'achat
Ajoutez le prix de la maison, l'apport, le taux hypothécaire, les taxes foncières, l'assurance et les estimations d'entretien.
Définissez l'horizon temporel
Saisissez le nombre d'années pour la comparaison. Les résultats changent significativement selon les différentes périodes de détention.
Comparez les résultats
Le tableau de bord affiche le coût total de la location vs le coût total de l'achat, la valeur nette constituée et l'année de rentabilité.
Customer Reviews
What Our Customers Say
"If I get half as good at handling my finances as you are at customer service, this'll be the best $26 I've spent lately."
"Great tool! Simplifies financial planning without the hassle of complex spreadsheets."
"I recently purchased your super convenient spreadsheet, it really helps me!"
"They're great and super intuitive. Thank you!"
Créés par Claude AI. Perfectionnés par nos soins.
Nous utilisons Claude AI pour rédiger chaque modèle, après une recherche approfondie. Puis notre équipe prend le relais. Nous affinons la mise en page, testons chaque formule en conditions réelles, corrigeons les cas limites et peaufinons le design jusqu'à obtenir un résultat que nous utiliserions nous-mêmes. L'IA nous amène à 80 %. Les 20 % restants, c'est du jugement humain.
Questions fréquentes
Quels coûts sont inclus du côté achat ?
Paiements hypothécaires, taxes foncières, assurance, entretien, frais de copropriété et coût d'opportunité de l'apport. La constitution de valeur nette est prise en compte comme un crédit.
Prend-il en compte l'appréciation de la maison ?
Oui. Saisissez un taux d'appréciation annuel attendu. Le calculateur tient compte de la croissance de la valeur de la propriété lors du calcul du coût net de l'achat.
Qu'est-ce que le coût d'opportunité de l'apport ?
Si l'apport était investi au lieu d'être utilisé pour un achat immobilier, il générerait des rendements. Le calculateur prend en compte cette croissance d'investissement perdue.
Quand l'achat atteint-il généralement le point de rentabilité ?
Cela varie considérablement selon le marché et les entrées. L'analyse de rentabilité montre l'année spécifique où les coûts cumulés d'achat deviennent inférieurs aux coûts cumulés de location pour votre scénario.
Comment ouvrir ce fichier dans Google Sheets ?
Importez le fichier .xlsx dans Google Drive, puis ouvrez-le avec Google Sheets. Toutes les formules et la mise en forme seront conservées.
Plus de modèles Essentials Hypothèque et habitation
Points Clés :
Vous recherchez des modèles de tableurs premium ?
Nos modèles payants incluent des tableaux de bord multi-feuilles avancés, des graphiques Excel natifs et des mises à jour régulières.
Privé et sécurisé
Vos données financières restent sur votre appareil. Nous ne les voyons jamais.
En savoir plus →Obtenez plutôt tous les modèles Ultimate
Les 58 modèles Ultimate en un seul achat pour $299 - valeur de $1,102, vous économisez $803.