Calculadora de Ganancias de Capital Plantilla Essentials
Calcula las ganancias y pérdidas de capital por la venta de inversiones. Da seguimiento a los lotes fiscales con detalles de compra y venta para la declaración de impuestos.
Qué incluye
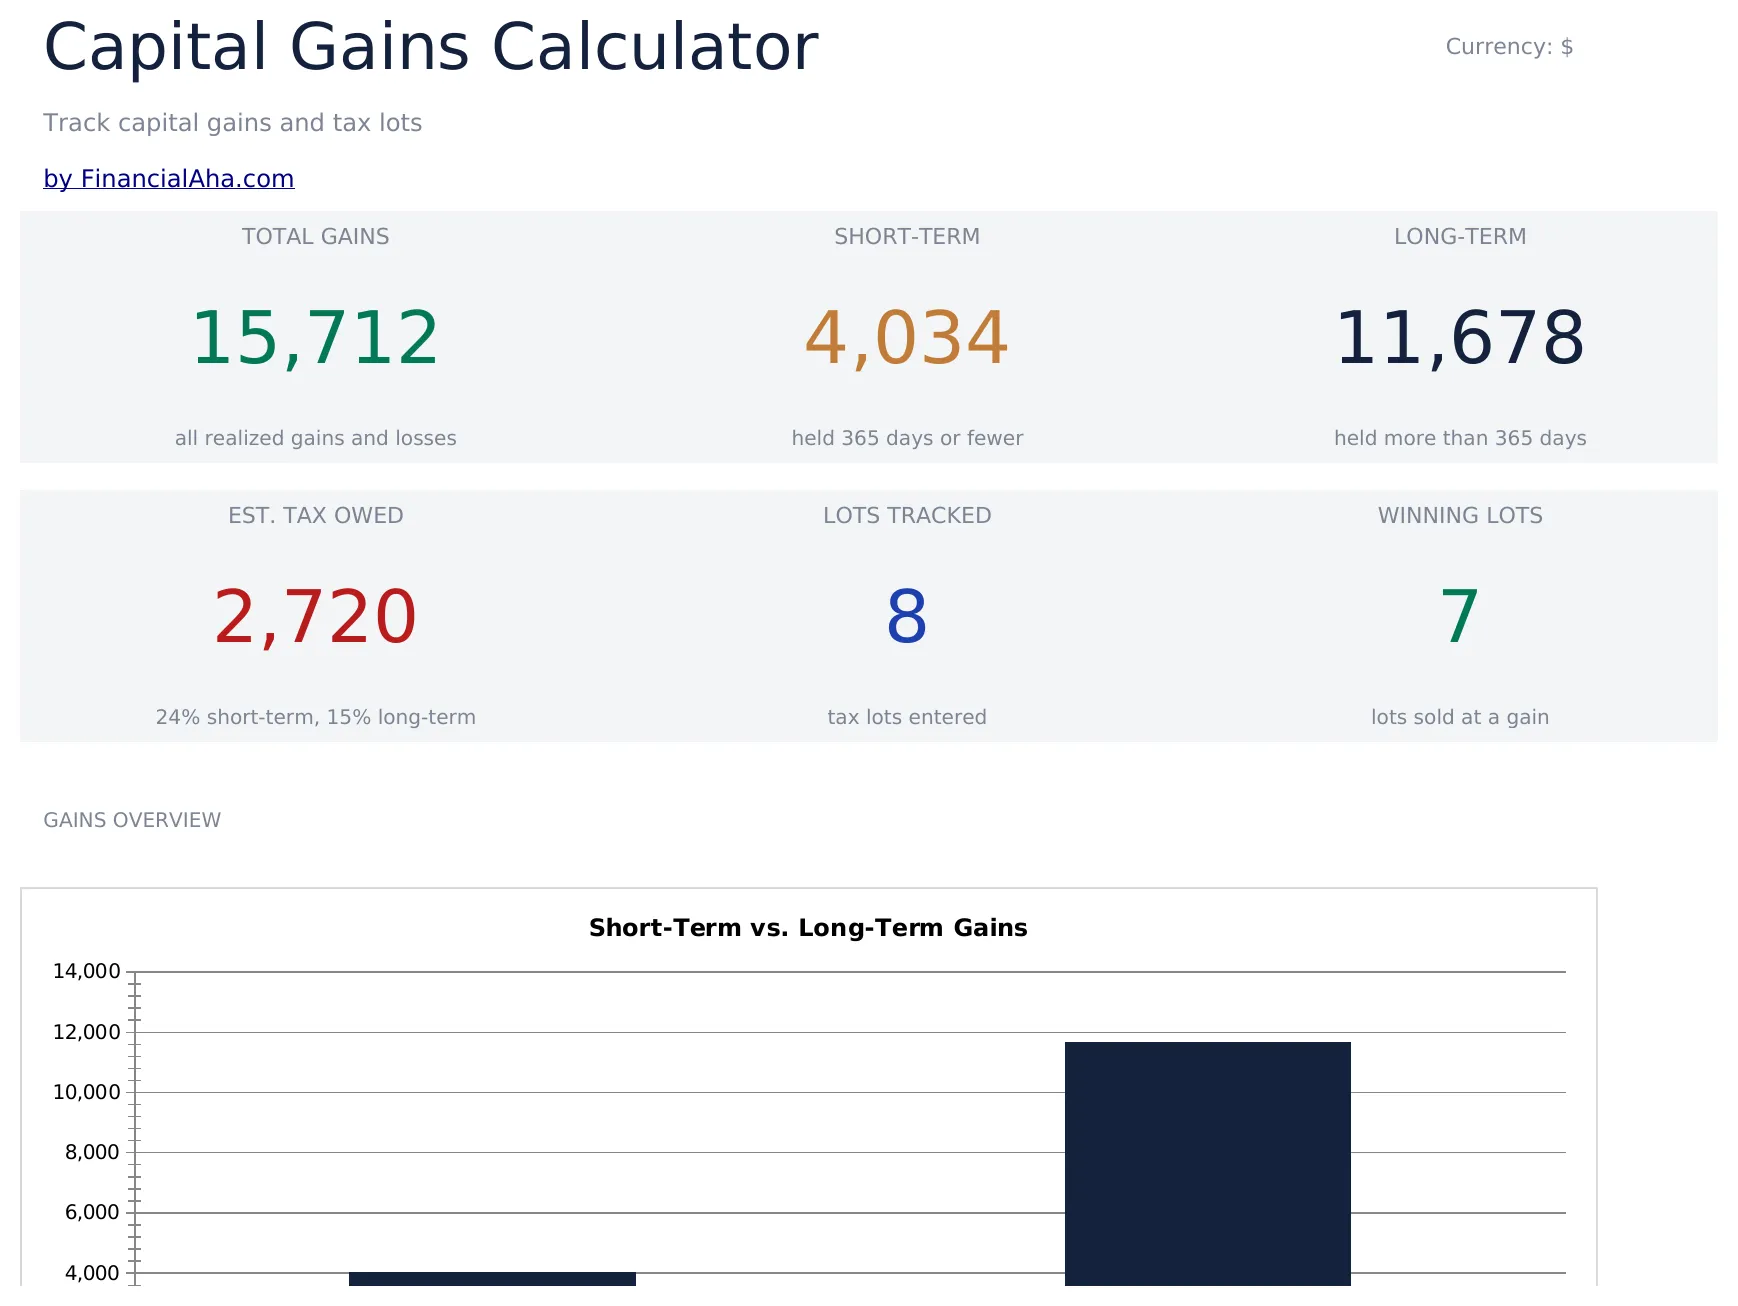
- Panel de control con resumen de ganancias y pérdidas mostrando ganancias a corto plazo totales, ganancias a largo plazo y ganancia neta de capital
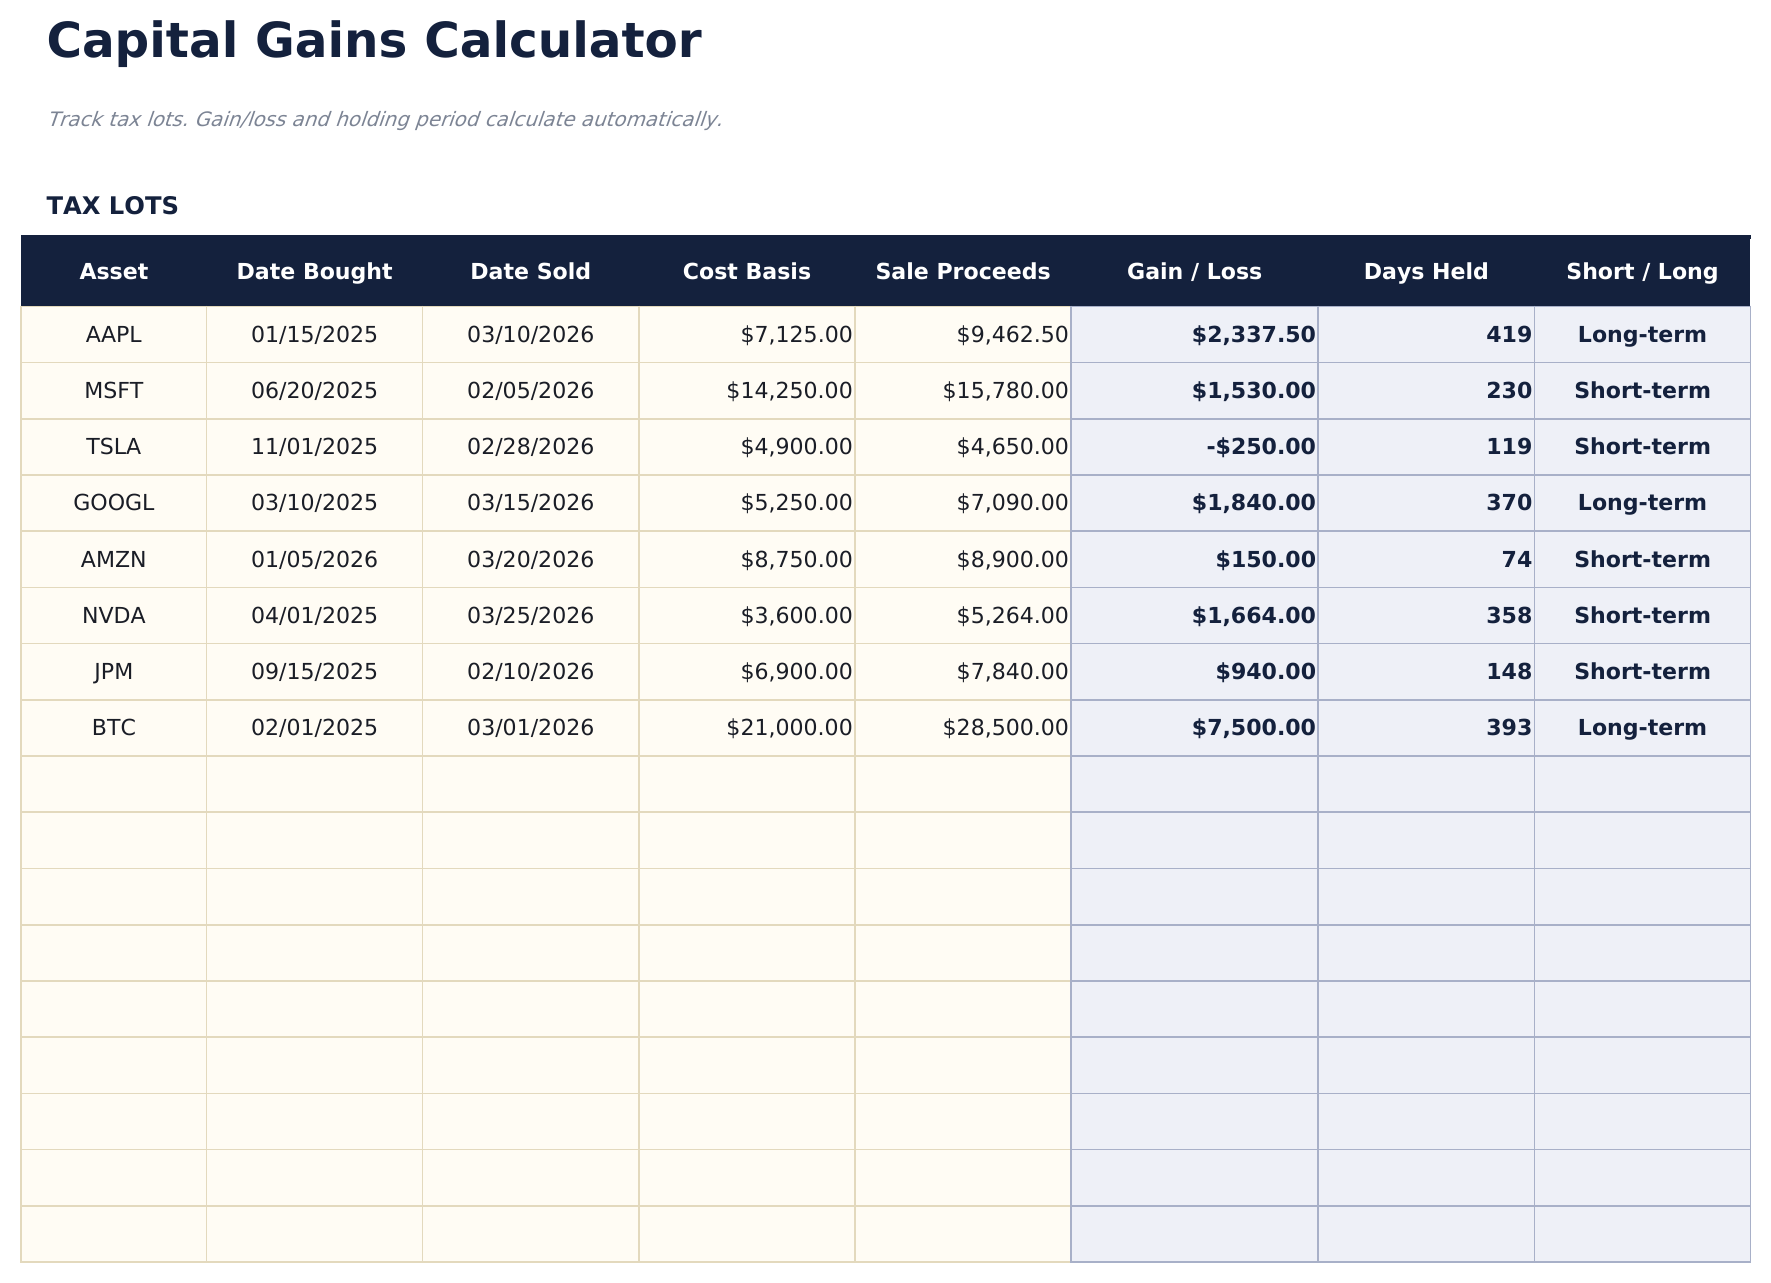
- Seguimiento de lotes fiscales con fecha de compra, precio de compra, fecha de venta, precio de venta, acciones y ganancia o pérdida automática
- Clasificación de corto plazo vs. largo plazo basada en el período de tenencia con categorización automática por cada lote fiscal vendido
- Cálculos automáticos de ganancia y pérdida por lote considerando costo base, producto de la venta y cualquier ajuste por comisiones o cargos
- Resumen de ganancia neta de capital con celdas de entrada codificadas por color (amarillo) y resultados de lotes fiscales calculados automáticamente (azul)
- Funciona en Microsoft Excel, Google Sheets y LibreOffice Calc sin necesidad de configuración
Need more from this template?
The Essentials version covers everyday tracking. Ultimate goes further with multi-entity support, scenario analysis, and ultimate-grade reporting.
- Panel de control con resumen de ganancias y pérdidas mostrando ganancias a corto plazo totales, ganancias a largo plazo y ganancia neta de capital
- Seguimiento de lotes fiscales con fecha de compra, precio de compra, fecha de venta, precio de venta, acciones y ganancia o pérdida automática
- Clasificación de corto plazo vs. largo plazo basada en el período de tenencia con categorización automática por cada lote fiscal vendido
- Cálculos automáticos de ganancia y pérdida por lote considerando costo base, producto de la venta y cualquier ajuste por comisiones o cargos
- Registra hasta 50 transacciones realizadas con activo, acciones, fechas de compra y venta, costo base y monto recibido
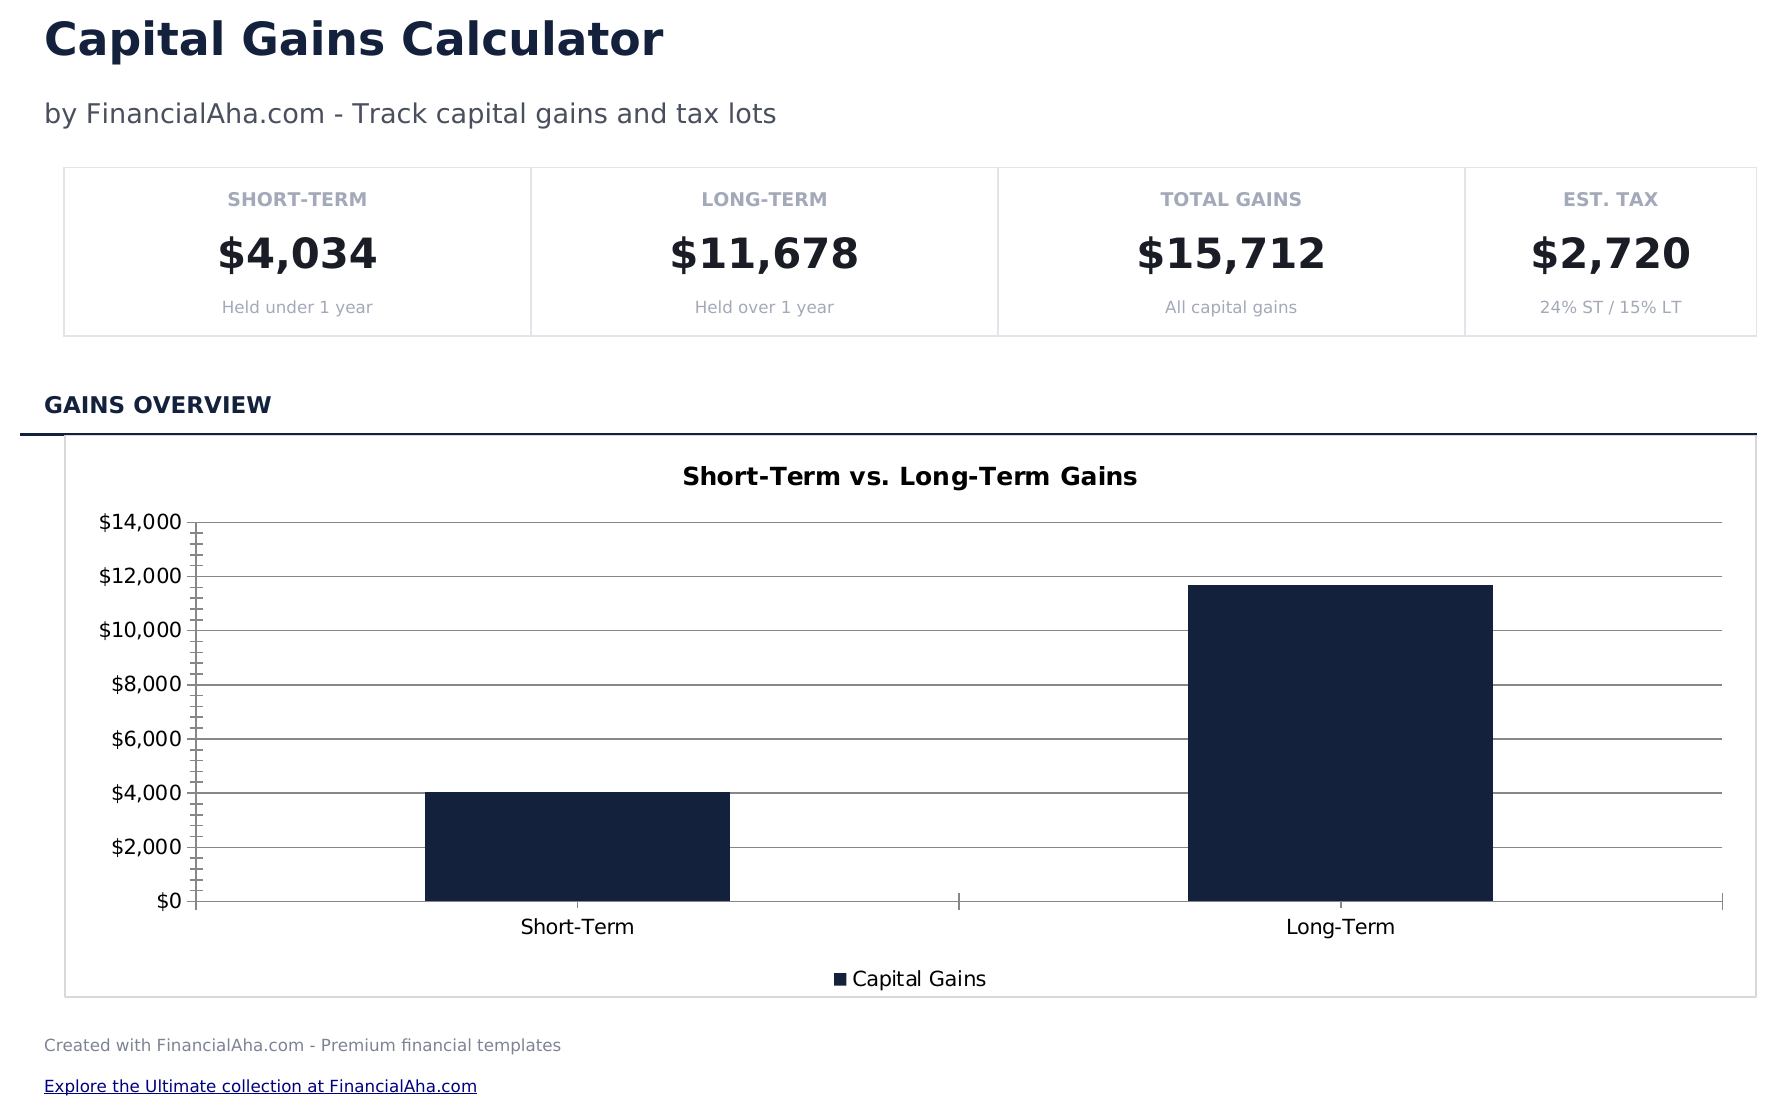
- Panel con 6 KPIs: ganancias totales, ganancias a corto plazo, ganancias a largo plazo, impuesto estimado, tasa efectiva y cantidad de transacciones
- Clasificación automática de corto plazo vs largo plazo basada en el período de tenencia (más de 365 días = largo plazo)
- Resumen Fiscal con tasas editables de corto y largo plazo, desglosado por período de tenencia con cálculo de ganancias después de impuestos
- Cuadrícula de análisis de sensibilidad mostrando impuesto estimado en 7 tasas de corto plazo cruzadas con 5 tasas de largo plazo (35 escenarios)
Vista previa
Mira qué contiene esta plantilla
Cómo usar esta plantilla de Calculadora de Ganancias de Capital
Ingresa cada venta
Para cada inversión vendida, ingresa la fecha de compra, precio de compra, fecha de venta, precio de venta y número de acciones.
Revisa el período de tenencia
La plantilla clasifica cada venta como corto plazo (tenencia menor a un año) o largo plazo (tenencia de un año o más) automáticamente.
Verifica la ganancia o pérdida
Cada lote fiscal muestra la ganancia o pérdida calculada basándose en el producto de la venta menos el costo base, ajustado por comisiones.
Consulta el resumen
El panel de control muestra los totales de ganancias a corto plazo, ganancias a largo plazo y ganancia neta de capital para el año fiscal.
Customer Reviews
What Our Customers Say
"If I get half as good at handling my finances as you are at customer service, this'll be the best $26 I've spent lately."
"Great tool! Simplifies financial planning without the hassle of complex spreadsheets."
"I recently purchased your super convenient spreadsheet, it really helps me!"
"They're great and super intuitive. Thank you!"
Creadas por Claude AI. Perfeccionadas por nosotros.
Usamos Claude AI para crear el borrador de cada plantilla, después de una investigación profunda. Luego nuestro equipo interviene. Refinamos el diseño, probamos cada fórmula a fondo, corregimos casos especiales y pulimos el diseño hasta que se siente como algo que realmente usaríamos nosotros mismos. La IA nos lleva al 80%. El último 20% es criterio humano.
Preguntas frecuentes
¿Qué es un lote fiscal?
Un lote fiscal es el registro de una compra específica - la fecha, el precio y las acciones compradas. Cuando vendes, vincular la venta a un lote fiscal determina la ganancia o pérdida.
¿Por qué importa el período de tenencia?
Las ganancias a corto plazo (menos de un año) generalmente se gravan a tasas de ingreso ordinario. Las ganancias a largo plazo (más de un año) pueden calificar para tasas de impuesto sobre ganancias de capital más bajas.
¿Puedo incluir costos de comisión?
Sí. Suma las comisiones al costo base o réstalas del producto de la venta. Esto reduce la ganancia gravable o aumenta la pérdida deducible.
¿Maneja las ventas de lavado (wash sales)?
La plantilla no detecta automáticamente las ventas de lavado. Si aplica una venta de lavado, ajusta manualmente el costo base de las acciones de reemplazo.
¿Cómo abro esto en Google Sheets?
Sube el archivo .xlsx a Google Drive y luego ábrelo con Google Sheets. Todas las fórmulas y el formato se conservarán.
Más plantillas Essentials de Inversiones y Trading
Destacados:
¿Buscas plantillas premium?
Nuestras plantillas de pago incluyen paneles avanzados con múltiples hojas, gráficos nativos de Excel y actualizaciones continuas.
Mejor obtenga todas las plantillas Ultimate
Las 58 plantillas Ultimate en una sola compra por $299 - valor de $1,102, usted se queda con $803.