Diario de Operaciones Bursátiles Plantilla Essentials
Registra operaciones de acciones con detalles de entrada, salida y ganancia/pérdida. Da seguimiento al rendimiento de las operaciones con cálculos acumulados de P&L.
Qué incluye
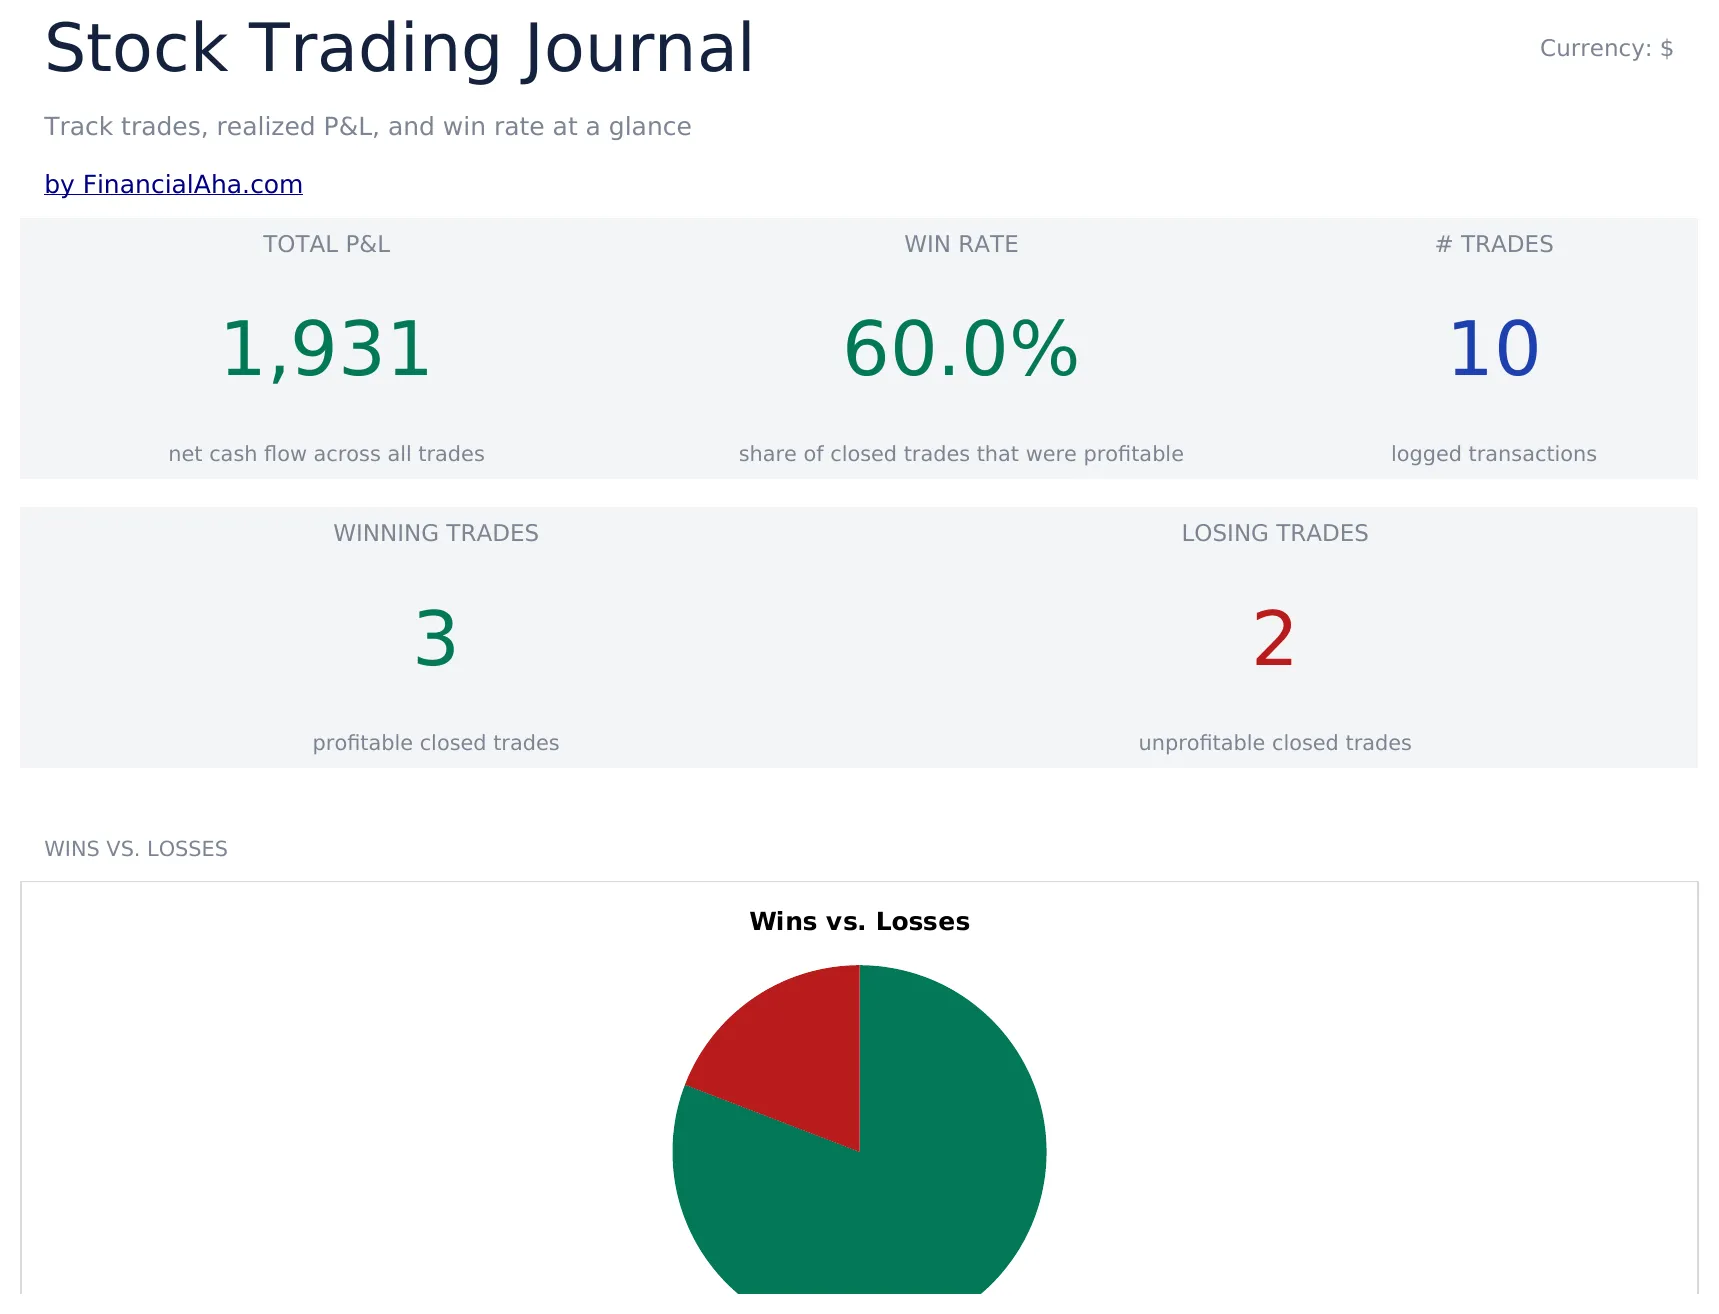
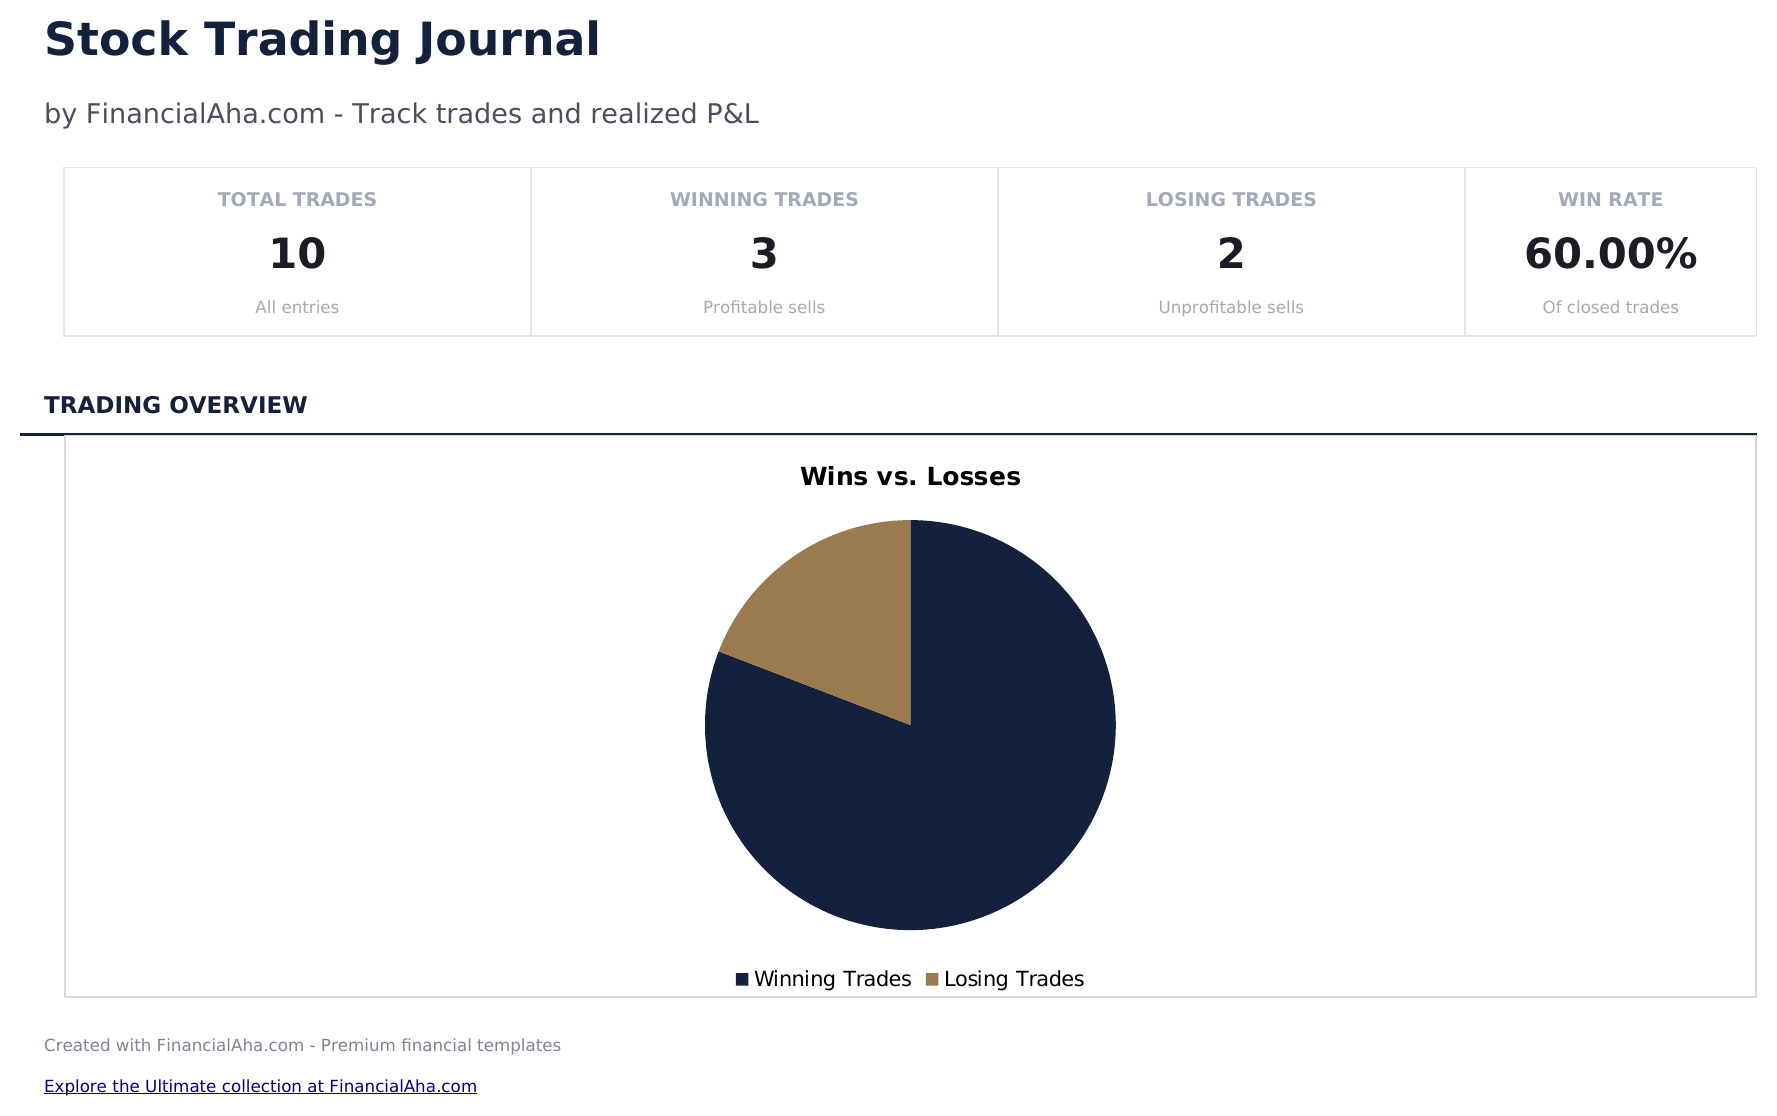
- Panel de control con métricas de rendimiento de operaciones mostrando total de operaciones, tasa de acierto, retorno promedio y P&L acumulado
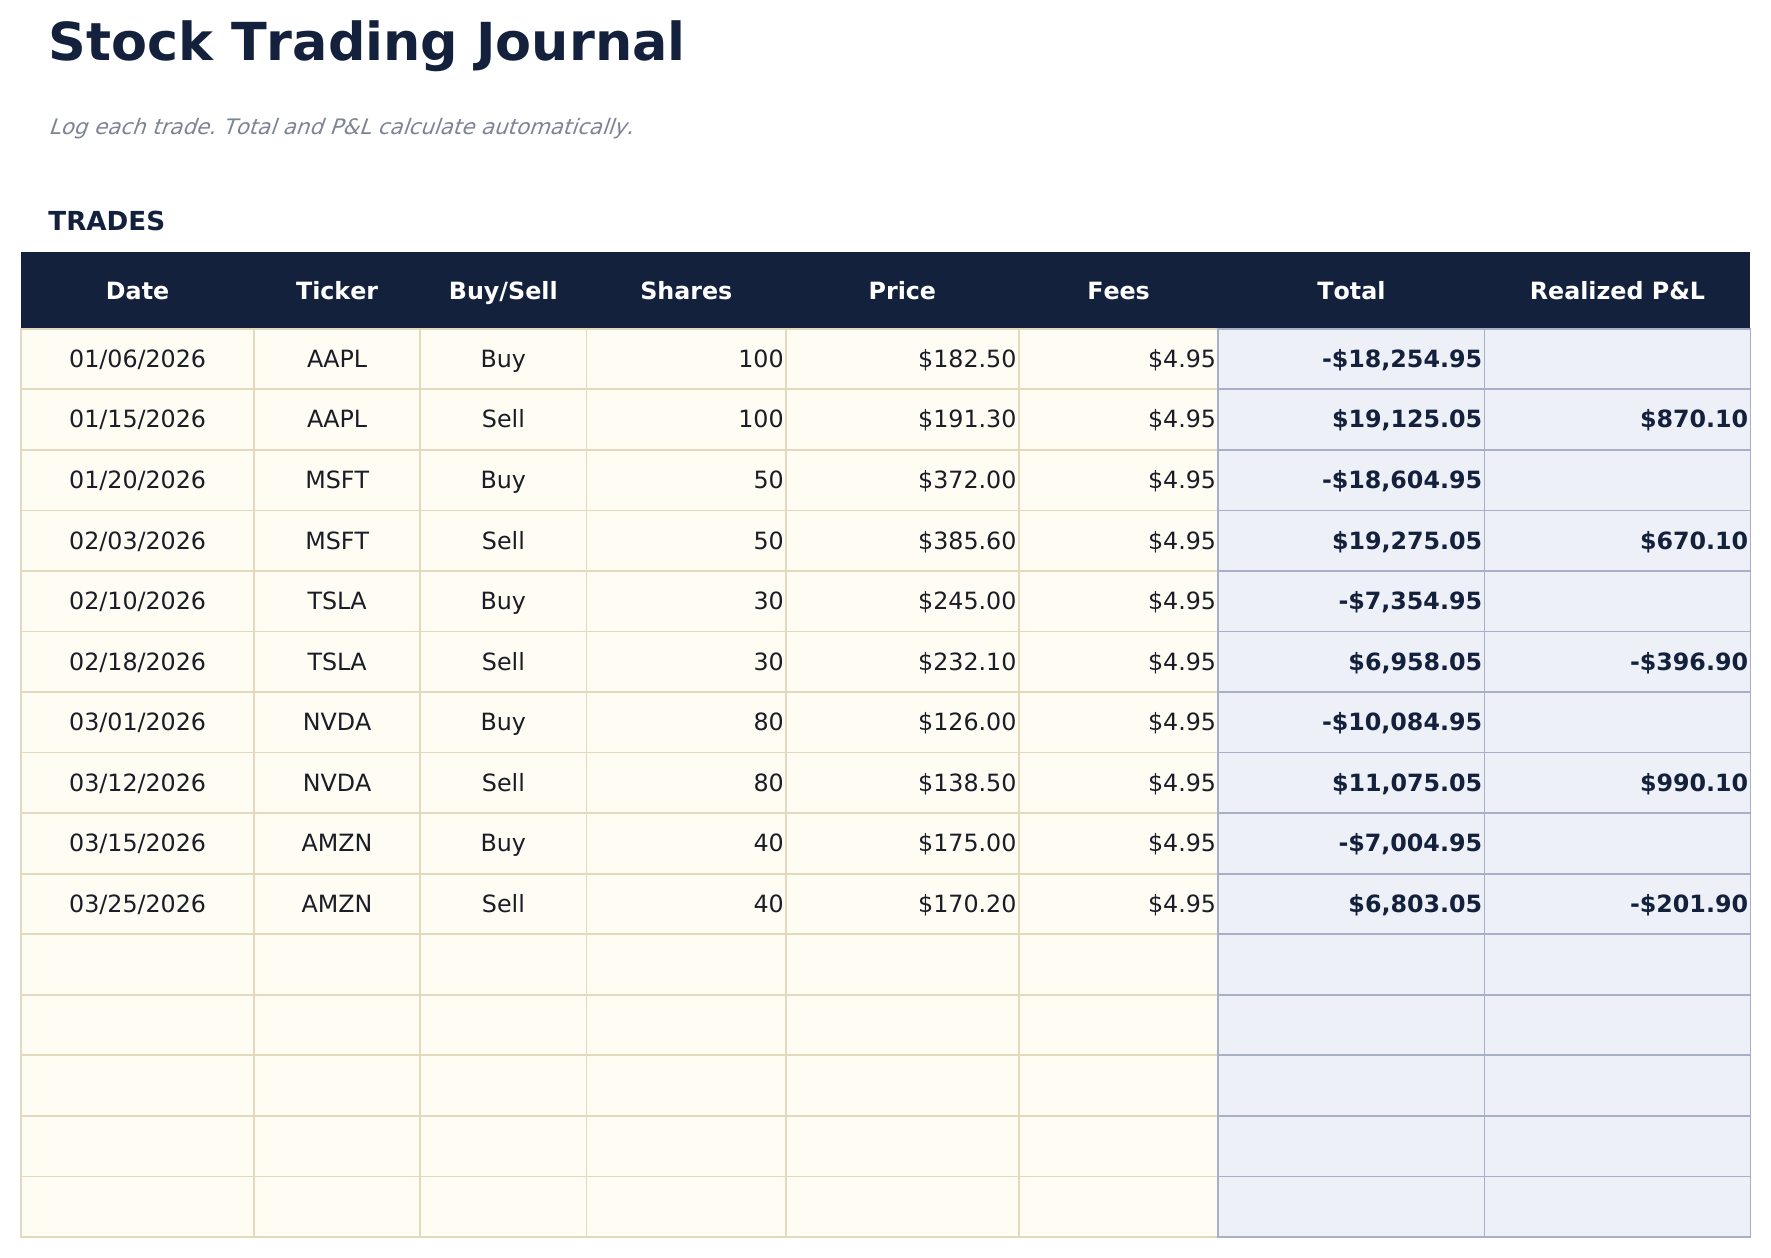
- Registro de operaciones con columnas para símbolo, fecha de entrada, precio de entrada, fecha de salida, precio de salida, acciones y ganancia o pérdida
- Ganancia y pérdida por operación calculada automáticamente a partir del precio de entrada, precio de salida, acciones y costos de comisión
- Cálculos de tasa de acierto y retorno promedio actualizados después de cada operación con estadísticas separadas para posiciones largas y cortas
- P&L acumulado con celdas de entrada codificadas por color (amarillo) y métricas de rendimiento calculadas automáticamente (azul)
- Funciona en Microsoft Excel, Google Sheets y LibreOffice Calc sin necesidad de configuración
Need more from this template?
The Essentials version covers everyday tracking. Ultimate goes further with multi-entity support, scenario analysis, and ultimate-grade reporting.
- Panel de control con métricas de rendimiento de operaciones mostrando total de operaciones, tasa de acierto, retorno promedio y P&L acumulado
- Registro de operaciones con columnas para símbolo, fecha de entrada, precio de entrada, fecha de salida, precio de salida, acciones y ganancia o pérdida
- Ganancia y pérdida por operación calculada automáticamente a partir del precio de entrada, precio de salida, acciones y costos de comisión
- Cálculos de tasa de acierto y retorno promedio actualizados después de cada operación con estadísticas separadas para posiciones largas y cortas
- Registra hasta 200 operaciones con ticker, fecha, dirección (Long/Short), acciones, precio de entrada, precio de salida, estrategia y notas
- Panel con 6 tarjetas de KPI: P&L total, tasa de acierto, mejor operación, ganancia promedio, pérdida promedio y total de operaciones
- Resumen de Rendimiento que muestra total de operaciones, aciertos, fallos, tasa de acierto, ganancia promedio, pérdida promedio y mayor ganancia y pérdida por ticker
- Hoja de P&L Mensual que agrega operaciones por mes: total de operaciones, aciertos, fallos, ganancia bruta, pérdida bruta y P&L neto por mes
- Análisis por Estrategia que desglosa el rendimiento por estrategia de trading: tasa de acierto, P&L promedio, P&L neto y cantidad de operaciones por estrategia
Vista previa
Mira qué contiene esta plantilla
Cómo usar esta plantilla de Diario de Operaciones Bursátiles
Registra cada operación
Ingresa el símbolo, fecha de entrada, precio de entrada, fecha de salida, precio de salida y número de acciones para cada operación completada.
Registra tu razonamiento
Agrega notas sobre por qué entraste y saliste de cada posición. Esto ayuda a revisar patrones de decisión con el tiempo.
Revisa los resultados de las operaciones
La ganancia o pérdida por operación se calcula automáticamente a partir del precio de entrada, precio de salida, acciones y comisiones.
Consulta las métricas de rendimiento
El panel de control muestra el total de operaciones, tasa de acierto, ganancia promedio, pérdida promedio y P&L acumulado.
Customer Reviews
What Our Customers Say
"If I get half as good at handling my finances as you are at customer service, this'll be the best $26 I've spent lately."
"Great tool! Simplifies financial planning without the hassle of complex spreadsheets."
"I recently purchased your super convenient spreadsheet, it really helps me!"
"They're great and super intuitive. Thank you!"
Creadas por Claude AI. Perfeccionadas por nosotros.
Usamos Claude AI para crear el borrador de cada plantilla, después de una investigación profunda. Luego nuestro equipo interviene. Refinamos el diseño, probamos cada fórmula a fondo, corregimos casos especiales y pulimos el diseño hasta que se siente como algo que realmente usaríamos nosotros mismos. La IA nos lleva al 80%. El último 20% es criterio humano.
Preguntas frecuentes
¿Calcula la tasa de acierto?
Sí. La tasa de acierto es el número de operaciones rentables dividido entre el total de operaciones. El panel de control se actualiza después de cada nueva operación.
¿Puedo registrar las comisiones?
Sí. Agrega los costos de comisión por operación. Se restan de la ganancia o se suman a la pérdida de cada posición.
¿Admite ventas en corto?
Sí. Para operaciones en corto, ingresa el precio de venta en corto como la entrada y el precio de cobertura como la salida. El cálculo de P&L funciona correctamente en ambas direcciones.
¿Puedo ver el rendimiento por símbolo?
Filtra u ordena por símbolo para ver todas las operaciones de una sola acción. Esto ayuda a identificar qué símbolos son más rentables.
¿Cómo abro esto en Google Sheets?
Sube el archivo .xlsx a Google Drive y luego ábrelo con Google Sheets. Todas las fórmulas y el formato se conservarán.
Más plantillas Essentials de Inversiones y Trading
Destacados:
¿Buscas plantillas premium?
Nuestras plantillas de pago incluyen paneles avanzados con múltiples hojas, gráficos nativos de Excel y actualizaciones continuas.
Mejor obtenga todas las plantillas Ultimate
Las 58 plantillas Ultimate en una sola compra por $299 - valor de $1,102, usted se queda con $803.