Journal de trading d'actions Modèle Essentials
Enregistrez vos transactions boursières avec les détails d'entrée, de sortie et de gain/perte. Suivez la performance de trading dans le temps avec des calculs de P&L cumulé.
Ce qui est inclus
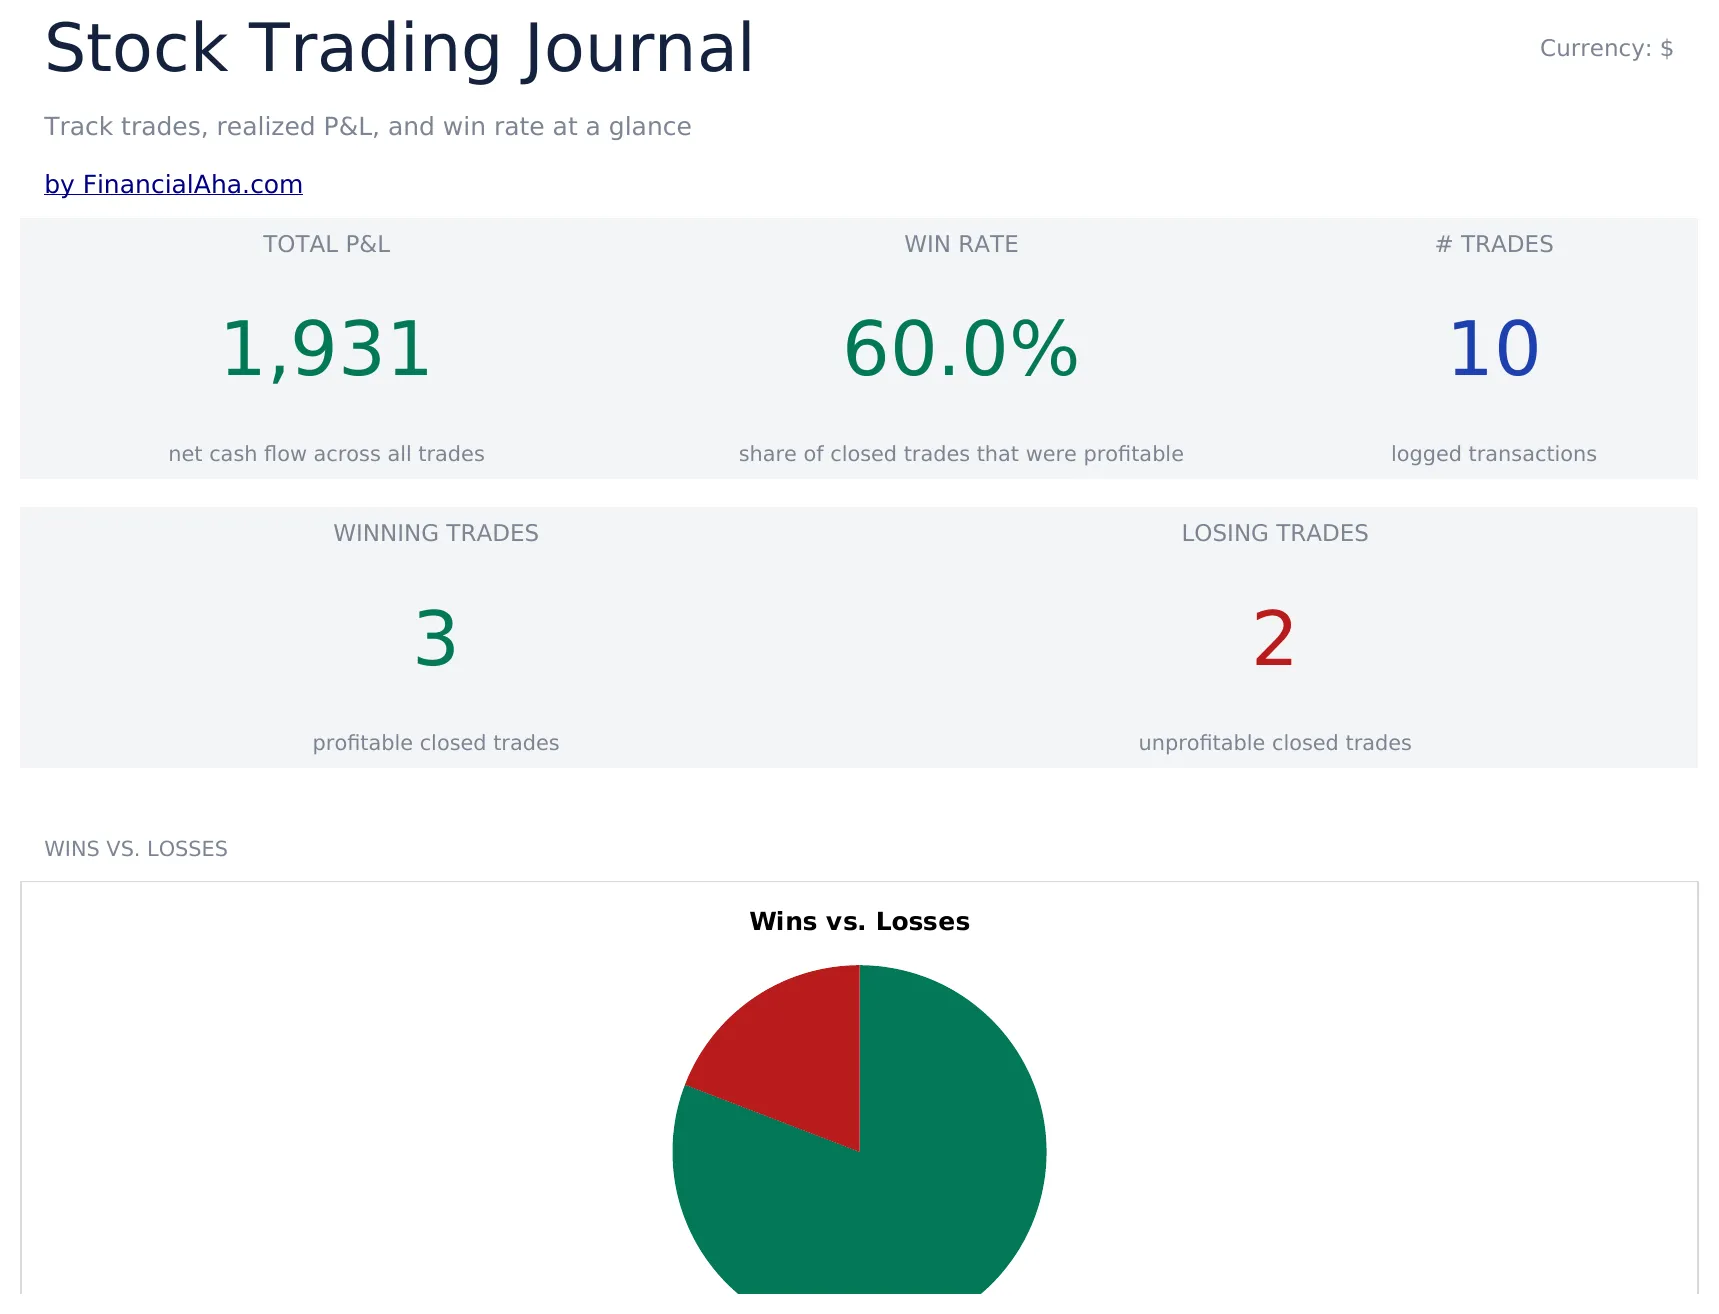
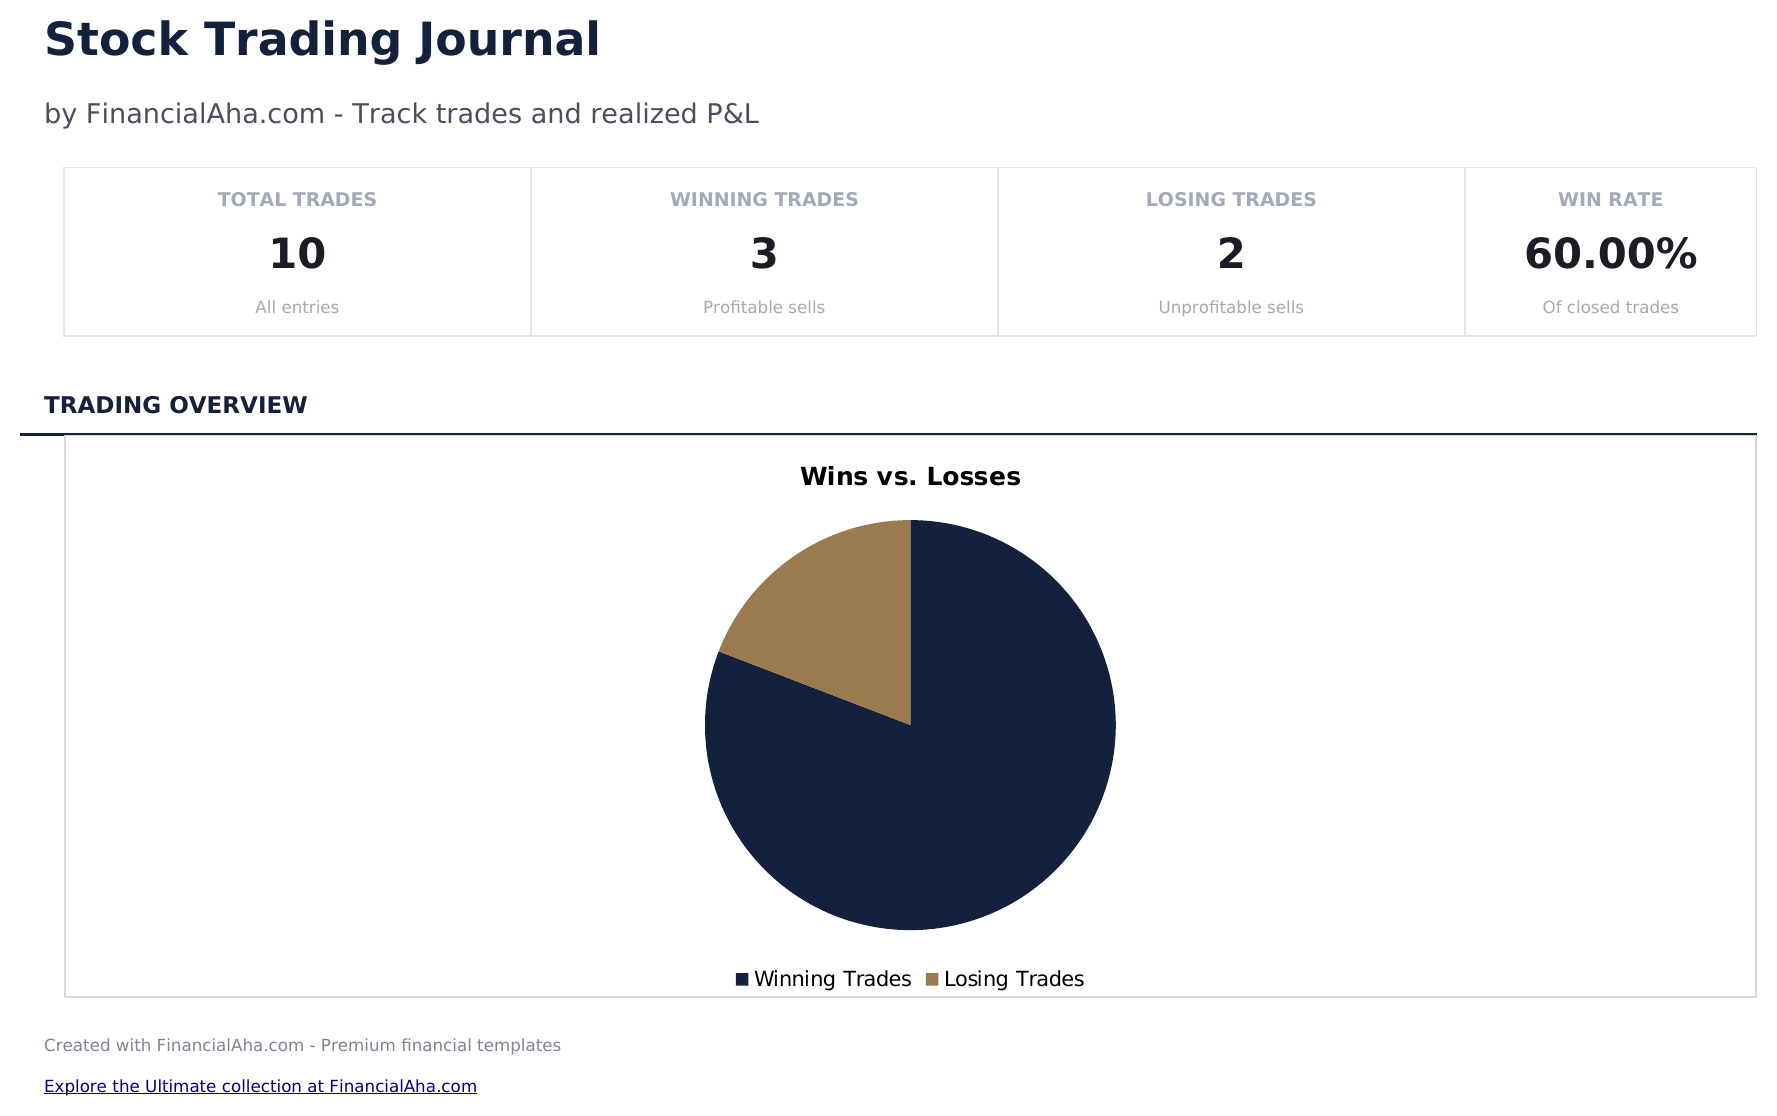
- Tableau de bord avec métriques de performance de trading affichant le nombre total de transactions, le taux de réussite, le rendement moyen et le P&L cumulé
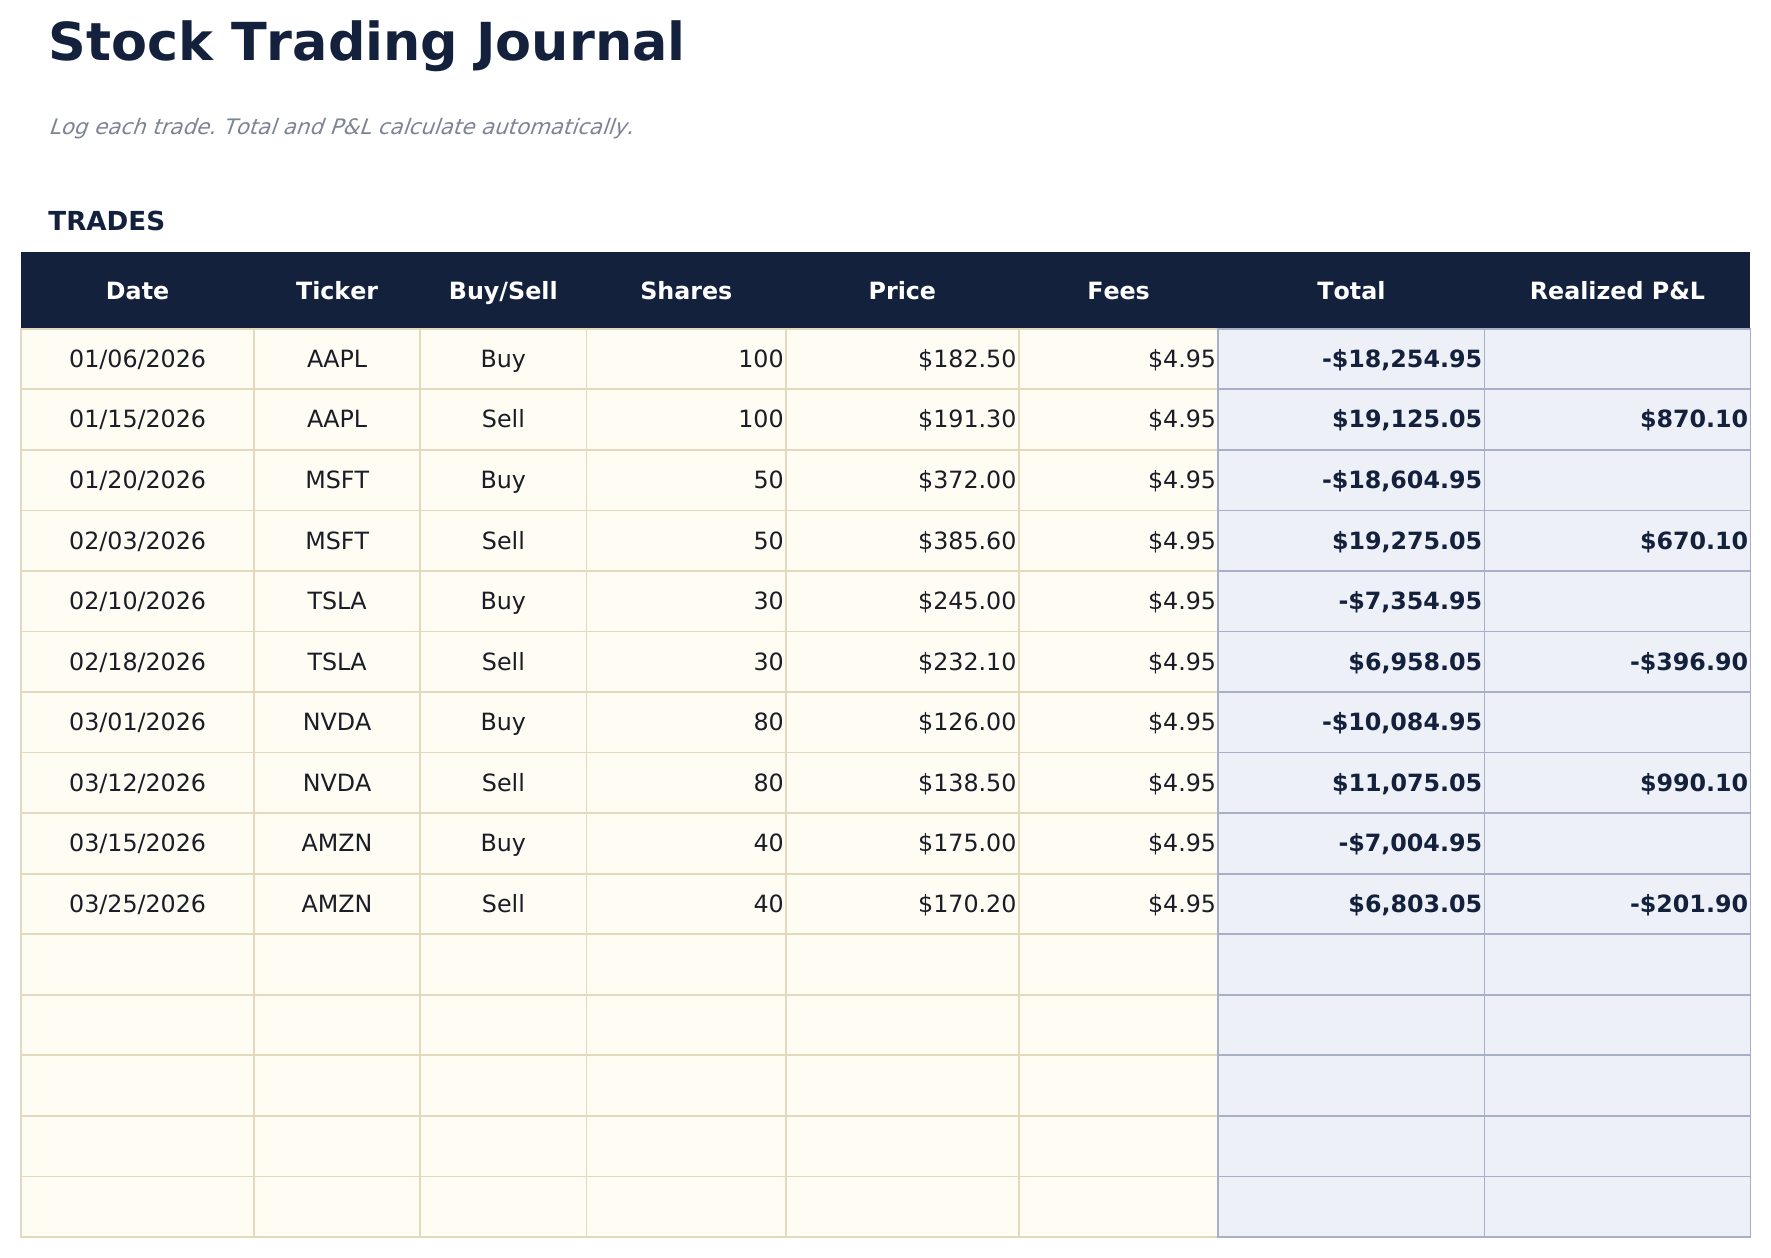
- Journal de transactions avec colonnes pour le symbole, la date d'entrée, le prix d'entrée, la date de sortie, le prix de sortie, le nombre d'actions et le gain ou la perte
- Gain et perte par transaction calculés automatiquement à partir du prix d'entrée, du prix de sortie, du nombre d'actions et des frais de commission
- Calculs du taux de réussite et du rendement moyen mis à jour après chaque saisie de transaction avec statistiques séparées pour les positions longues et courtes
- P&L cumulé courant avec cellules de saisie en couleur (jaune) et métriques de performance calculées automatiquement (bleu)
- Fonctionne dans Microsoft Excel, Google Sheets et LibreOffice Calc sans configuration requise
Need more from this template?
The Essentials version covers everyday tracking. Ultimate goes further with multi-entity support, scenario analysis, and ultimate-grade reporting.
- Tableau de bord avec métriques de performance de trading affichant le nombre total de transactions, le taux de réussite, le rendement moyen et le P&L cumulé
- Journal de transactions avec colonnes pour le symbole, la date d'entrée, le prix d'entrée, la date de sortie, le prix de sortie, le nombre d'actions et le gain ou la perte
- Gain et perte par transaction calculés automatiquement à partir du prix d'entrée, du prix de sortie, du nombre d'actions et des frais de commission
- Calculs du taux de réussite et du rendement moyen mis à jour après chaque saisie de transaction avec statistiques séparées pour les positions longues et courtes
- Enregistrer jusqu'à 200 transactions avec symbole, date, sens (Long/Short), nombre d'actions, prix d'entrée, prix de sortie, stratégie et notes
- Tableau de bord avec 6 indicateurs clés : P&L total, taux de réussite, meilleure transaction, gain moyen, perte moyenne et nombre total de transactions
- Synthèse des performances affichant le total des transactions, gains, pertes, taux de réussite, gain moyen, perte moyenne, plus grand gain et plus grande perte par symbole
- Feuille P&L mensuel agrégeant les transactions par mois : nombre de transactions, gains, pertes, profit brut, perte brute et P&L net par mois
- Analyse par stratégie détaillant les performances par stratégie de trading : taux de réussite, P&L moyen, P&L net et nombre de transactions par stratégie
Aperçu
Découvrez le contenu de ce modèle
Comment utiliser ce modèle Journal de trading d'actions
Enregistrez chaque transaction
Saisissez le symbole, la date d'entrée, le prix d'entrée, la date de sortie, le prix de sortie et le nombre d'actions pour chaque transaction clôturée.
Notez votre raisonnement
Ajoutez des notes sur les raisons de votre entrée et de votre sortie de chaque position. Cela permet de revoir les schémas de décision au fil du temps.
Examinez les résultats des transactions
Le gain ou la perte par transaction se calcule automatiquement à partir du prix d'entrée, du prix de sortie, du nombre d'actions et des commissions.
Consultez les métriques de performance
Le tableau de bord affiche le nombre total de transactions, le taux de réussite, le gain moyen, la perte moyenne et le P&L cumulé.
Customer Reviews
What Our Customers Say
"If I get half as good at handling my finances as you are at customer service, this'll be the best $26 I've spent lately."
"Great tool! Simplifies financial planning without the hassle of complex spreadsheets."
"I recently purchased your super convenient spreadsheet, it really helps me!"
"They're great and super intuitive. Thank you!"
Créés par Claude AI. Perfectionnés par nos soins.
Nous utilisons Claude AI pour rédiger chaque modèle, après une recherche approfondie. Puis notre équipe prend le relais. Nous affinons la mise en page, testons chaque formule en conditions réelles, corrigeons les cas limites et peaufinons le design jusqu'à obtenir un résultat que nous utiliserions nous-mêmes. L'IA nous amène à 80 %. Les 20 % restants, c'est du jugement humain.
Questions fréquentes
Le modèle calcule-t-il le taux de réussite ?
Oui. Le taux de réussite correspond au nombre de transactions rentables divisé par le nombre total de transactions. Le tableau de bord se met à jour après chaque nouvelle saisie.
Puis-je suivre les commissions ?
Oui. Ajoutez les frais de commission par transaction. Ils sont soustraits du gain ou ajoutés à la perte pour chaque position.
Le modèle prend-il en charge la vente à découvert ?
Oui. Pour les transactions à découvert, saisissez le prix de vente à découvert comme entrée et le prix de rachat comme sortie. Le calcul du P&L fonctionne correctement dans les deux sens.
Puis-je voir la performance par symbole ?
Filtrez ou triez par symbole pour voir toutes les transactions sur une seule action. Cela permet d'identifier les symboles les plus rentables.
Comment ouvrir ce fichier dans Google Sheets ?
Importez le fichier .xlsx dans Google Drive, puis ouvrez-le avec Google Sheets. Toutes les formules et la mise en forme seront conservées.
Plus de modèles Essentials Investissement et trading
Points Clés :
Vous recherchez des modèles de tableurs premium ?
Nos modèles payants incluent des tableaux de bord multi-feuilles avancés, des graphiques Excel natifs et des mises à jour régulières.
Privé et sécurisé
Vos données financières restent sur votre appareil. Nous ne les voyons jamais.
En savoir plus →Obtenez plutôt tous les modèles Ultimate
Les 58 modèles Ultimate en un seul achat pour $299 - valeur de $1,102, vous économisez $803.