Aktienhandels-Journal Essentials-Vorlage
Protokollieren Sie Aktienhandel mit Ein- und Ausstieg sowie Gewinn-/Verlustdetails. Verfolgen Sie die Handelsperformance ueber die Zeit mit laufender GuV-Berechnung.
Was enthalten ist
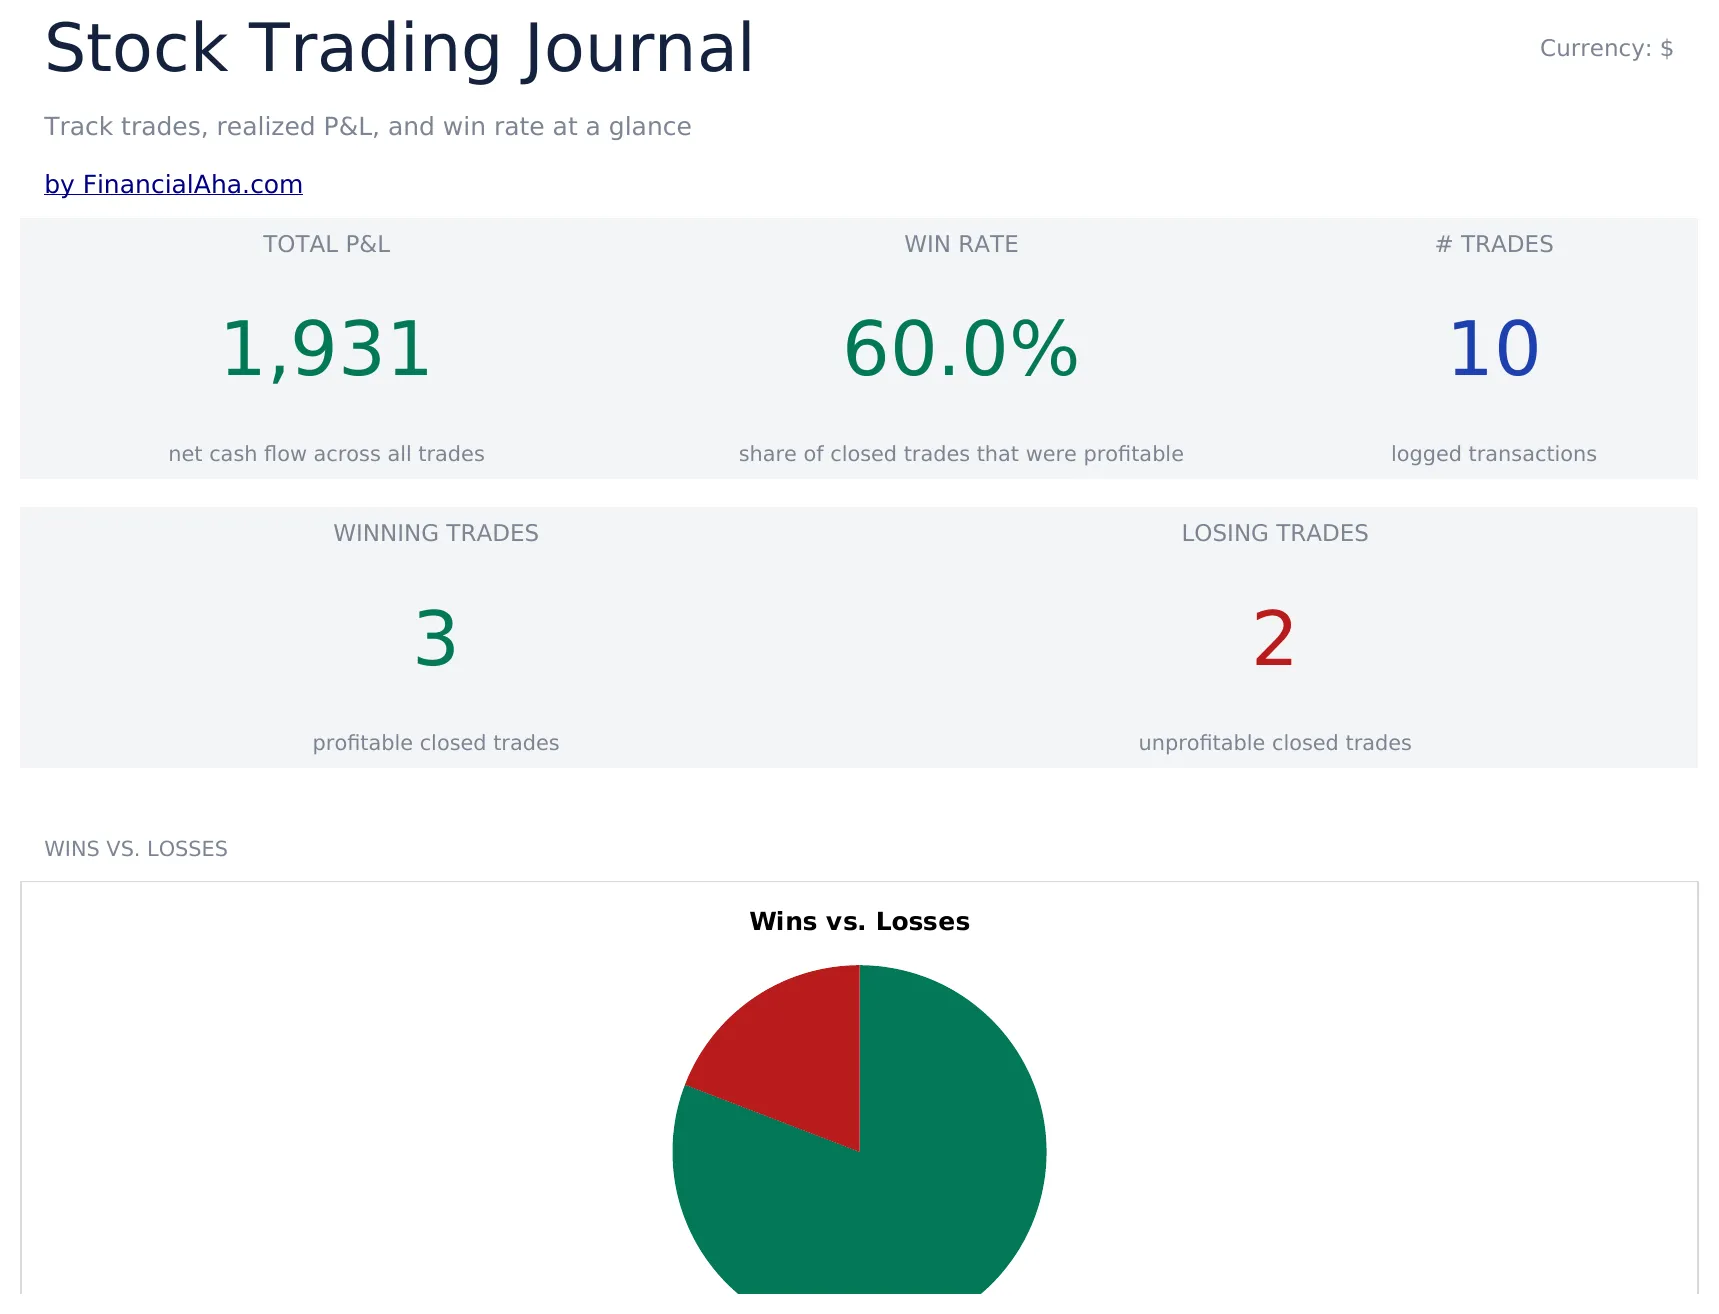
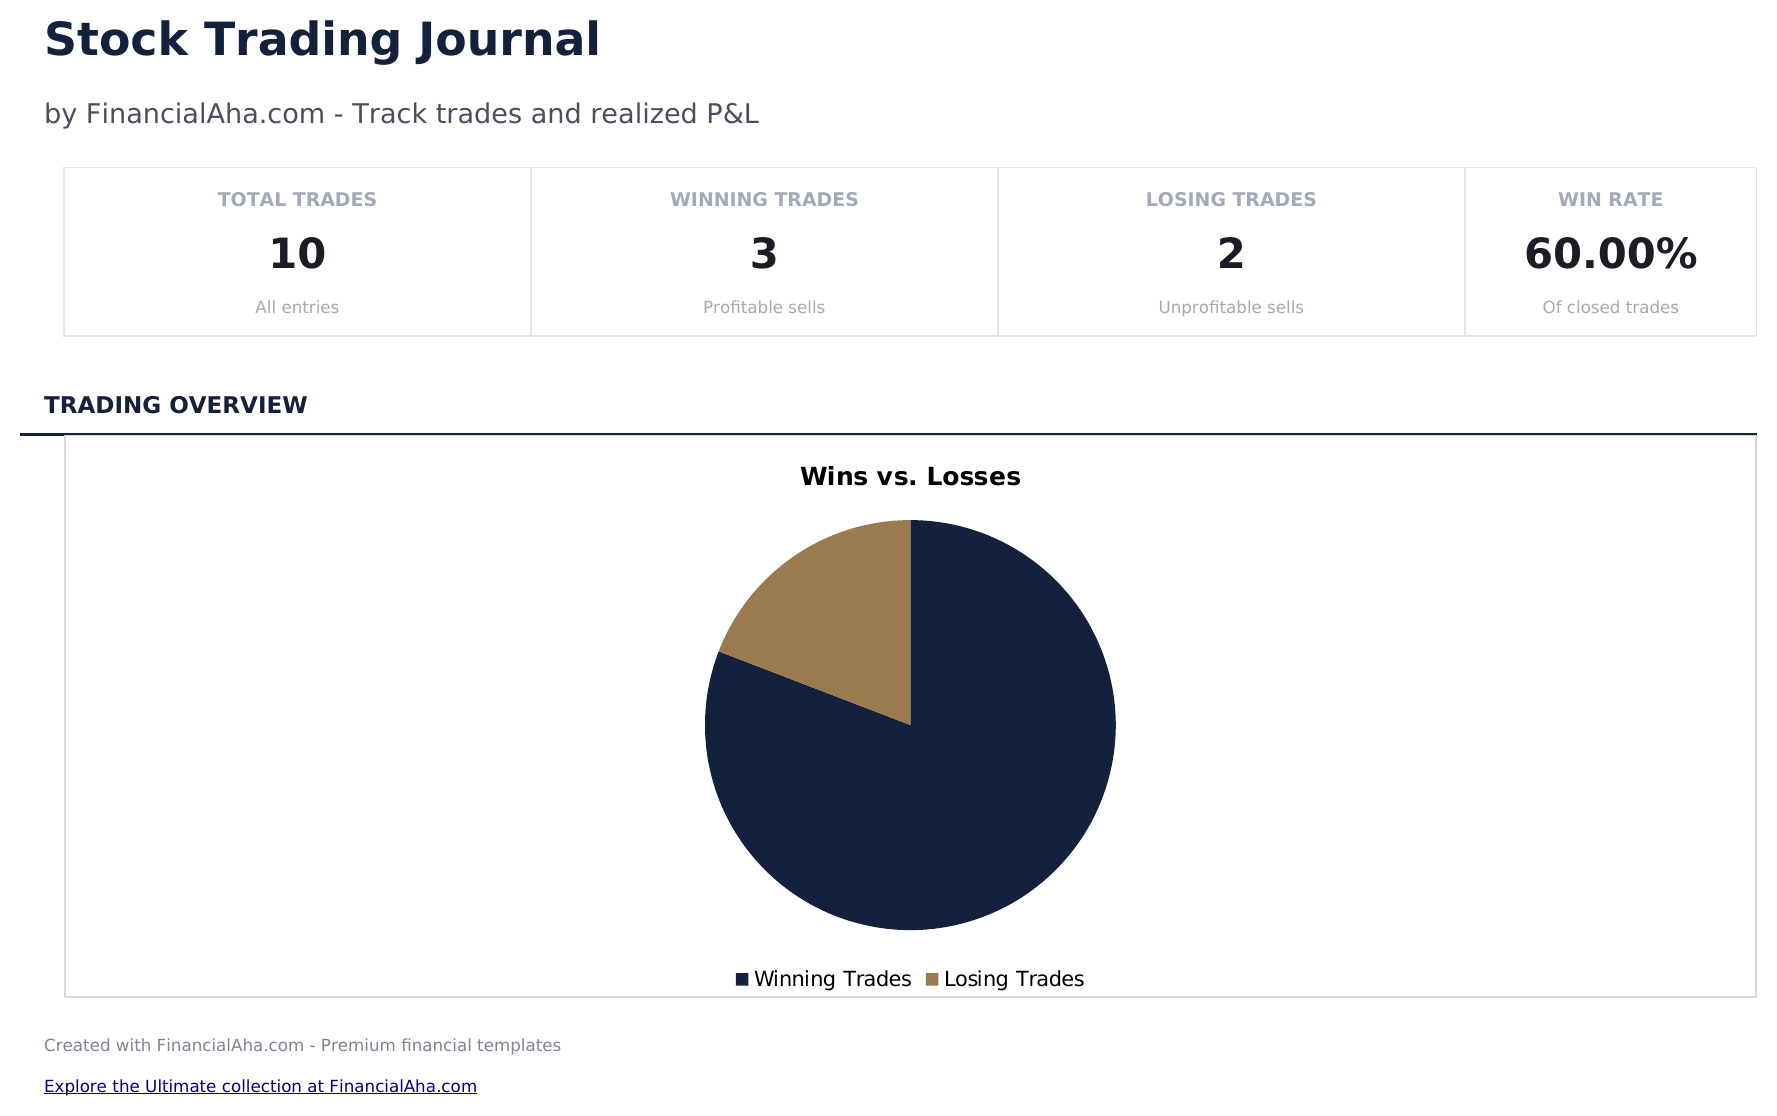
- Dashboard mit Handelsperformance-Kennzahlen zu Gesamtanzahl Trades, Gewinnquote, Durchschnittsrendite und kumuliertem GuV
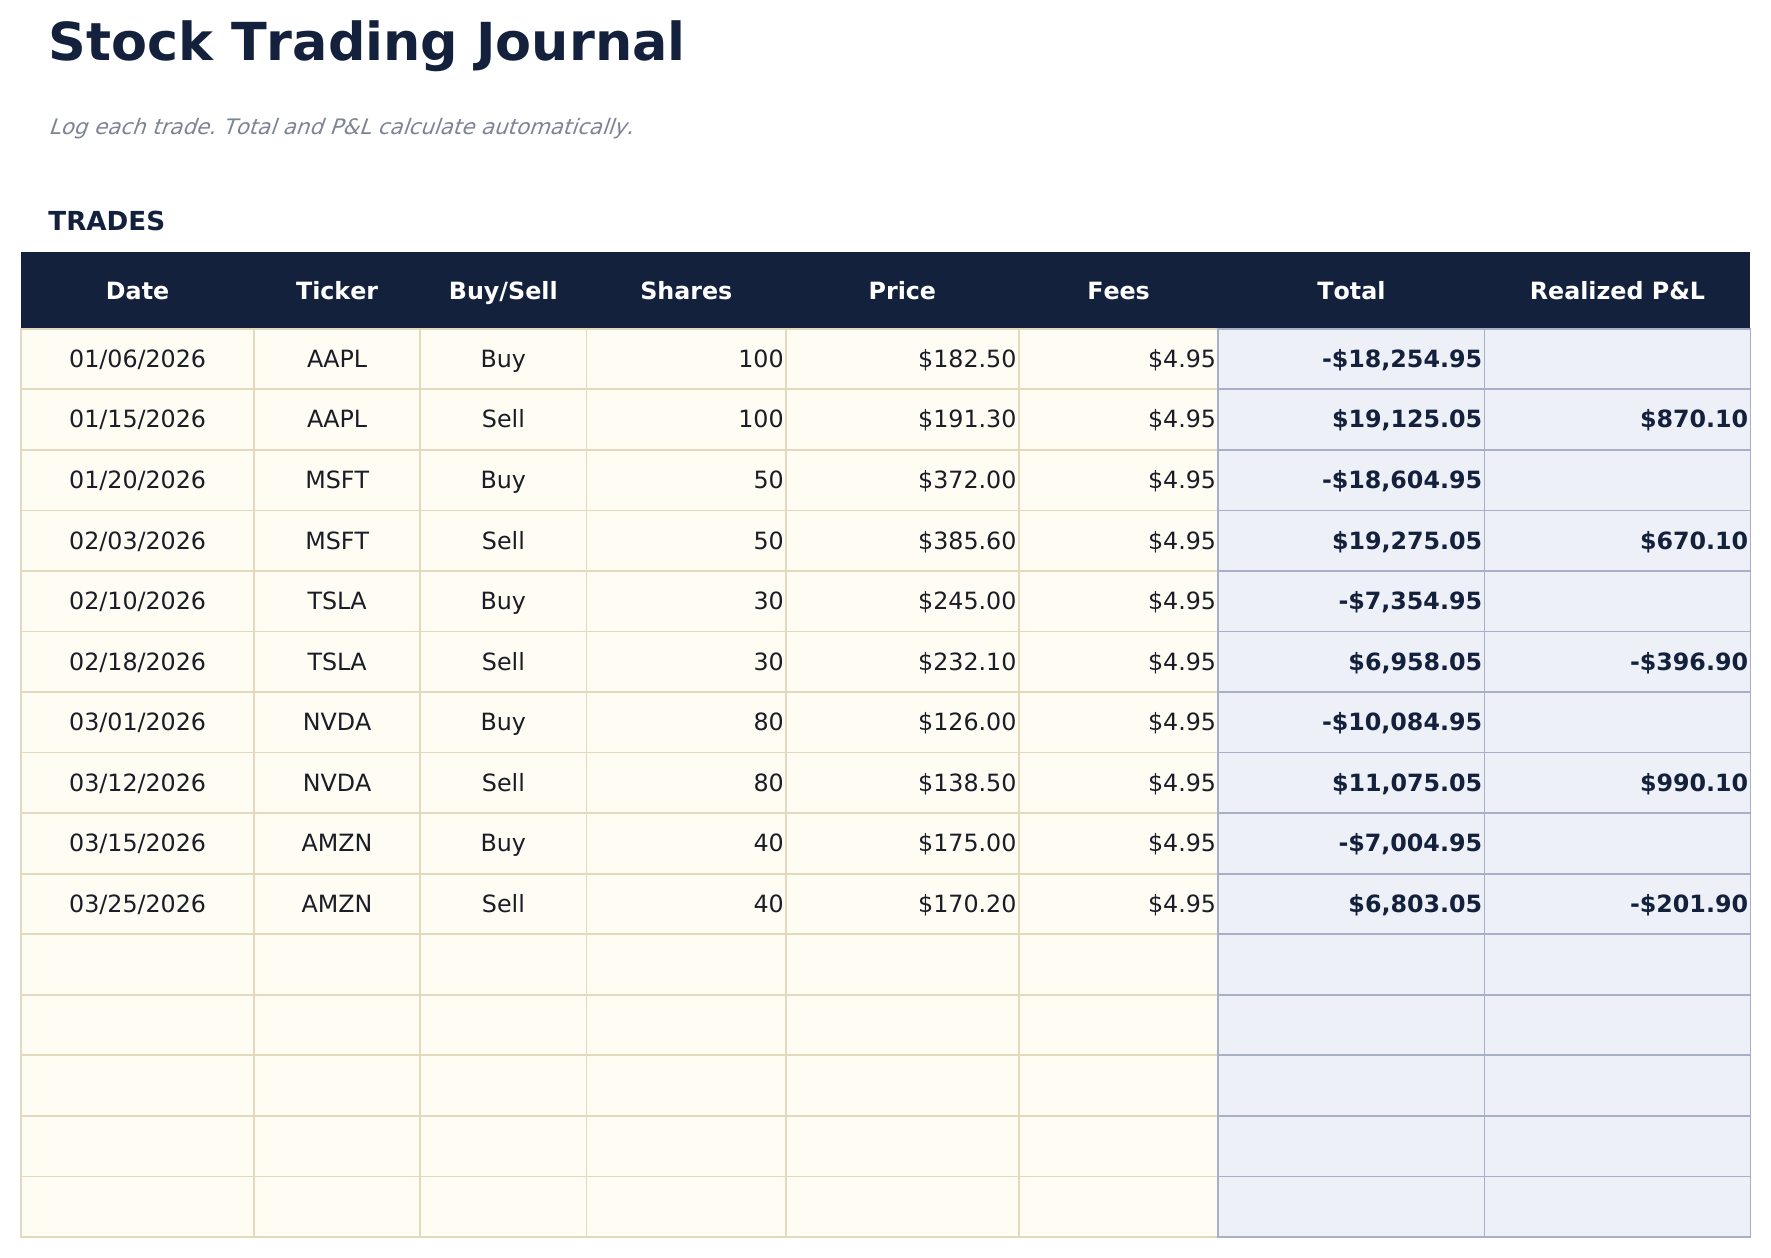
- Handelsprotokoll mit Spalten fuer Ticker, Einstiegsdatum, Einstiegskurs, Ausstiegsdatum, Ausstiegskurs, Stueckzahl und Gewinn oder Verlust
- Gewinn und Verlust pro Trade automatisch berechnet aus Einstiegskurs, Ausstiegskurs, Stueckzahl und Provisionskosten
- Gewinnquote und Durchschnittsrendite-Berechnungen, die nach jedem Handels-Eintrag aktualisiert werden, mit separater Long- und Short-Statistik
- Laufendes kumuliertes GuV mit farbcodierten Eingabefeldern (gelb) und automatisch berechneten Performance-Kennzahlen (blau)
- Funktioniert in Microsoft Excel, Google Sheets und LibreOffice Calc ohne Einrichtung
Need more from this template?
The Essentials version covers everyday tracking. Ultimate goes further with multi-entity support, scenario analysis, and ultimate-grade reporting.
- Dashboard mit Handelsperformance-Kennzahlen zu Gesamtanzahl Trades, Gewinnquote, Durchschnittsrendite und kumuliertem GuV
- Handelsprotokoll mit Spalten fuer Ticker, Einstiegsdatum, Einstiegskurs, Ausstiegsdatum, Ausstiegskurs, Stueckzahl und Gewinn oder Verlust
- Gewinn und Verlust pro Trade automatisch berechnet aus Einstiegskurs, Ausstiegskurs, Stueckzahl und Provisionskosten
- Gewinnquote und Durchschnittsrendite-Berechnungen, die nach jedem Handels-Eintrag aktualisiert werden, mit separater Long- und Short-Statistik
- Erfassen Sie bis zu 200 Trades mit Ticker, Datum, Richtung (Long/Short), Stückzahl, Einstiegskurs, Ausstiegskurs, Strategie und Notizen
- Dashboard mit 6 KPI-Karten: Gesamt-GuV, Gewinnrate, bester Trade, durchschnittlicher Gewinn, durchschnittlicher Verlust und Gesamtanzahl Trades
- Leistungsübersicht zeigt Gesamttrades, Gewinne, Verluste, Gewinnrate, durchschnittlichen Gewinn, durchschnittlichen Verlust und größten Gewinn und Verlust nach Ticker
- Monatliches GuV-Blatt aggregiert Trades nach Monat: Gesamttrades, Gewinne, Verluste, Bruttogewinn, Bruttoverlust und Netto-GuV pro Monat
- Strategieanalyse schlüsselt Leistung nach Handelsstrategie auf: Gewinnrate, durchschnittliche GuV, Netto-GuV und Tradeanzahl pro Strategie
Vorschau
Sehen Sie, was in dieser Vorlage enthalten ist
So verwenden Sie diese Aktienhandels-Journal-Vorlage
Jeden Trade protokollieren
Geben Sie Ticker, Einstiegsdatum, Einstiegskurs, Ausstiegsdatum, Ausstiegskurs und Stueckzahl fuer jeden abgeschlossenen Trade ein.
Begruendung notieren
Fuegen Sie Notizen hinzu, warum Sie in jede Position ein- und ausgestiegen sind. Dies hilft, Entscheidungsmuster ueber die Zeit zu ueberpruefen.
Handelsergebnisse ueberpruefen
Gewinn oder Verlust pro Trade berechnet sich automatisch aus Einstiegskurs, Ausstiegskurs, Stueckzahl und Provisionen.
Performance-Kennzahlen pruefen
Das Dashboard zeigt Gesamtanzahl Trades, Gewinnquote, durchschnittlichen Gewinn, durchschnittlichen Verlust und kumuliertes GuV.
Customer Reviews
What Our Customers Say
"If I get half as good at handling my finances as you are at customer service, this'll be the best $26 I've spent lately."
"Great tool! Simplifies financial planning without the hassle of complex spreadsheets."
"I recently purchased your super convenient spreadsheet, it really helps me!"
"They're great and super intuitive. Thank you!"
Erstellt von Claude AI. Verfeinert von uns.
Wir verwenden Claude AI, um jede Vorlage nach gründlicher Recherche zu entwerfen. Dann greift unser Team ein. Wir verfeinern das Layout, testen jede Formel auf Herz und Nieren, beheben Grenzfälle und polieren das Design, bis es sich anfühlt wie etwas, das wir selbst verwenden würden. Die KI bringt uns 80 % ans Ziel. Die letzten 20 % sind rein menschliches Urteilsvermögen.
Häufig gestellte Fragen
Wird die Gewinnquote berechnet?
Ja. Die Gewinnquote ist die Anzahl profitabler Trades geteilt durch die Gesamtanzahl der Trades. Das Dashboard aktualisiert sich nach jedem neuen Handelseintrag.
Kann ich Provisionen erfassen?
Ja. Fuegen Sie Provisionskosten pro Trade hinzu. Sie werden vom Gewinn abgezogen oder zum Verlust fuer jede Position addiert.
Werden Leerverkaeufe unterstuetzt?
Ja. Fuer Short-Trades geben Sie den Leerverkaufspreis als Einstieg und den Eindeckungspreis als Ausstieg ein. Die GuV-Berechnung funktioniert korrekt fuer beide Richtungen.
Kann ich die Performance nach Ticker sehen?
Filtern oder sortieren Sie nach Ticker, um alle Trades in einer einzelnen Aktie zu sehen. Dies hilft zu erkennen, welche Ticker am profitabelsten sind.
Wie öffne ich diese Vorlage in Google Sheets?
Laden Sie die .xlsx-Datei auf Google Drive hoch und öffnen Sie sie mit Google Sheets. Alle Formeln und Formatierungen bleiben erhalten.
Weitere Essentials-Vorlagen: Investieren & Handel
Highlights:
Auf der Suche nach Premium-Tabellenvorlagen?
Unsere kostenpflichtigen Vorlagen umfassen erweiterte mehrseitige Dashboards, native Excel-Diagramme und laufende Aktualisierungen.
Holen Sie sich stattdessen jede Ultimate-Vorlage
Alle 58 Ultimate-Vorlagen in einem Kauf für $299 - $1,102 Wert, Sie behalten $803.