Free NPV & IRR Calculator
Spreadsheet Template
Upgrade your template
Here is how you unlock a better version.
Essentials
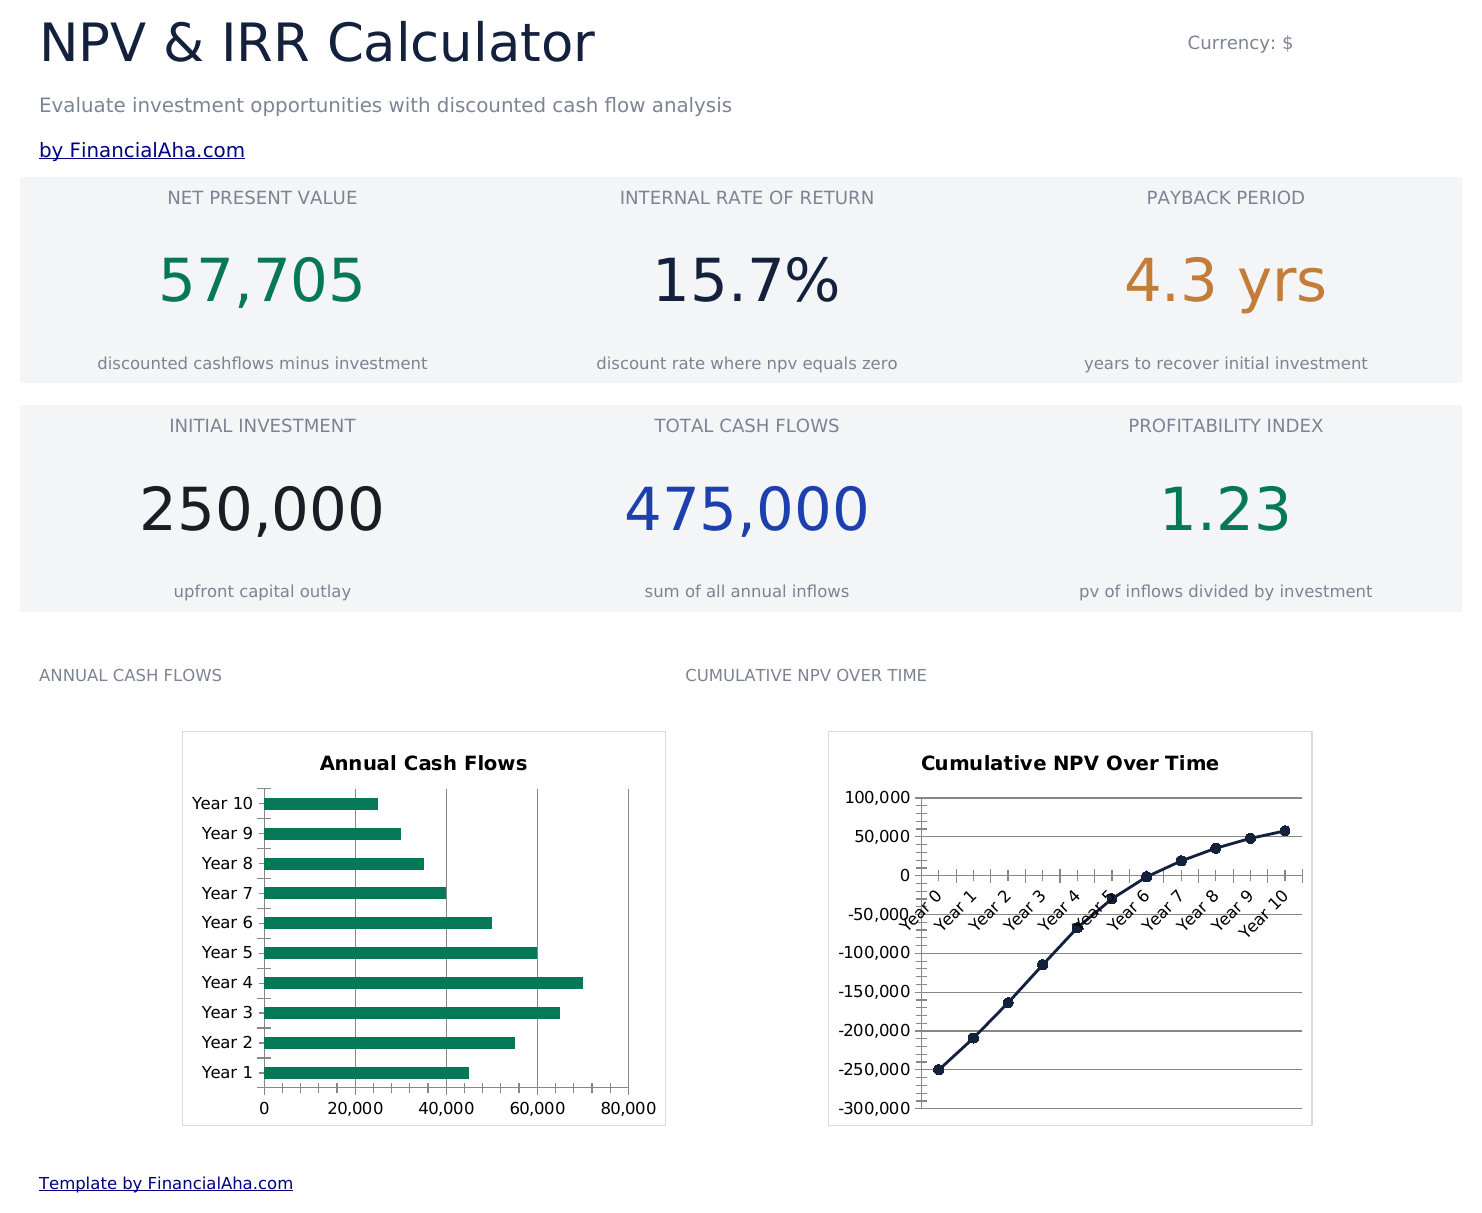
- Dashboard with NPV and IRR results displaying the net present value, internal rate of return, and payback period
- Cash flow entry by period with columns for year, description, cash inflow, cash outflow, and net cash flow
- Discount rate input field that adjusts the NPV calculation to reflect your required rate of return on the investment
$12 one-time
View Essentials$12 › Ultimate Most complete
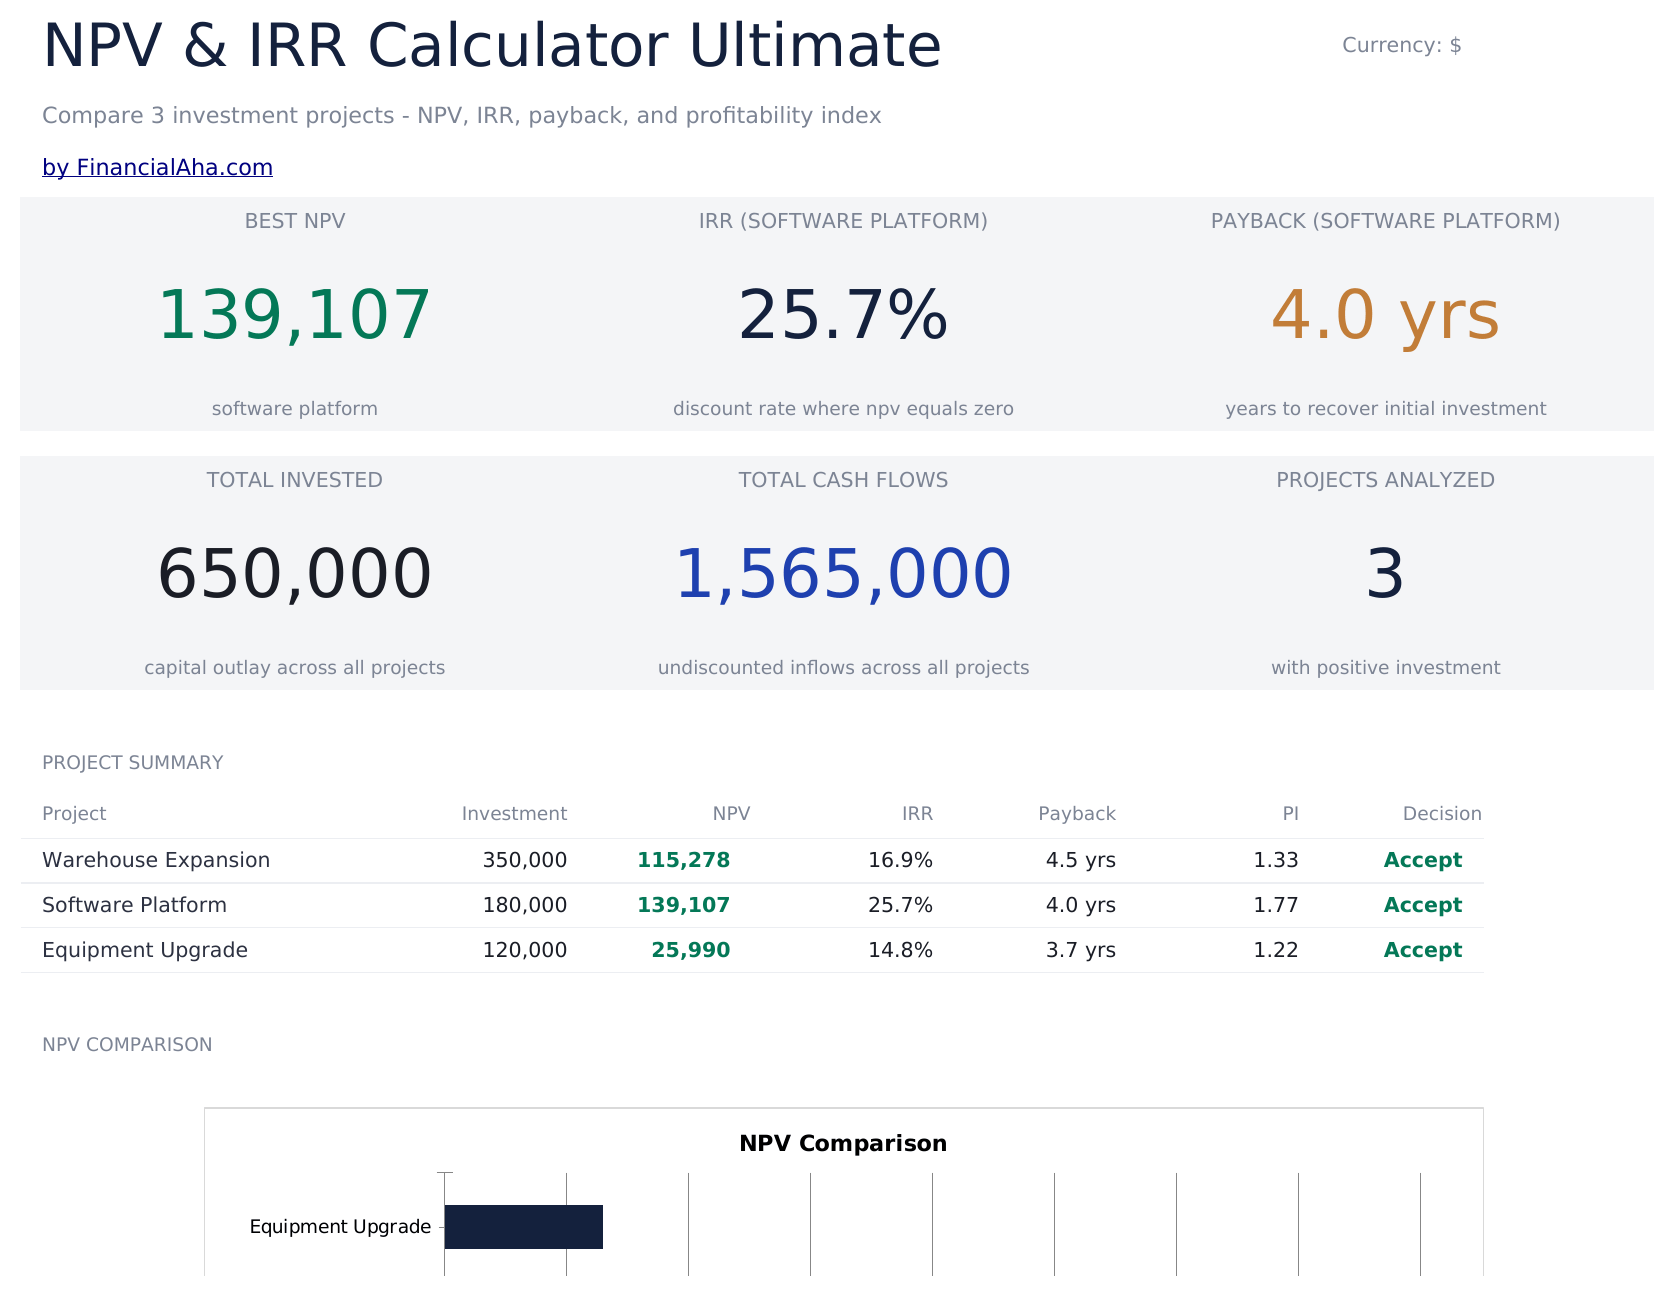
- Compare up to 3 investment projects side by side with independent cash flow projections
- Each project has a dedicated sheet with 15-year cash flow table, discount factors, present values, and cumulative PV
- Dashboard with portfolio KPIs: best NPV, project count, total invested, and a summary table with Accept/Reject decisions
$19 one-time
View Ultimate$19› Download Free Template
We will send you the download link for the spreadsheet template via email in a moment.
Works in Excel and Google Sheets · CC BY 4.0
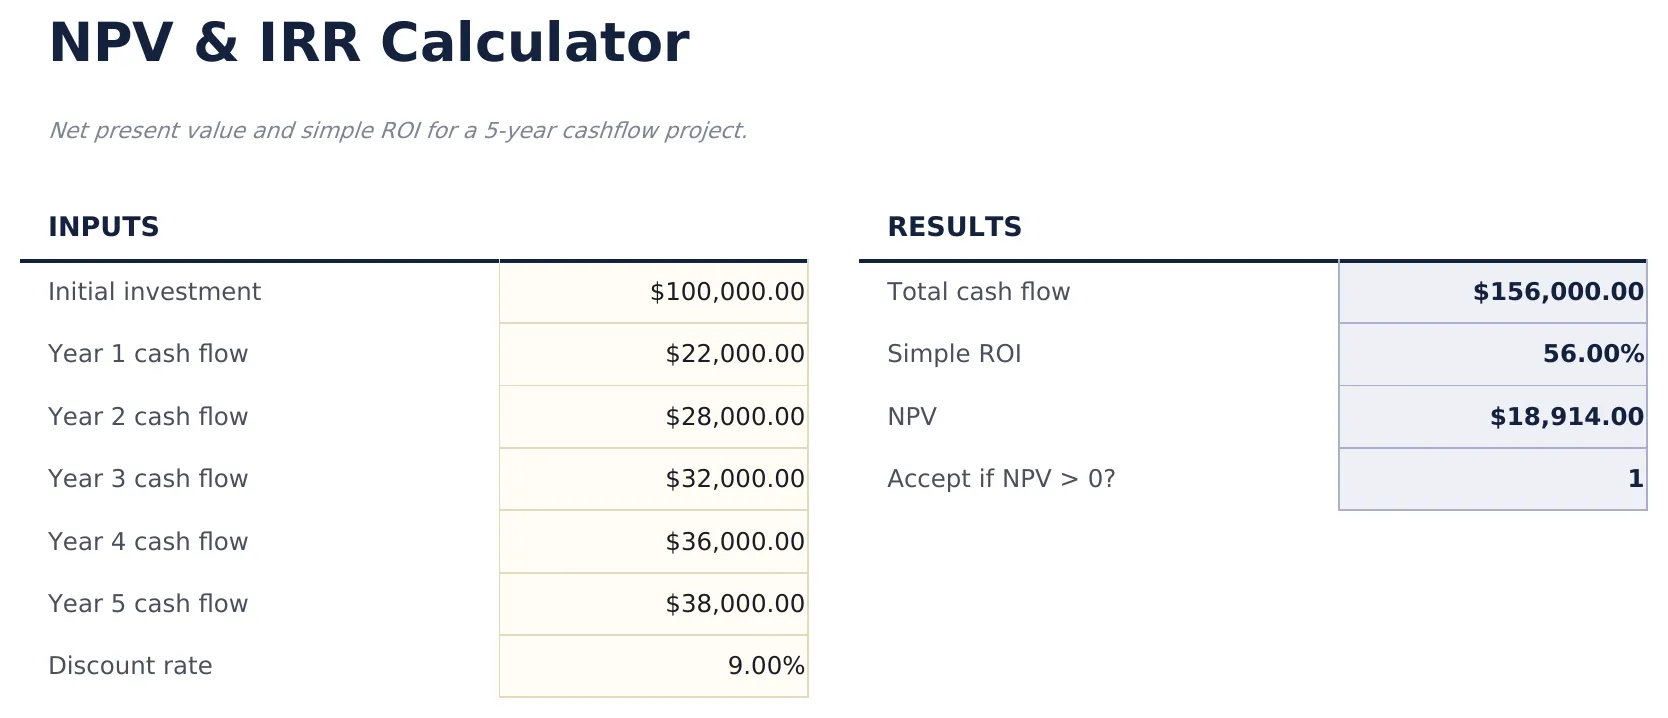
- "NPV and IRR" sheet with clearly labeled input cells at the top
- Live formulas - every result recalculates as you tweak inputs
- Compact output table so you can scan results without scrolling
- Step-by-step "How to Use" guide included in a second sheet
- Works in Microsoft Excel, Google Sheets, and LibreOffice Calc - no setup or sign-up