NPV- en IRR-calculator Essentials-sjabloon
Bereken de netto contante waarde en het interne rendement voor investeringsprojecten. Voer kasstromen en een disconteringsvoet in om potentiele investeringen te evalueren.
Wat zit erin
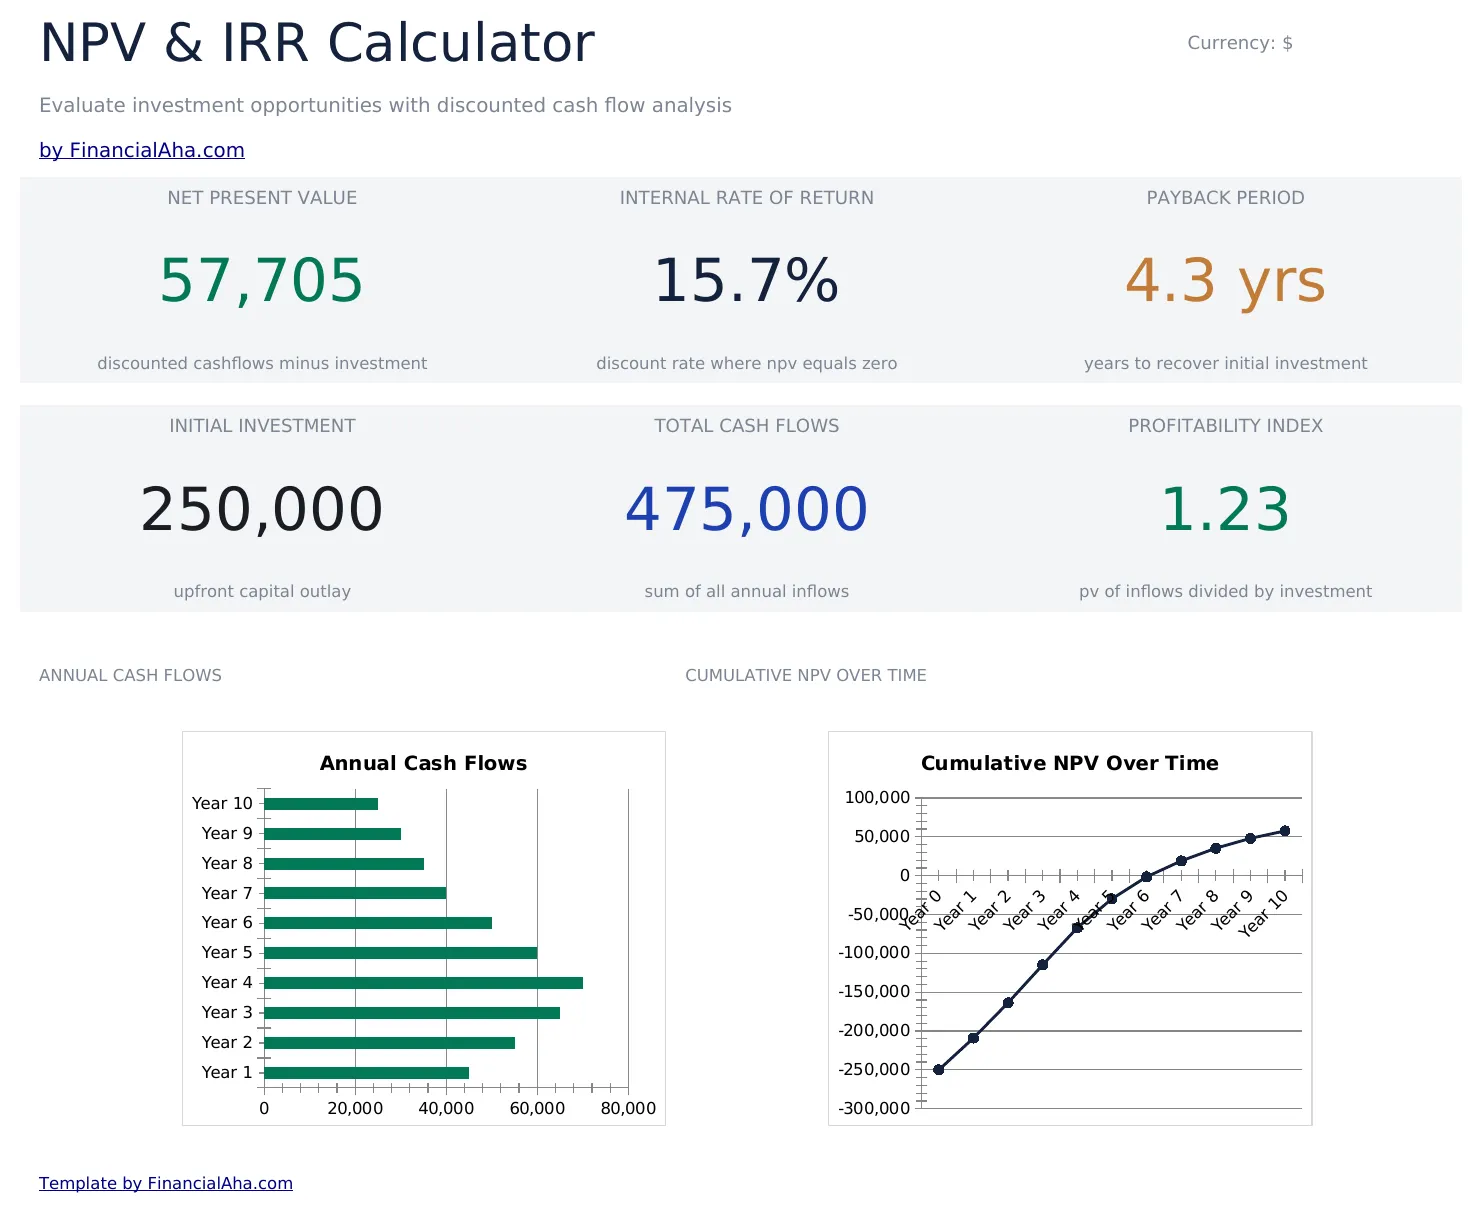
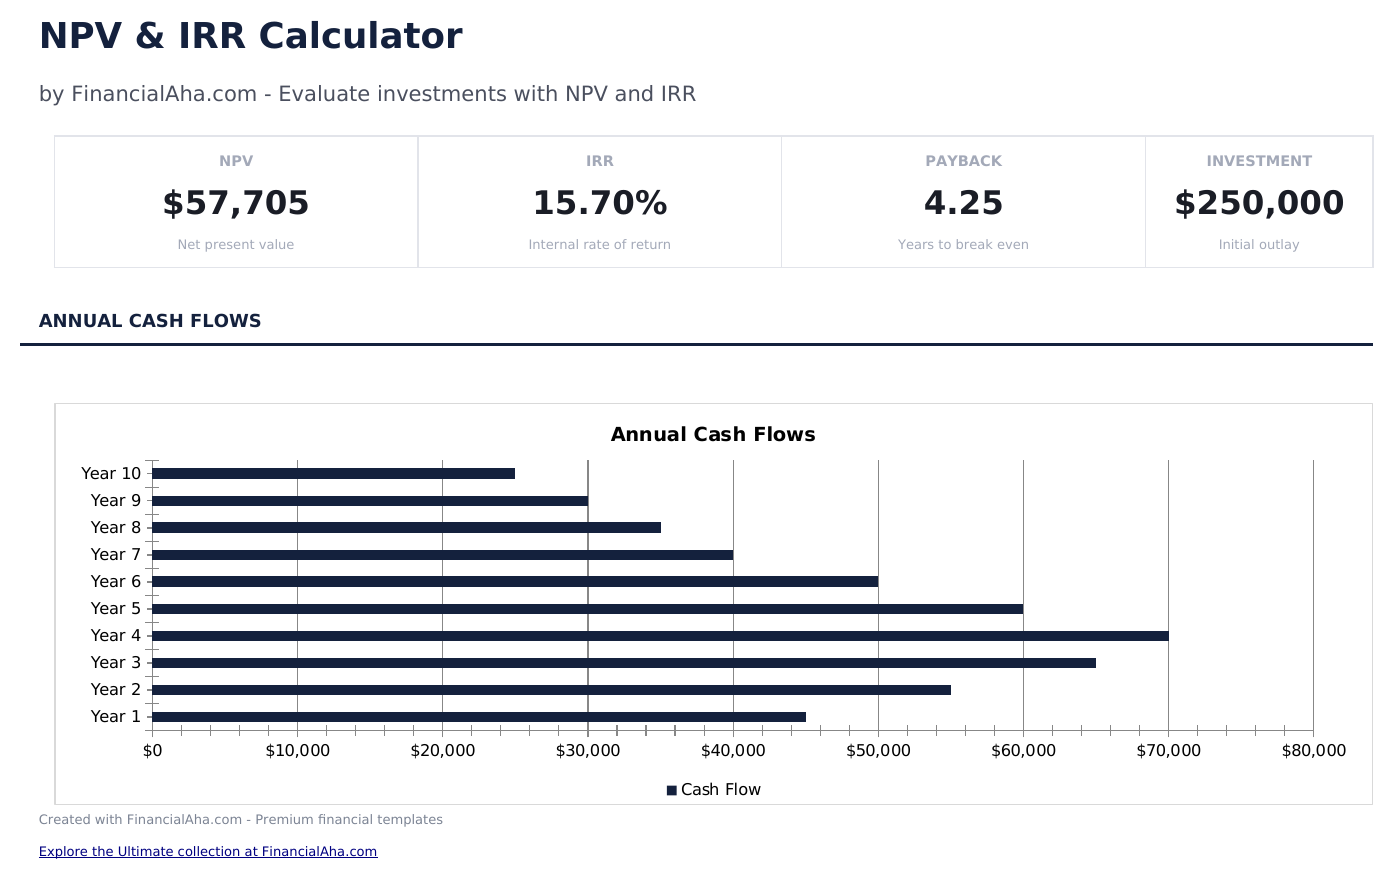
- Dashboard met NPV- en IRR-resultaten met de netto contante waarde, het interne rendement en de terugverdientijd
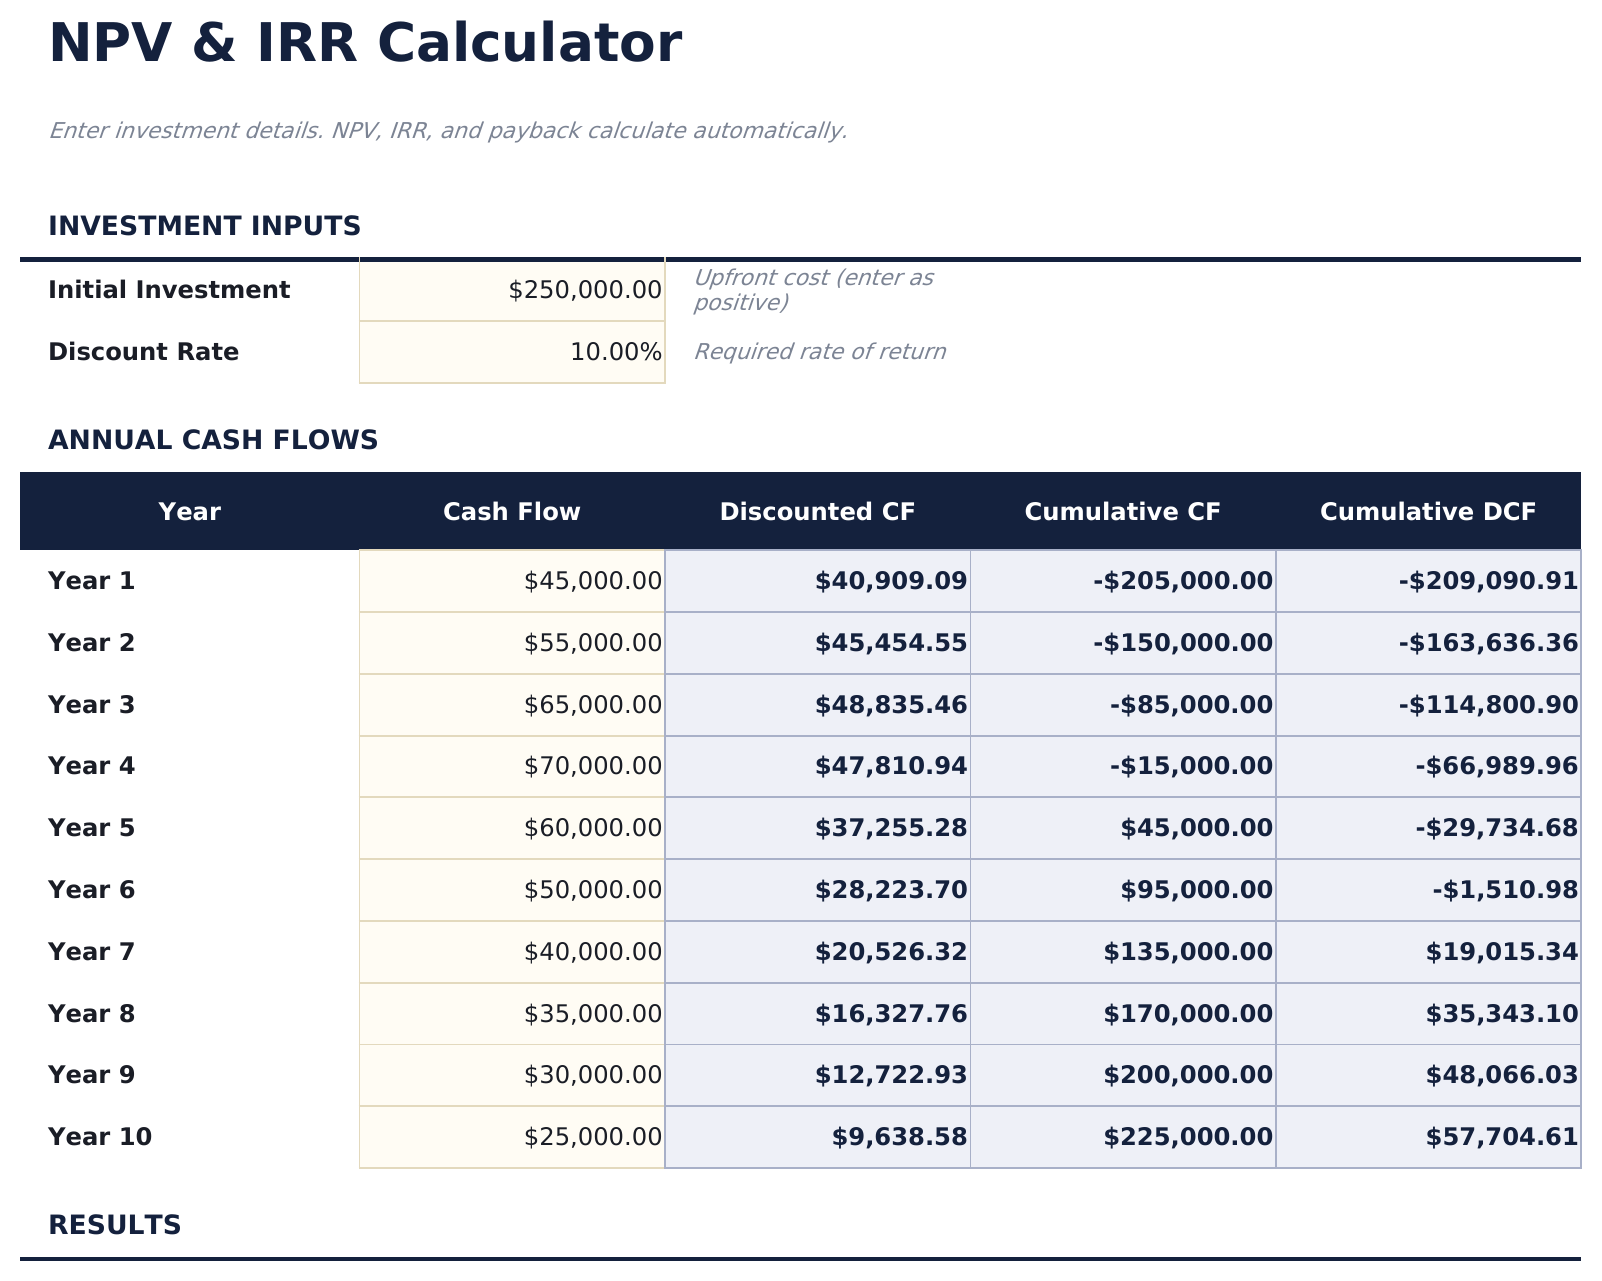
- Kasstrominvoer per periode met kolommen voor jaar, omschrijving, kasinkomsten, kasuitgaven en netto kasstroom
- Invoerveld voor disconteringsvoet dat de NPV-berekening aanpast aan uw vereist rendement op de investering
- Automatische NPV-berekening met de Excel NPV-formule toegepast op de netto kasstroomreeks tegen de opgegeven disconteringsvoet
- IRR-berekening met kleurgecodeerde invoercellen (geel) en automatisch berekende investeringsevaluatiemetrieken (blauw)
- Werkt in Microsoft Excel, Google Sheets en LibreOffice Calc zonder installatie
Need more from this template?
The Essentials version covers everyday tracking. Ultimate goes further with multi-entity support, scenario analysis, and ultimate-grade reporting.
- Dashboard met NPV- en IRR-resultaten met de netto contante waarde, het interne rendement en de terugverdientijd
- Kasstrominvoer per periode met kolommen voor jaar, omschrijving, kasinkomsten, kasuitgaven en netto kasstroom
- Invoerveld voor disconteringsvoet dat de NPV-berekening aanpast aan uw vereist rendement op de investering
- Automatische NPV-berekening met de Excel NPV-formule toegepast op de netto kasstroomreeks tegen de opgegeven disconteringsvoet
- Vergelijk tot 3 investeringsprojecten naast elkaar met onafhankelijke cashflowprojecties
- Elk project heeft een eigen werkblad met een 15-jarige cashflowtabel, discontofactoren, contante waarden en cumulatieve CW
- Dashboard met portefeuille-KPI's: beste NPV, aantal projecten, totaal geïnvesteerd en een samenvattingstabel met Accepteren/Afwijzen-beslissingen
- Vergelijkingswerkblad dat alle projecten rangschikt op NPV, terugverdientijd en winstgevendheidsindex
- Gevoeligheidsanalyse die NPV, winstgevendheidsindex en Accepteren/Afwijzen toont bij 9 verschillende discontovoeten per project
Voorbeeld
Bekijk wat er in dit sjabloon zit
Hoe gebruik je dit NPV- en IRR-calculator sjabloon
Voer kasstromen in
Maak een lijst van elke periodieke kasstroom - de initiele investering (negatief) en daaropvolgende inkomsten en uitgaven per jaar.
Stel de disconteringsvoet in
Voer uw vereist rendement of kapitaalkosten in. De NPV-berekening gebruikt deze voet om toekomstige kasstromen te verdisconteren.
Bekijk de NPV
Het dashboard toont de netto contante waarde. Een positieve NPV geeft aan dat de investering meer oplevert dan het vereiste rendement.
Controleer de IRR
Het interne rendement toont het werkelijke rendement dat uit de kasstromen volgt. Vergelijk het met uw disconteringsvoet.
Customer Reviews
What Our Customers Say
"If I get half as good at handling my finances as you are at customer service, this'll be the best $26 I've spent lately."
"Great tool! Simplifies financial planning without the hassle of complex spreadsheets."
"I recently purchased your super convenient spreadsheet, it really helps me!"
"They're great and super intuitive. Thank you!"
Gebouwd door Claude AI. Verfijnd door ons.
We gebruiken Claude AI om elk sjabloon te ontwerpen, na uitgebreid onderzoek. Daarna neemt ons team het over. We verfijnen de indeling, testen elke formule grondig, lossen randgevallen op en polijsten het ontwerp totdat het iets is dat we zelf ook echt zouden gebruiken. De AI brengt ons 80% van de weg. De laatste 20% is puur menselijk oordeel.
Veelgestelde vragen
Wat betekent een positieve NPV?
Een positieve NPV betekent dat het verwachte rendement van de investering hoger is dan uw vereist rendement. Hoe hoger de NPV, hoe meer waarde het project toevoegt.
Hoe verhoudt IRR zich tot de disconteringsvoet?
Als de IRR hoger is dan de disconteringsvoet, haalt de investering uw rendementsdrempel. Als de IRR lager is dan de disconteringsvoet, voldoet het project niet aan uw eis.
Welke disconteringsvoet moet ik gebruiken?
Gebruik uw kapitaalkosten, vereist rendement of alternatieve kosten - het rendement dat u zou kunnen behalen op een alternatieve investering met vergelijkbaar risico.
Kan ik maandelijkse kasstromen invoeren?
De template is ingesteld voor jaarlijkse perioden. Voor maandelijkse kasstromen wijzigt u de periodelabels en gebruikt u een maandelijkse disconteringsvoet (jaarlijkse voet gedeeld door 12).
Hoe open ik dit in Google Sheets?
Upload het .xlsx-bestand naar Google Drive en open het vervolgens met Google Sheets. Alle formules en opmaak blijven behouden.
Meer Essentials-sjablonen voor Beleggen & Handelen
Hoogtepunten:
Op zoek naar premium spreadsheet-sjablonen?
Onze betaalde sjablonen bevatten geavanceerde dashboards met meerdere werkbladen, ingebouwde Excel-grafieken en doorlopende updates.
Krijg in plaats daarvan elk Ultimate sjabloon
Alle 58 Ultimate sjablonen in één aankoop voor $299 - $1,102 waarde, u houdt $803 over.