Calculadora de VPL e TIR Modelo Essentials
Calcule o valor presente líquido e a taxa interna de retorno para projetos de investimento. Insira os fluxos de caixa e uma taxa de desconto para avaliar investimentos potenciais.
O Que Está Incluído
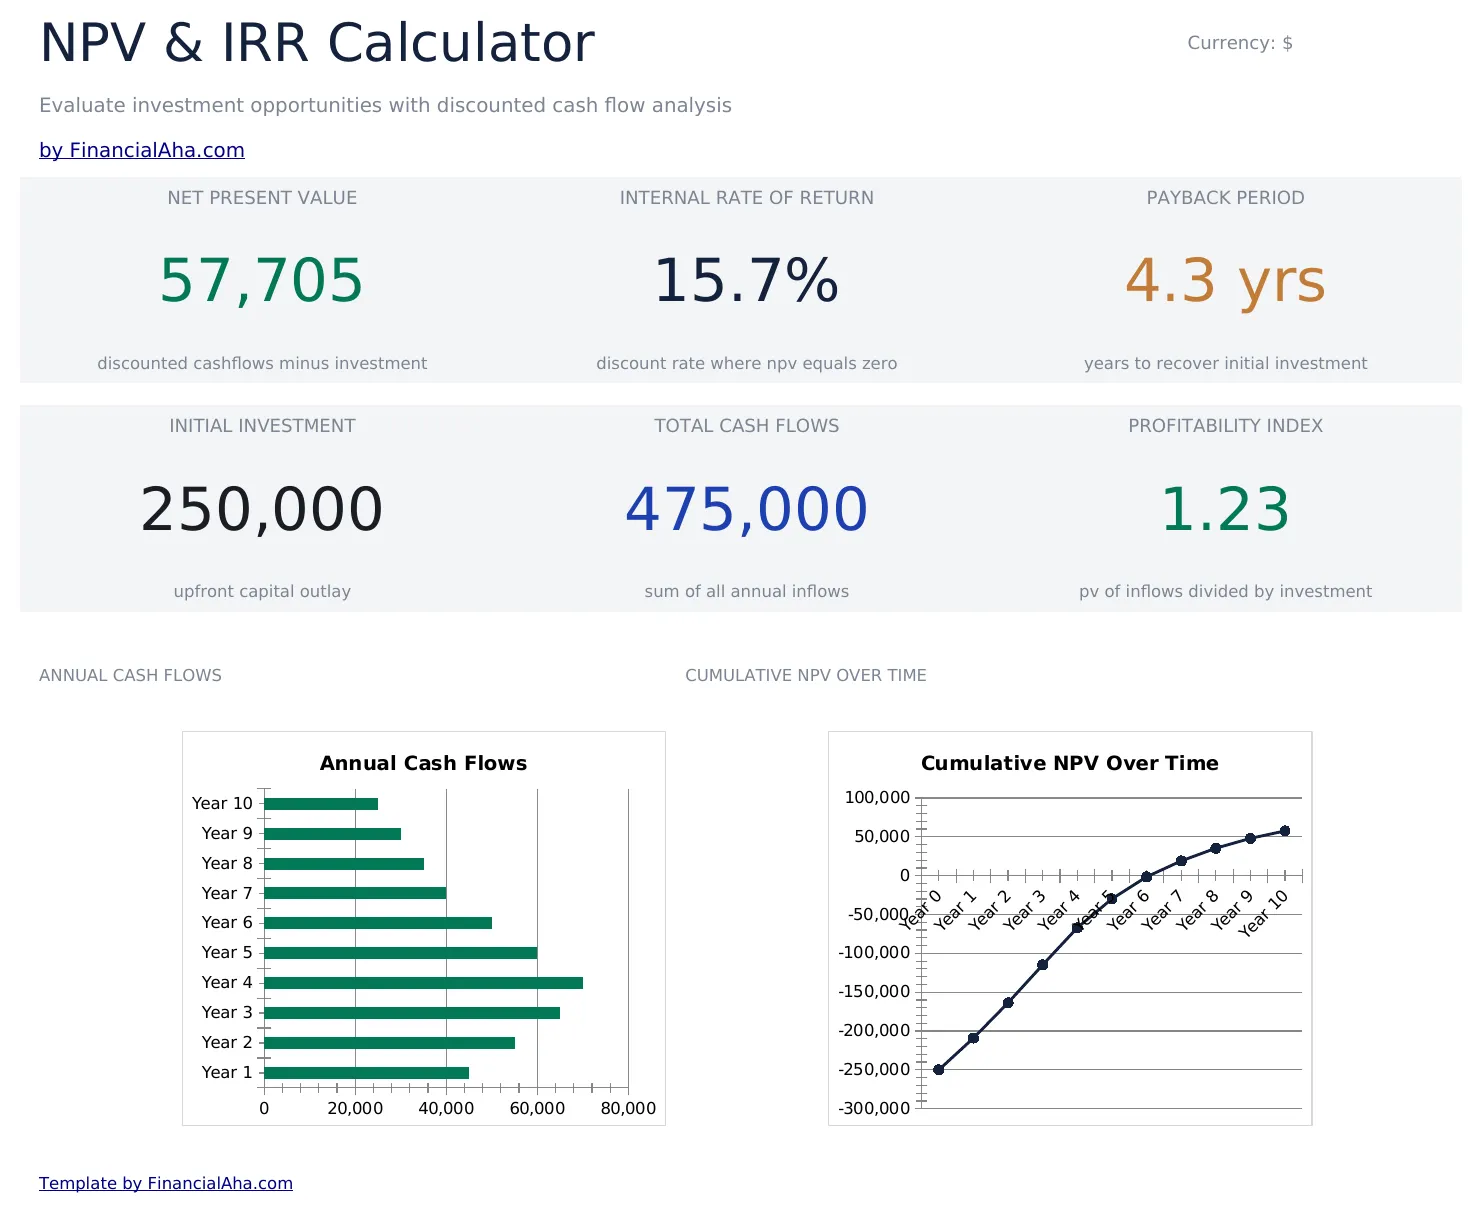
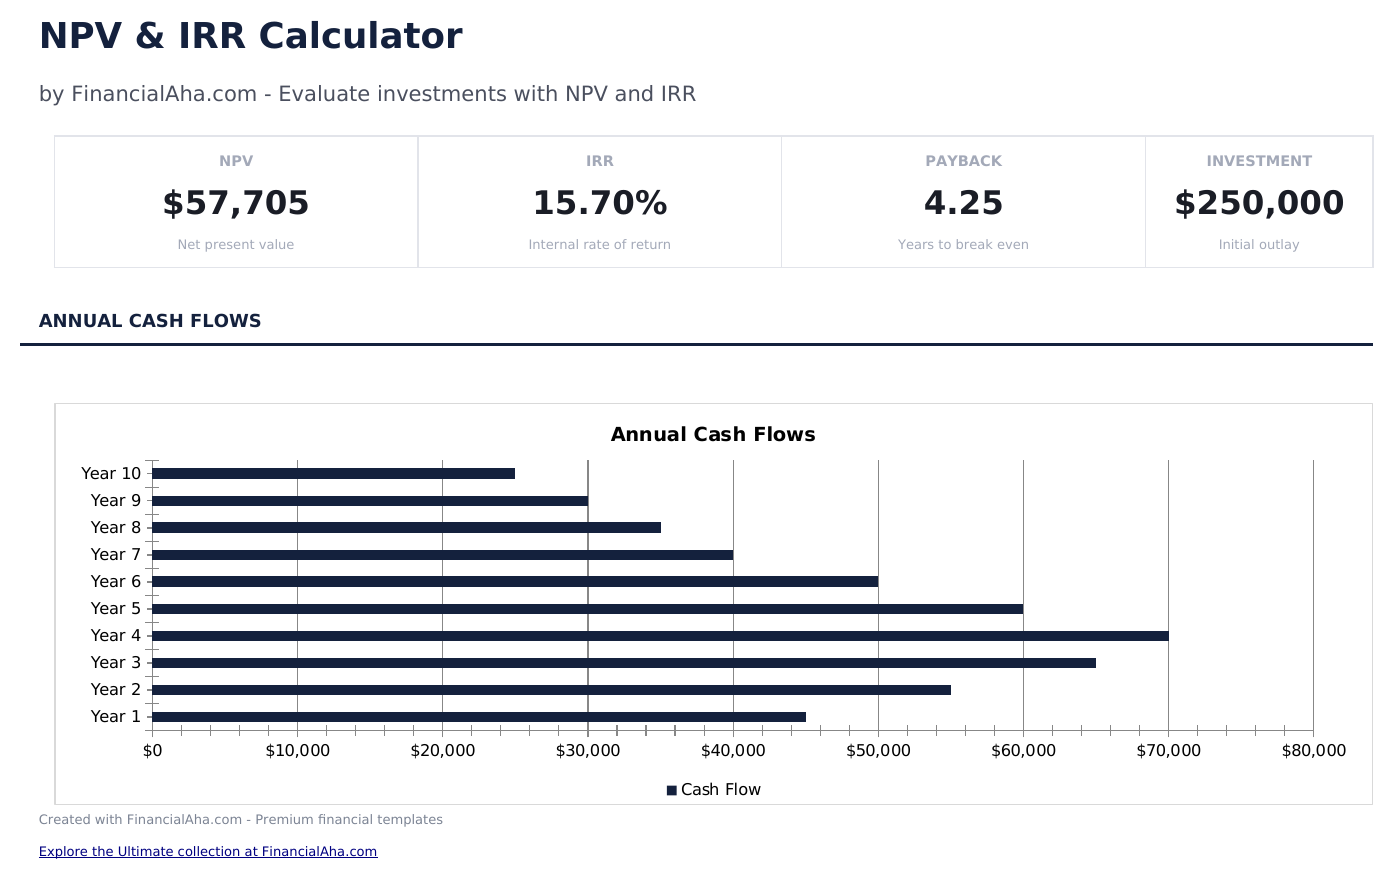
- Painel com resultados de VPL e TIR exibindo o valor presente líquido, a taxa interna de retorno e o período de retorno
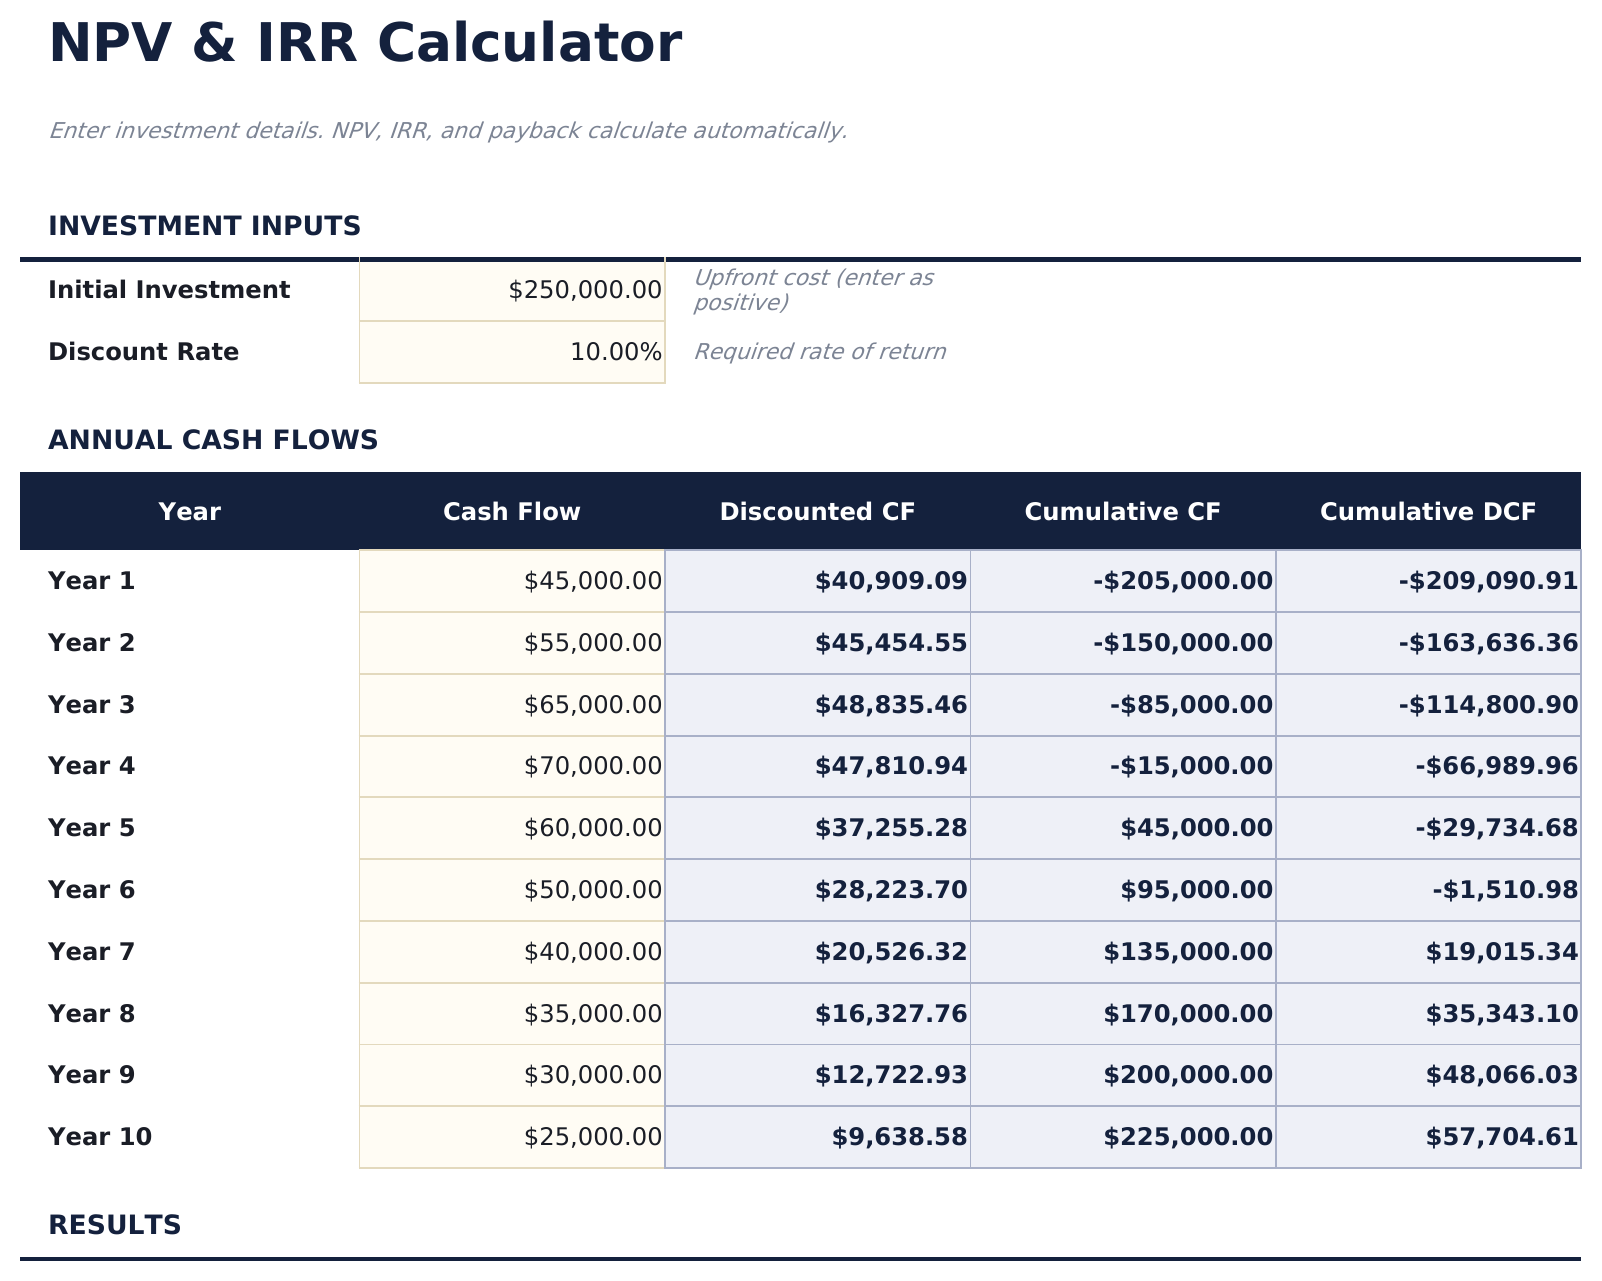
- Entrada de fluxo de caixa por período com colunas para ano, descrição, entrada de caixa, saída de caixa e fluxo de caixa líquido
- Campo de entrada de taxa de desconto que ajusta o cálculo do VPL para refletir sua taxa de retorno necessária no investimento
- Cálculo automático de VPL usando a fórmula NPV do Excel aplicada à série de fluxo de caixa líquido na taxa de desconto especificada
- Cálculo de TIR com células de entrada codificadas por cor (amarelo) e métricas de avaliação de investimento calculadas automaticamente (azul)
- Funciona no Microsoft Excel, Google Sheets e LibreOffice Calc sem necessidade de configuração
Need more from this template?
The Essentials version covers everyday tracking. Ultimate goes further with multi-entity support, scenario analysis, and ultimate-grade reporting.
- Painel com resultados de VPL e TIR exibindo o valor presente líquido, a taxa interna de retorno e o período de retorno
- Entrada de fluxo de caixa por período com colunas para ano, descrição, entrada de caixa, saída de caixa e fluxo de caixa líquido
- Campo de entrada de taxa de desconto que ajusta o cálculo do VPL para refletir sua taxa de retorno necessária no investimento
- Cálculo automático de VPL usando a fórmula NPV do Excel aplicada à série de fluxo de caixa líquido na taxa de desconto especificada
- Compare até 3 projetos de investimento lado a lado com projeções de fluxo de caixa independentes
- Cada projeto tem sua própria aba com tabela de fluxo de caixa de 15 anos, fatores de desconto, valores presentes e PV acumulado
- Painel com KPIs de portfólio: melhor NPV, contagem de projetos, total investido e tabela de resumo com decisões Aceitar/Rejeitar
- Aba de Comparação classificando todos os projetos por NPV, período de payback e índice de rentabilidade
- Análise de sensibilidade mostrando NPV, índice de rentabilidade e Aceitar/Rejeitar em 9 taxas de desconto diferentes por projeto
Pré-visualização
Veja o que tem dentro desta planilha
Como Usar Esta Planilha de Calculadora de VPL e TIR
Insira os fluxos de caixa
Liste cada fluxo de caixa do período - o investimento inicial (negativo) e as entradas e saídas subsequentes por ano.
Defina a taxa de desconto
Digite sua taxa de retorno necessária ou custo de capital. O cálculo do VPL usa essa taxa para descontar fluxos de caixa futuros.
Analise o VPL
O painel exibe o valor presente líquido. Um VPL positivo indica que o investimento retorna mais do que a taxa de retorno necessária.
Verifique a TIR
A taxa interna de retorno mostra a taxa de retorno real implícita pelos fluxos de caixa. Compare-a com sua taxa de desconto.
Customer Reviews
What Our Customers Say
"If I get half as good at handling my finances as you are at customer service, this'll be the best $26 I've spent lately."
"Great tool! Simplifies financial planning without the hassle of complex spreadsheets."
"I recently purchased your super convenient spreadsheet, it really helps me!"
"They're great and super intuitive. Thank you!"
Criadas com Claude AI. Aperfeiçoadas por nós.
Usamos Claude AI para criar cada planilha, após uma pesquisa aprofundada. Depois, nossa equipe entra em ação. Refinamos o layout, testamos exaustivamente cada fórmula, corrigimos casos extremos e polimos o design até que pareça algo que nós mesmos usaríamos. A IA nos leva 80% do caminho. Os últimos 20% são puro julgamento humano.
Perguntas Frequentes
O que significa um VPL positivo?
Um VPL positivo significa que os retornos projetados do investimento excedem sua taxa de retorno necessária. Quanto maior o VPL, mais valor o projeto agrega.
Como a TIR se compara à taxa de desconto?
Se a TIR exceder a taxa de desconto, o investimento atende ao seu limite de retorno. Se a TIR estiver abaixo da taxa de desconto, o projeto não atende ao seu requisito.
Qual taxa de desconto devo usar?
Use seu custo de capital, retorno necessário ou custo de oportunidade - a taxa que você poderia ganhar em um investimento alternativo de risco similar.
Posso inserir fluxos de caixa mensais?
O modelo é configurado para períodos anuais. Para fluxos de caixa mensais, altere os rótulos do período e use uma taxa de desconto mensal (taxa anual dividida por 12).
Como abrir no Google Sheets?
Envie o arquivo .xlsx para o Google Drive e abra com o Google Sheets. Todas as fórmulas e formatações serão preservadas.
Mais modelos Essentials de Investimentos e Negociações
Destaques:
Procurando planilhas premium?
Nossas planilhas pagas incluem painéis avançados com várias abas, gráficos nativos do Excel e atualizações contínuas.
Leve todos os modelos Ultimate
Todos os 58 modelos Ultimate em uma única compra por $299 - valor de $1,102, você fica com $803.