Calcolatore VAN e TIR Modello Essentials
Calcola il valore attuale netto e il tasso interno di rendimento per i progetti di investimento. Inserisci i flussi di cassa e un tasso di sconto per valutare i potenziali investimenti.
Cosa include
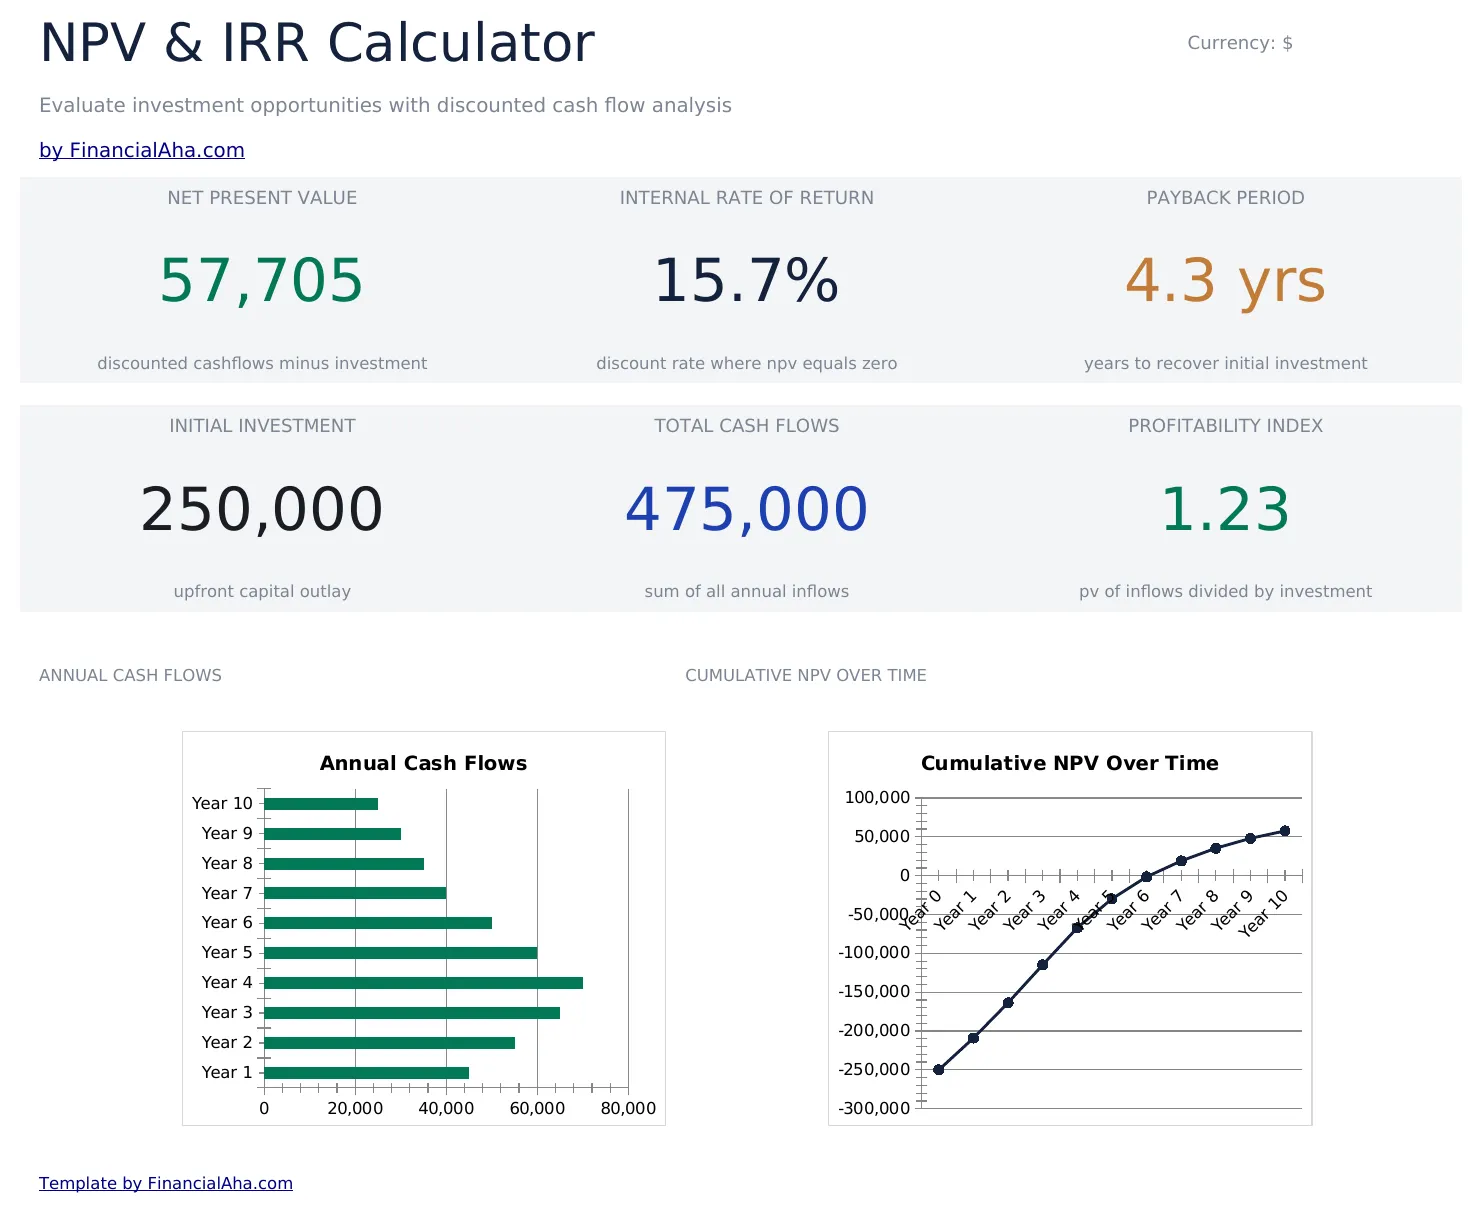
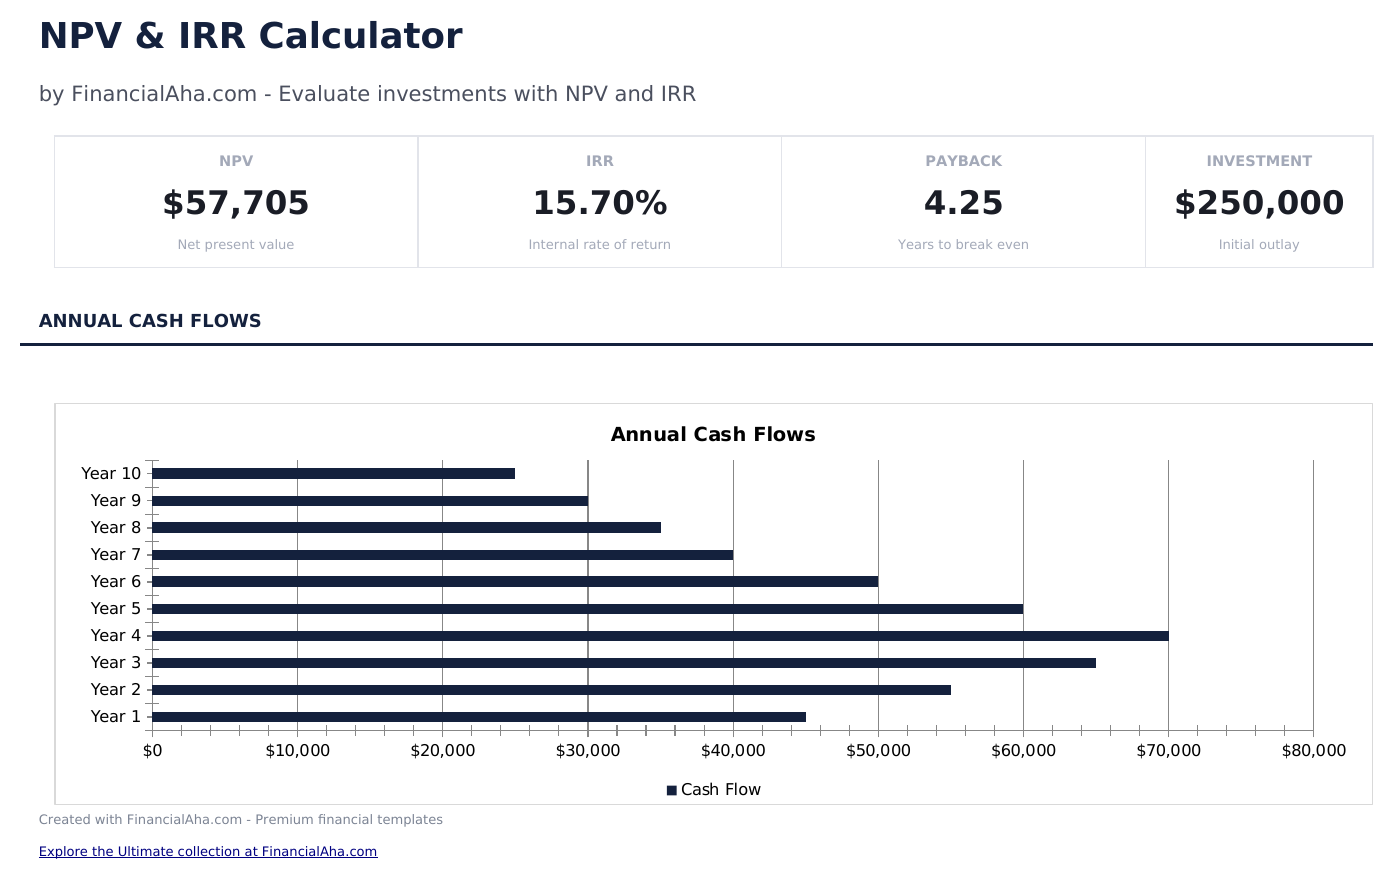
- Dashboard con i risultati di VAN e TIR che mostrano il valore attuale netto, il tasso interno di rendimento e il periodo di recupero
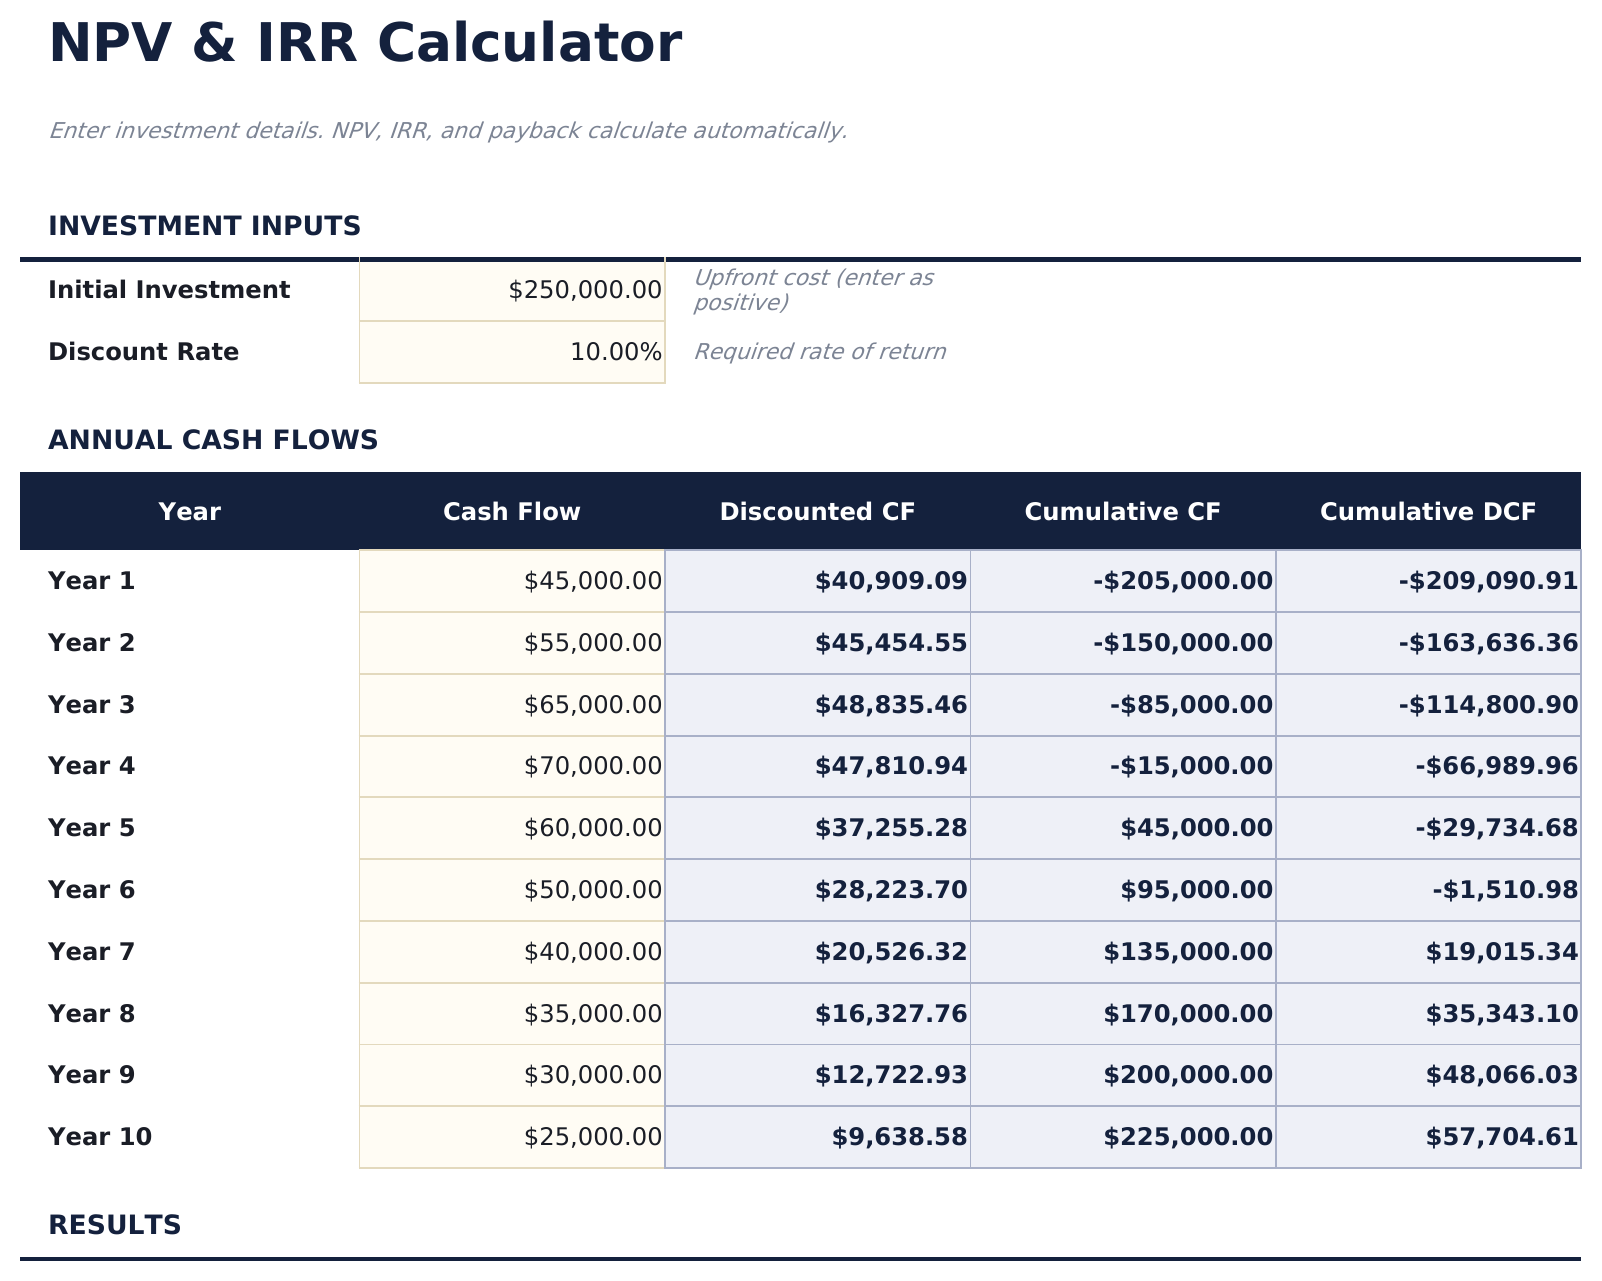
- Inserimento dei flussi di cassa per periodo con colonne per anno, descrizione, entrate di cassa, uscite di cassa e flusso di cassa netto
- Campo di input del tasso di sconto che adegua il calcolo del VAN per riflettere il tasso di rendimento richiesto sull'investimento
- Calcolo automatico del VAN utilizzando la formula NPV di Excel applicata alla serie di flussi di cassa netti al tasso di sconto specificato
- Calcolo del TIR con celle di input con codice colore (giallo) e metriche di valutazione dell'investimento calcolate automaticamente (blu)
- Funziona in Microsoft Excel, Google Sheets e LibreOffice Calc senza alcuna configurazione richiesta
Need more from this template?
The Essentials version covers everyday tracking. Ultimate goes further with multi-entity support, scenario analysis, and ultimate-grade reporting.
- Dashboard con i risultati di VAN e TIR che mostrano il valore attuale netto, il tasso interno di rendimento e il periodo di recupero
- Inserimento dei flussi di cassa per periodo con colonne per anno, descrizione, entrate di cassa, uscite di cassa e flusso di cassa netto
- Campo di input del tasso di sconto che adegua il calcolo del VAN per riflettere il tasso di rendimento richiesto sull'investimento
- Calcolo automatico del VAN utilizzando la formula NPV di Excel applicata alla serie di flussi di cassa netti al tasso di sconto specificato
- Confrontare fino a 3 progetti di investimento affiancati con proiezioni di flussi di cassa indipendenti
- Ogni progetto dispone di un foglio dedicato con tabella dei flussi di cassa a 15 anni, fattori di sconto, valori attuali e PV cumulativo
- Dashboard con KPI di portafoglio: miglior VAN, conteggio progetti, totale investito e tabella di riepilogo con decisioni Accetta/Rifiuta
- Foglio di confronto che classifica tutti i progetti per VAN, periodo di recupero e indice di redditività
- Analisi di sensibilità mostrando VAN, indice di redditività e Accetta/Rifiuta a 9 diversi tassi di sconto per progetto
Anteprima
Scopri cosa contiene questo modello
Come usare questo modello Calcolatore VAN e TIR
Inserisci i flussi di cassa
Elenca il flusso di cassa di ogni periodo - l'investimento iniziale (negativo) e le successive entrate e uscite per anno.
Imposta il tasso di sconto
Inserisci il tasso di rendimento richiesto o il costo del capitale. Il calcolo del VAN utilizza questo tasso per attualizzare i flussi di cassa futuri.
Verifica il VAN
La dashboard mostra il valore attuale netto. Un VAN positivo indica che l'investimento rende più del tasso richiesto.
Controlla il TIR
Il tasso interno di rendimento mostra il tasso di rendimento effettivo implicito nei flussi di cassa. Confrontalo con il tuo tasso di sconto.
Customer Reviews
What Our Customers Say
"If I get half as good at handling my finances as you are at customer service, this'll be the best $26 I've spent lately."
"Great tool! Simplifies financial planning without the hassle of complex spreadsheets."
"I recently purchased your super convenient spreadsheet, it really helps me!"
"They're great and super intuitive. Thank you!"
Creati da Claude AI. Perfezionati da noi.
Utilizziamo Claude AI per creare ogni modello, dopo una ricerca approfondita. Poi interviene il nostro team. Miglioriamo il layout, testiamo ogni formula, correggiamo i casi limite e rifiniamo il design fino a ottenere qualcosa che useremmo noi stessi. L'AI ci porta all'80%. L'ultimo 20% è tutto giudizio umano.
Domande frequenti
Cosa significa un VAN positivo?
Un VAN positivo significa che i rendimenti previsti dell'investimento superano il tasso di rendimento richiesto. Maggiore è il VAN, più valore aggiunge il progetto.
Come si confronta il TIR con il tasso di sconto?
Se il TIR supera il tasso di sconto, l'investimento supera la soglia di rendimento richiesta. Se il TIR è inferiore al tasso di sconto, il progetto non soddisfa il requisito.
Quale tasso di sconto dovrei usare?
Usa il costo del capitale, il rendimento richiesto o il costo opportunità - il tasso che potresti guadagnare su un investimento alternativo di rischio simile.
Posso inserire flussi di cassa mensili?
Il modello è configurato per periodi annuali. Per flussi di cassa mensili, modifica le etichette dei periodi e usa un tasso di sconto mensile (tasso annuale diviso per 12).
Come posso aprirlo in Google Sheets?
Carica il file .xlsx su Google Drive, poi aprilo con Google Sheets. Tutte le formule e la formattazione saranno conservate.
Altri modelli Essentials Investimenti e Trading
Punti Chiave:
Cerchi modelli di fogli di calcolo premium?
I nostri modelli a pagamento includono dashboard multi-foglio avanzate, grafici nativi Excel e aggiornamenti continui.
Privato e sicuro
I tuoi dati finanziari restano sul tuo dispositivo. Non li vediamo mai.
Scopri di piu →Ottieni invece ogni modello Ultimate
Tutti i 58 modelli Ultimate in un unico acquisto per $299 - valore di $1,102, risparmi $803.