FIRE-rekenmachine Essentials-sjabloon
Bereken doelen voor financiele onafhankelijkheid op basis van jaarlijkse uitgaven en spaartempo. Projecteer wanneer beleggingsinkomen de kosten van levensonderhoud kan dekken.
Wat zit erin
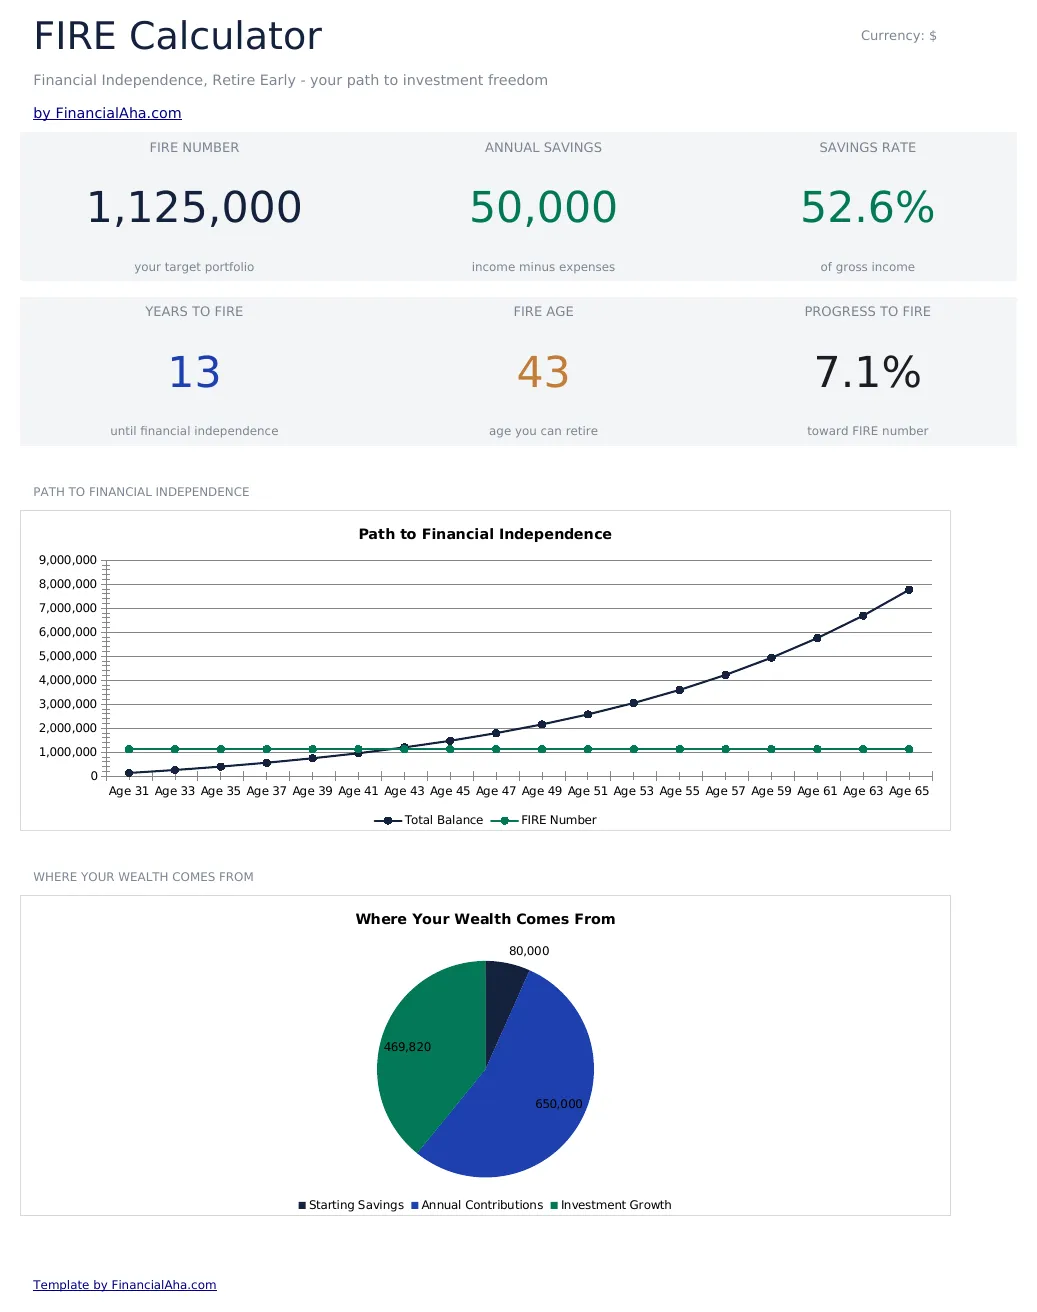
- Dashboard met FIRE-doelbedrag en verwachte tijdlijn naar financiele onafhankelijkheid op basis van huidige invoer
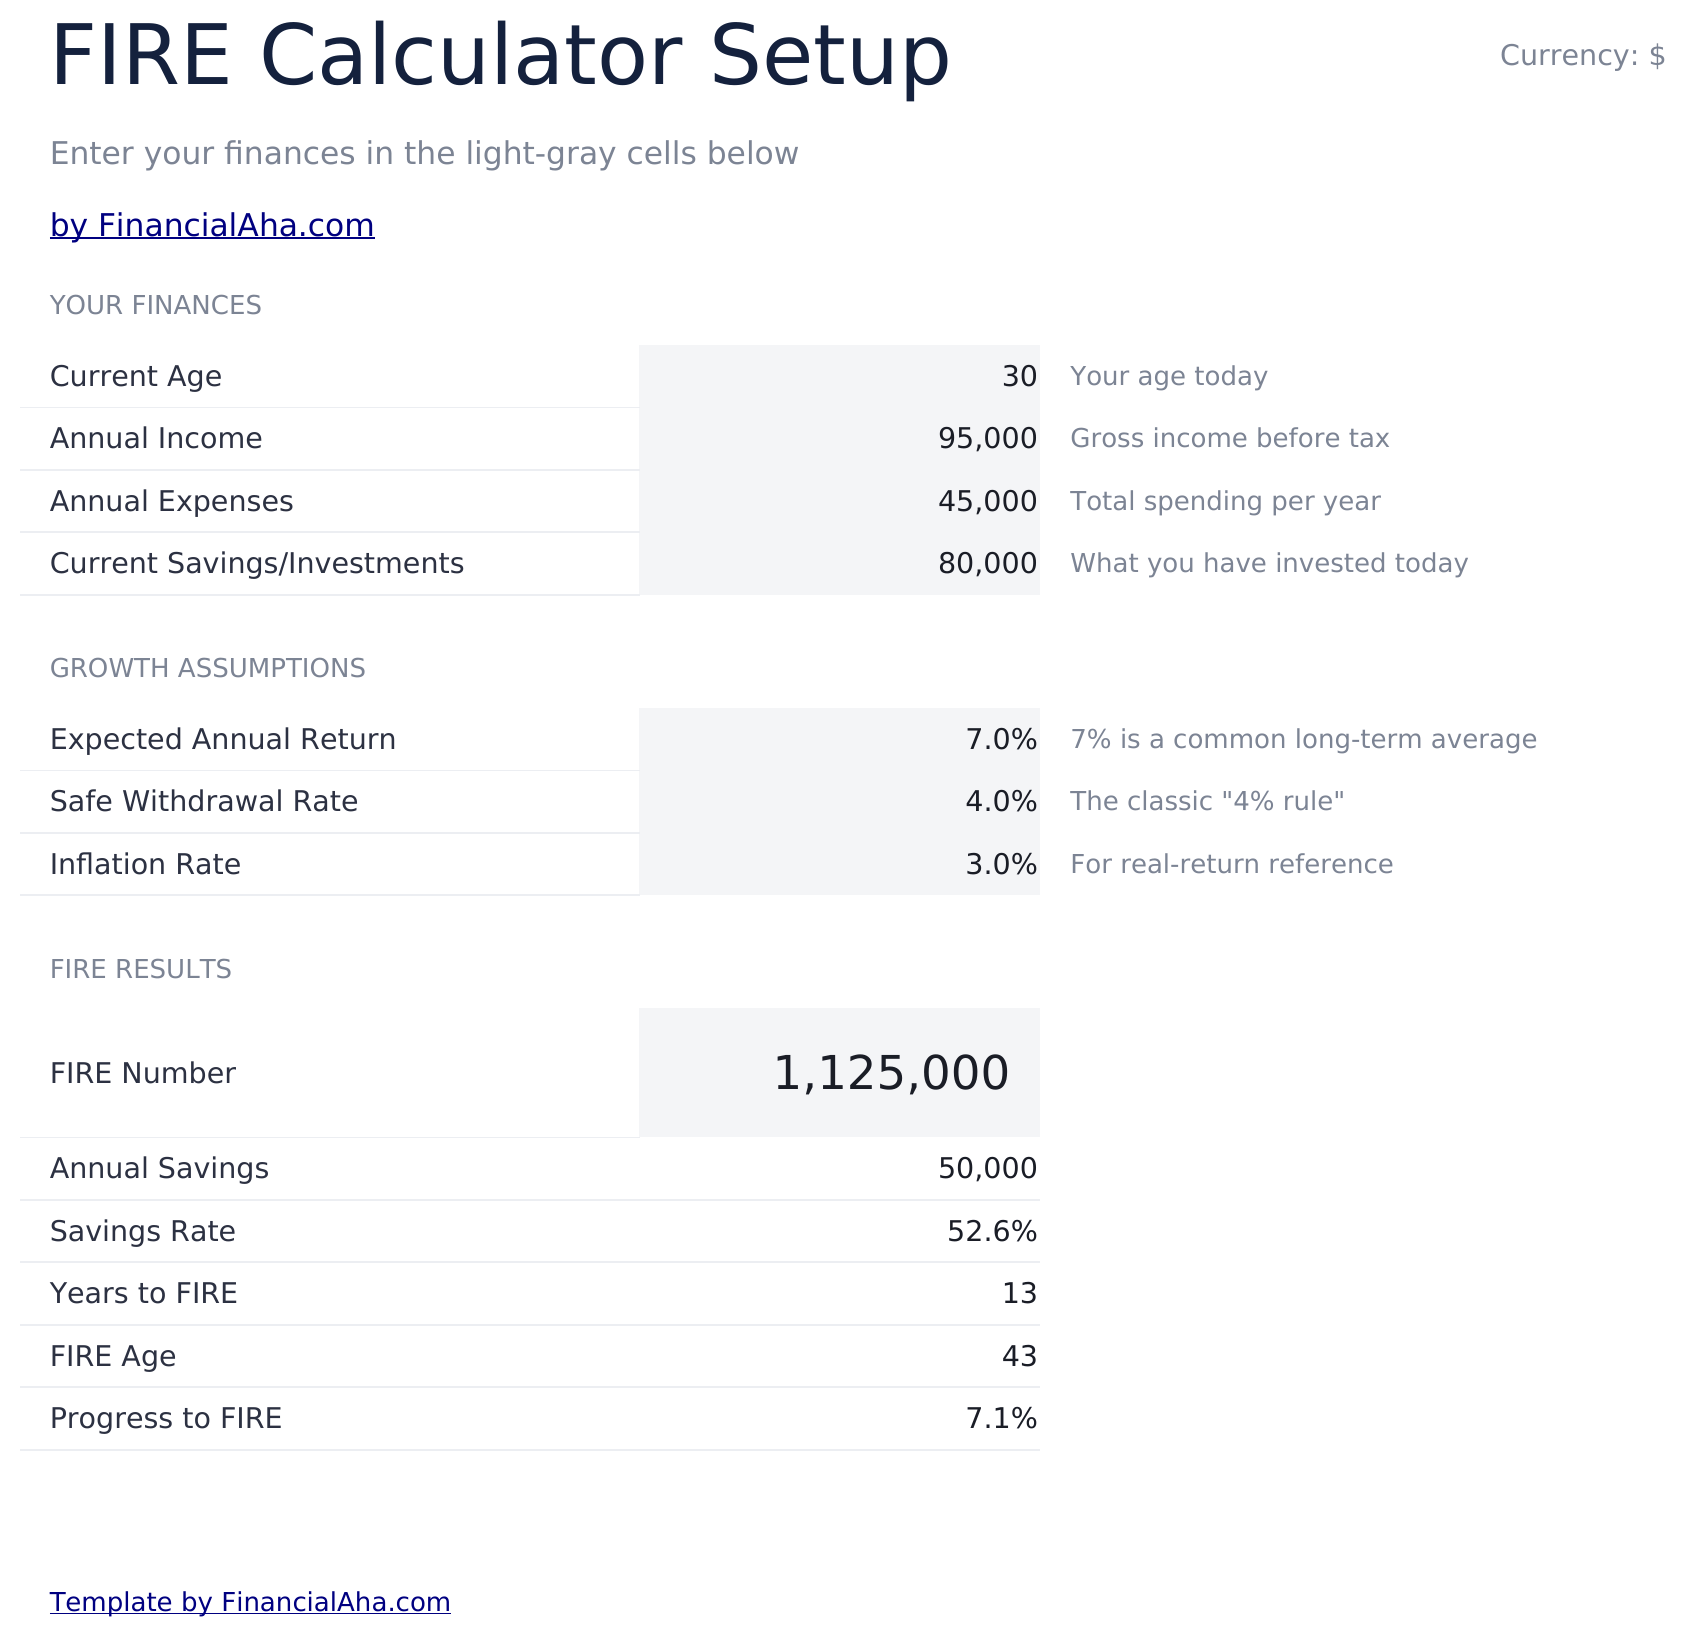
- Calculator met invoervelden voor jaarlijkse uitgaven, huidig spaargeld, jaarlijks inkomen en spaartempo
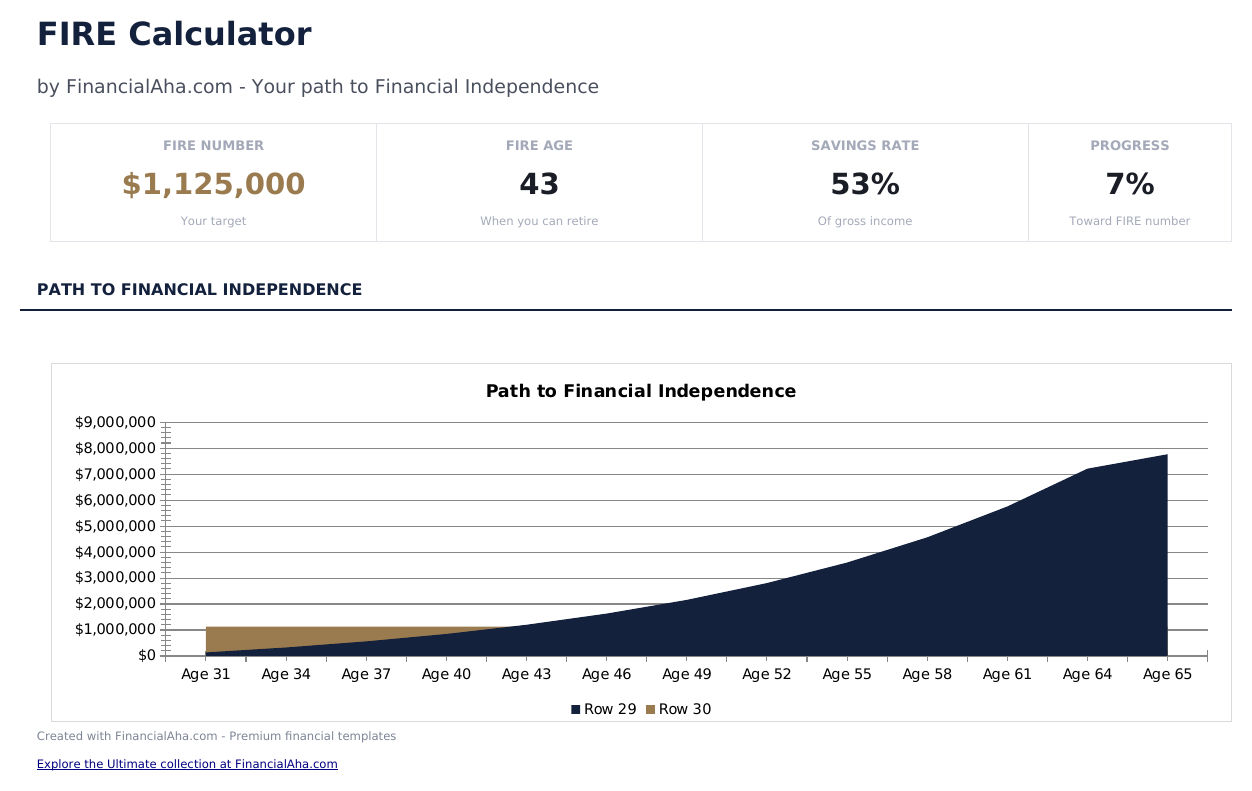
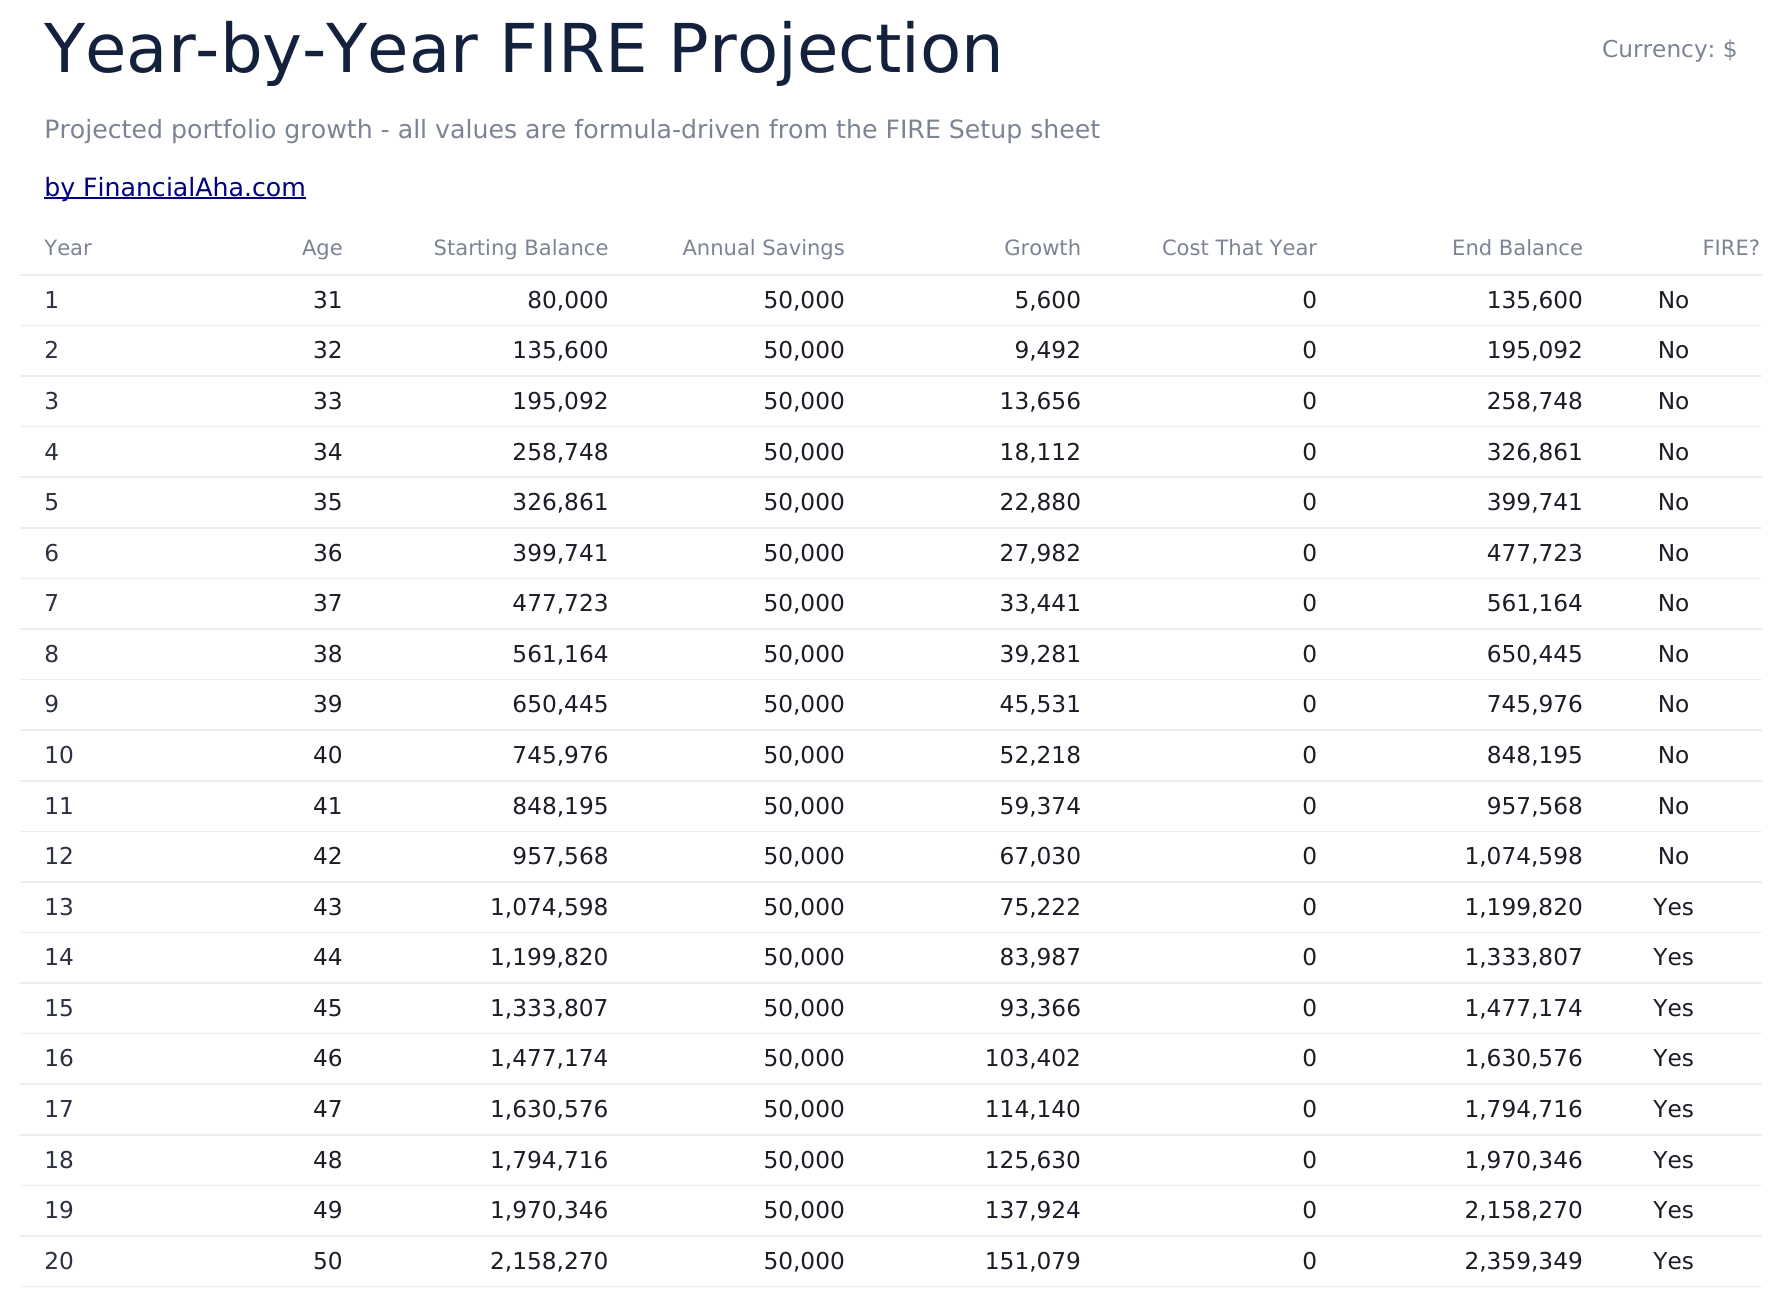
- Beleggingsgroeiprojecties met jaar-op-jaar portefeuillesaldo op het pad naar financiele onafhankelijkheid
- Veilig opnamepercentage-modellering met de 4%-regel en aanpasbare opnamepercentages voor planning
- Meerdere FIRE-doelscenario's waaronder lean, traditioneel en fat FIRE met kleurgecodeerde invoer
- Werkt in Microsoft Excel, Google Sheets en LibreOffice Calc zonder installatie
Need more from this template?
The Essentials version covers everyday tracking. Ultimate goes further with multi-entity support, scenario analysis, and ultimate-grade reporting.
- Dashboard met FIRE-doelbedrag en verwachte tijdlijn naar financiele onafhankelijkheid op basis van huidige invoer
- Calculator met invoervelden voor jaarlijkse uitgaven, huidig spaargeld, jaarlijks inkomen en spaartempo
- Beleggingsgroeiprojecties met jaar-op-jaar portefeuillesaldo op het pad naar financiele onafhankelijkheid
- Veilig opnamepercentage-modellering met de 4%-regel en aanpasbare opnamepercentages voor planning
- Multi-scenario FIRE-doelen die lean, traditioneel, fat en barista FIRE naast elkaar vergelijken
- Dashboard met 6 KPI's: FIRE-getal, jaren tot FIRE, huidig spaarpercentage, portefeuillewaarde, jaarlijkse uitgaven en veilig onttrekkingsbedrag
- Coast FIRE-analyse die toont wanneer je portefeuille zonder extra bijdragen kan groeien naar het FIRE-getal
- Jaar-voor-jaar portefeuilleprojectie met spaargeld, beleggingsgroei en voortgang richting het FIRE-doel
- Onttrekkingspercentagemodellering die 3%, 3,5%, 4% en 4,5% percentages vergelijkt met schattingen van portefeuilleduurzaamheid
Voorbeeld
Bekijk wat er in dit sjabloon zit
Hoe gebruik je dit FIRE-rekenmachine sjabloon
Vul jaarlijkse uitgaven in
Voer je huidige jaarlijkse kosten van levensonderhoud in. Dit bedrag stuurt de FIRE-getalberekening aan op basis van het opnamepercentage.
Voeg spaargeld en inkomen toe
Voer het huidige spaarsaldo, jaarlijks inkomen en je huidige spaartempo in. Het template berekent het verschil tot financiele onafhankelijkheid.
Bekijk FIRE-doelen
Het dashboard toont lean, traditioneel en fat FIRE-getallen op basis van je uitgaven en het geselecteerde opnamepercentage.
Controleer de tijdlijn
Jaar-op-jaar projecties schatten wanneer je portefeuille het FIRE-doel kan bereiken bij je huidige spaar- en beleggingsgroeitempo.
Customer Reviews
What Our Customers Say
"If I get half as good at handling my finances as you are at customer service, this'll be the best $26 I've spent lately."
"Great tool! Simplifies financial planning without the hassle of complex spreadsheets."
"I recently purchased your super convenient spreadsheet, it really helps me!"
"They're great and super intuitive. Thank you!"
Gebouwd door Claude AI. Verfijnd door ons.
We gebruiken Claude AI om elk sjabloon te ontwerpen, na uitgebreid onderzoek. Daarna neemt ons team het over. We verfijnen de indeling, testen elke formule grondig, lossen randgevallen op en polijsten het ontwerp totdat het iets is dat we zelf ook echt zouden gebruiken. De AI brengt ons 80% van de weg. De laatste 20% is puur menselijk oordeel.
Veelgestelde vragen
Wat is het FIRE-getal?
Het FIRE-getal is de portefeuillegrootte die nodig is zodat beleggingsinkomen de kosten van levensonderhoud dekt. Bij de 4%-regel is dit gelijk aan jaarlijkse uitgaven vermenigvuldigd met 25.
Wat is het verschil tussen lean, traditioneel en fat FIRE?
Lean FIRE richt zich op een minimale levensstijl, traditioneel FIRE komt overeen met huidige uitgaven en fat FIRE richt zich op een comfortabelere of duurdere levensstijl.
Kan ik het opnamepercentage wijzigen?
Ja. Het opnamepercentageveld is bewerkbaar. Lagere percentages (3%) vereisen een grotere portefeuille maar zijn mogelijk duurzamer. Hogere percentages (5%) vereisen minder maar brengen meer risico met zich mee.
Houdt het rekening met AOW/staatspensioen?
Niet direct. Als je AOW- of staatspensioeninkomen verwacht, verminder dan je jaarlijkse uitgaveninvoer met dat bedrag om de benodigde portefeuille voor het resterende verschil te zien.
Hoe open ik dit in Google Sheets?
Upload het .xlsx-bestand naar Google Drive en open het vervolgens met Google Sheets. Alle formules en opmaak blijven behouden.
Meer Essentials-sjablonen voor Sparen & Pensioen
Hoogtepunten:
Op zoek naar premium spreadsheet-sjablonen?
Onze betaalde sjablonen bevatten geavanceerde dashboards met meerdere werkbladen, ingebouwde Excel-grafieken en doorlopende updates.
Krijg in plaats daarvan elk Ultimate sjabloon
Alle 58 Ultimate sjablonen in één aankoop voor $299 - $1,102 waarde, u houdt $803 over.