Pensioen Calculator Essentials-sjabloon
Projecteer de groei van pensioensparen op basis van huidige leeftijd, spaartempo en verwacht rendement. Bekijk of huidige bijdragen aansluiten bij pensioentijdlijndoelen.
Wat zit erin
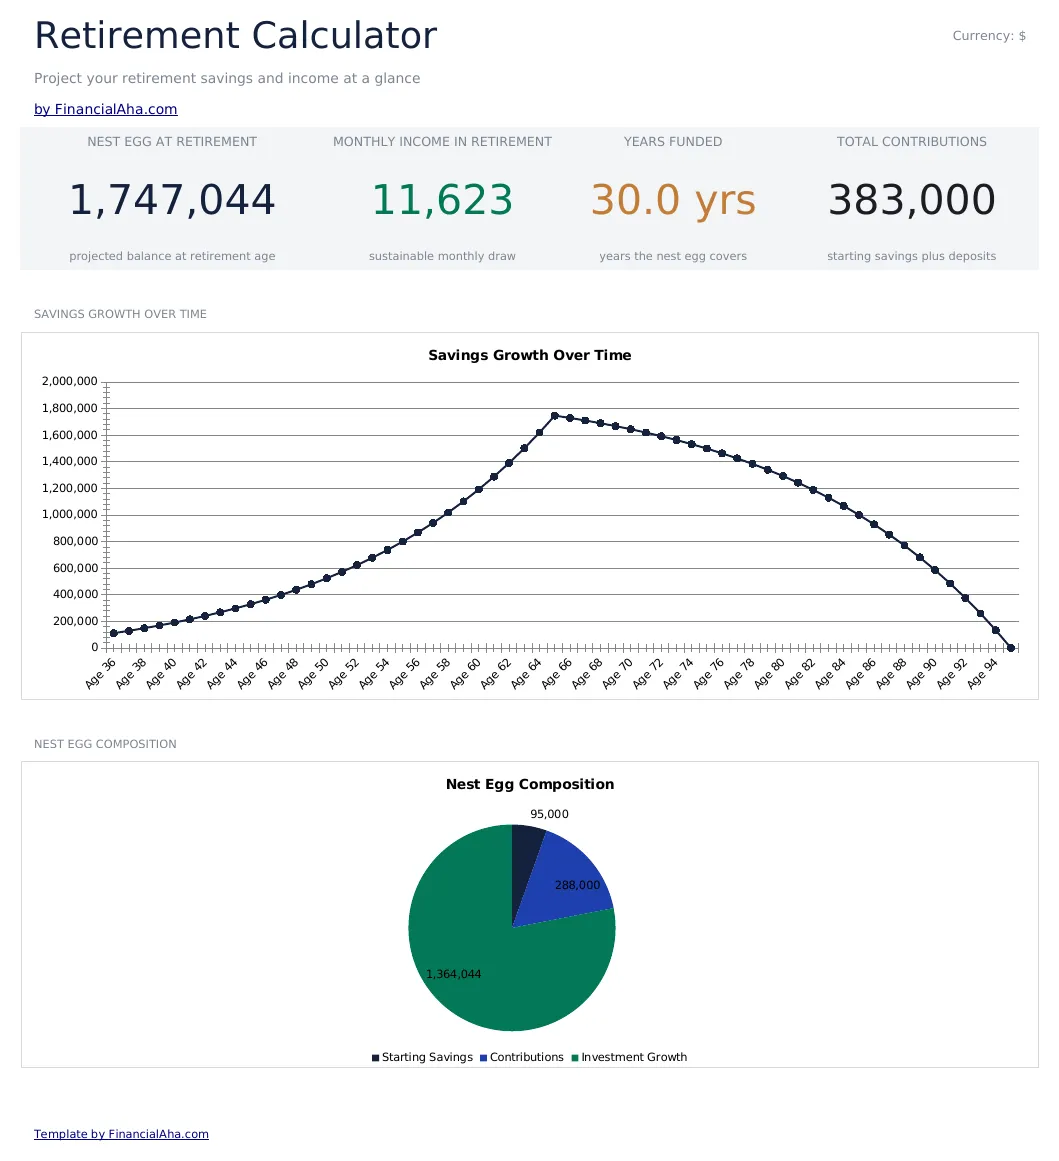
- Dashboard met pensioenprojecties inclusief geschatte portefeuillewaarde op de beoogde pensioenleeftijd
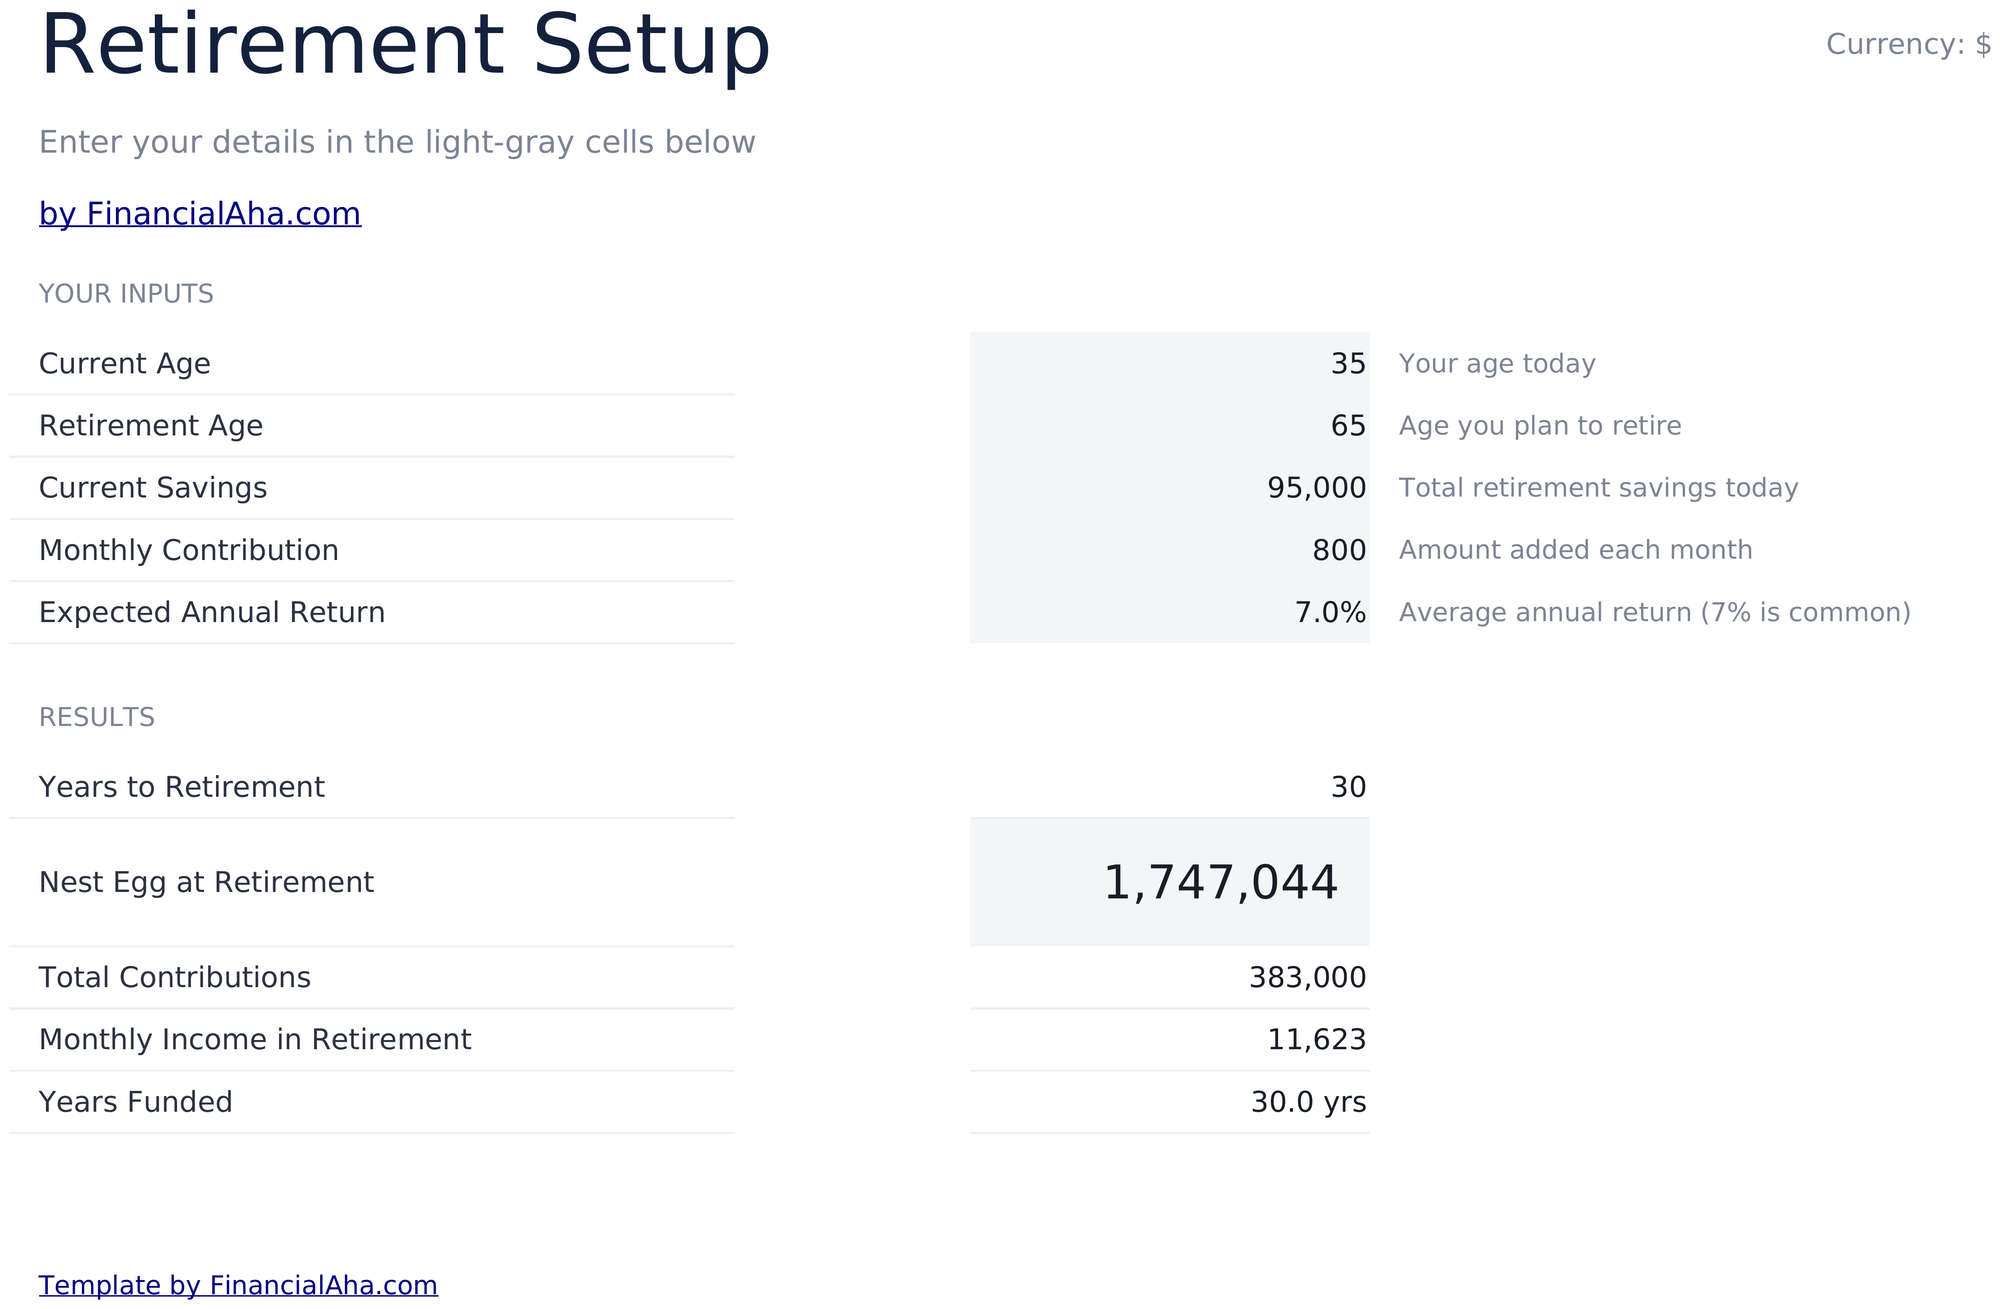
- Pensioen-instellingen met invoervelden voor huidige leeftijd, pensioenleeftijd, huidig spaargeld en jaarlijkse bijdrage
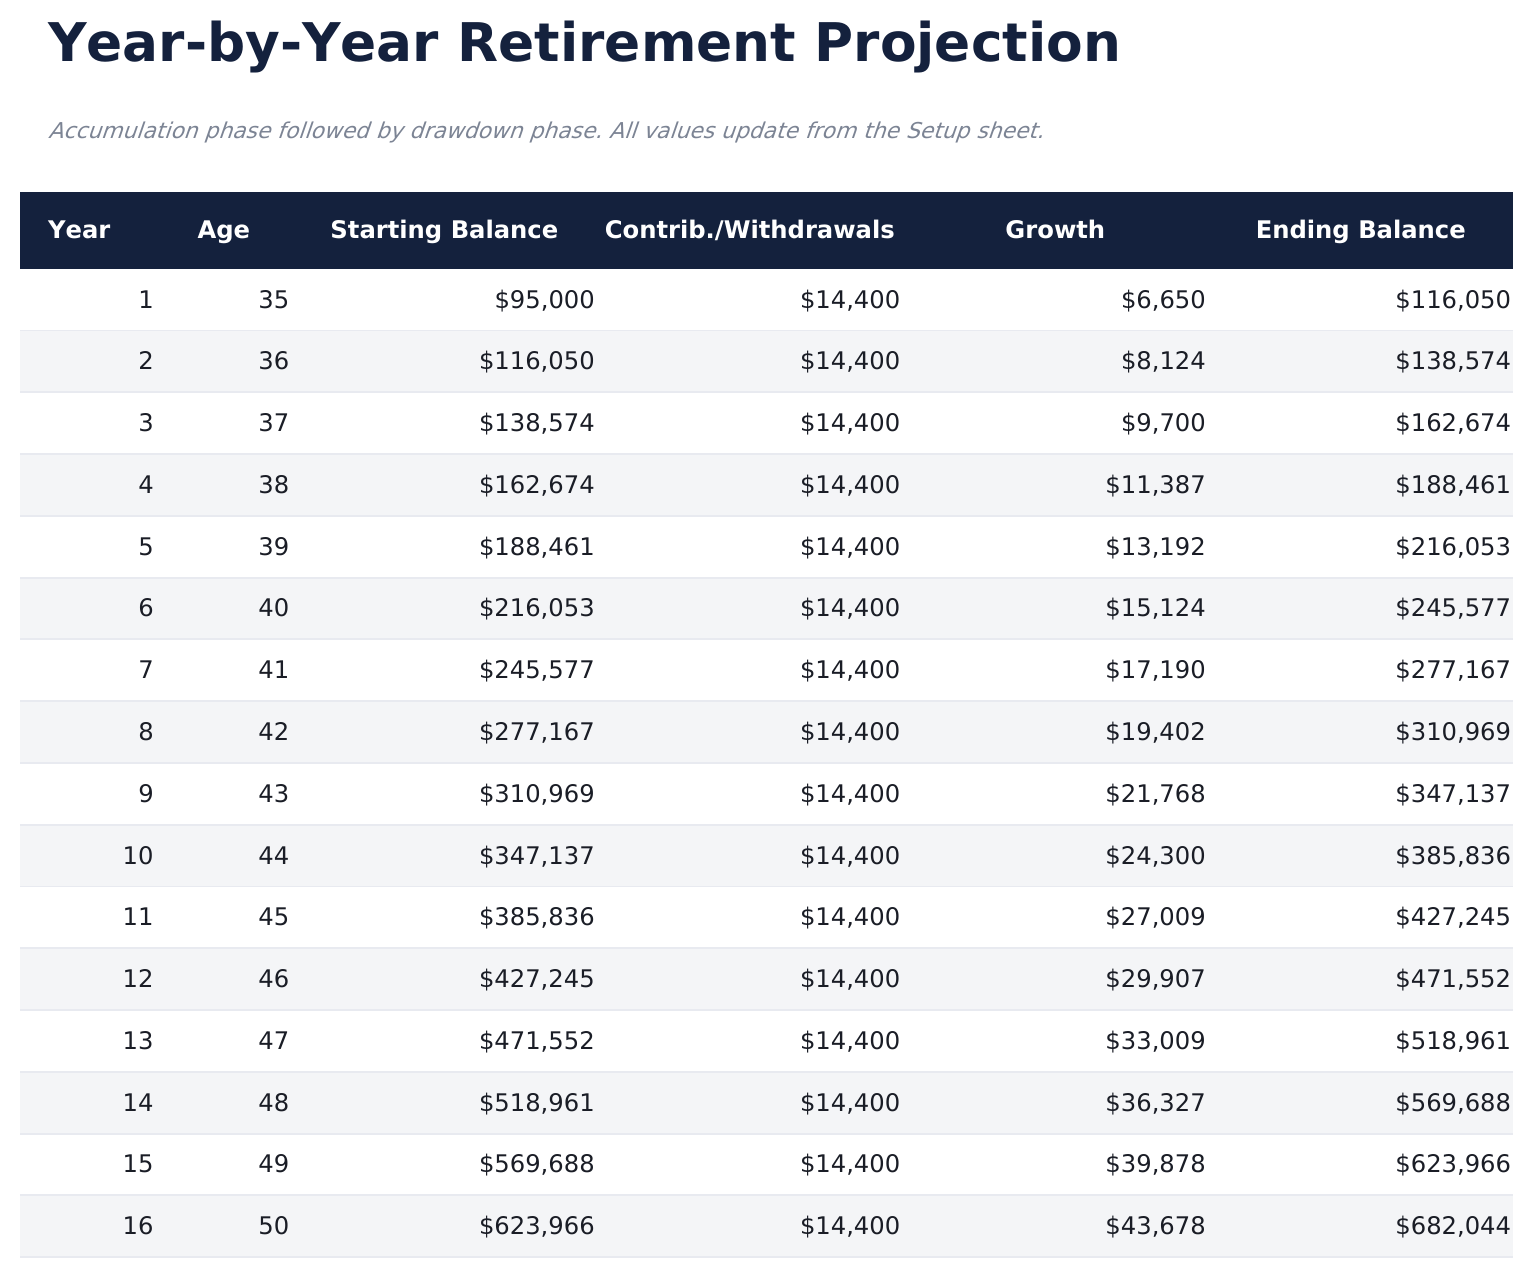
- Jaar-op-jaar projectietabel met jaarlijkse bijdragen, beleggingsgroei en eindsaldo
- Groeipercenta-aannames met aanpasbaar verwacht rendementspercentage voor conservatief of agressief modelleren
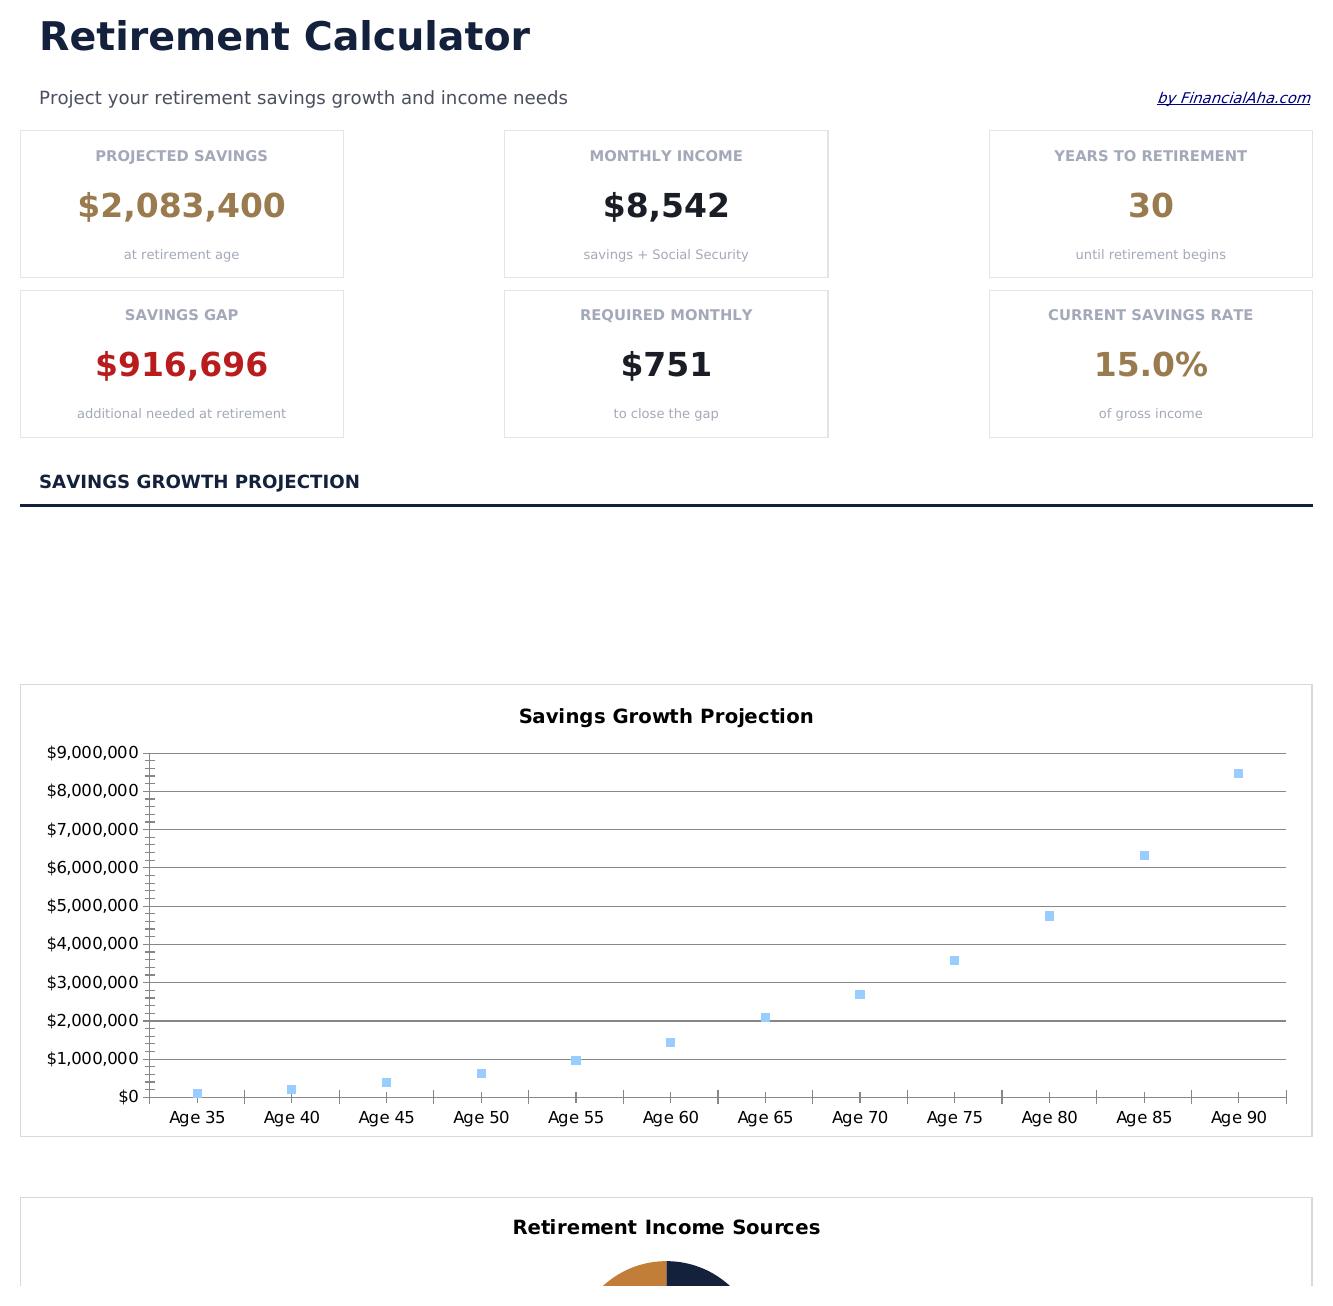
- Spaartekortanalyse die het verschil toont tussen geprojecteerd saldo en geschatte pensioenbehoeften
- Werkt in Microsoft Excel, Google Sheets en LibreOffice Calc zonder installatie
Need more from this template?
The Essentials version covers everyday tracking. Ultimate goes further with multi-entity support, scenario analysis, and ultimate-grade reporting.
- Dashboard met pensioenprojecties inclusief geschatte portefeuillewaarde op de beoogde pensioenleeftijd
- Pensioen-instellingen met invoervelden voor huidige leeftijd, pensioenleeftijd, huidig spaargeld en jaarlijkse bijdrage
- Jaar-op-jaar projectietabel met jaarlijkse bijdragen, beleggingsgroei en eindsaldo
- Groeipercenta-aannames met aanpasbaar verwacht rendementspercentage voor conservatief of agressief modelleren
- Tracking van meerdere rekeningen voor 401k, IRA, Roth, effectenrekening en pensioen met individuele groeiprojecties
- Dashboard met 6 KPI's: totaal verwacht saldo, spaartekort, jaren tot pensioen, jaarlijks bijdragetotaal, verwacht jaarlijks inkomen bij pensioen en portefeuillegroeipercentage
- 3-scenariovergelijking die conservatief (5%), gematigd (7%) en agressief (9%) rendementsaannames naast elkaar modelleert
- Jaar-voor-jaar projectietabel met bijdragen, werkgeversmatch, groei en eindsaldo per rekening
- Onttrekkingsfase-modellering die toont hoe lang de portefeuille meegaat bij verschillende jaarlijkse onttrekkingspercentages
Voorbeeld
Bekijk wat er in dit sjabloon zit
Hoe gebruik je dit Pensioen Calculator sjabloon
Vul je gegevens in
Voer je huidige leeftijd, beoogde pensioenleeftijd, huidig spaarsaldo en jaarlijks bijdragebedrag in op het instellingenblad.
Stel groeiaannames in
Voer een verwacht jaarlijks rendement in. Het template gebruikt dit om beleggingsgroei te projecteren over je resterende werkjaren.
Bekijk de projectie
De jaar-op-jaar tabel toont bijdragen, groei en eindsaldo voor elk jaar van nu tot pensioen.
Controleer het spaartekort
Het dashboard vergelijkt je geprojecteerde saldo met een geschatte pensioenbehoefte en markeert eventuele tekorten.
Customer Reviews
What Our Customers Say
"If I get half as good at handling my finances as you are at customer service, this'll be the best $26 I've spent lately."
"Great tool! Simplifies financial planning without the hassle of complex spreadsheets."
"I recently purchased your super convenient spreadsheet, it really helps me!"
"They're great and super intuitive. Thank you!"
Gebouwd door Claude AI. Verfijnd door ons.
We gebruiken Claude AI om elk sjabloon te ontwerpen, na uitgebreid onderzoek. Daarna neemt ons team het over. We verfijnen de indeling, testen elke formule grondig, lossen randgevallen op en polijsten het ontwerp totdat het iets is dat we zelf ook echt zouden gebruiken. De AI brengt ons 80% van de weg. De laatste 20% is puur menselijk oordeel.
Veelgestelde vragen
Welk rendement moet ik gebruiken?
Historische aandelenmarktgemiddelden liggen vaak tussen 7% en 10% voor inflatie. Het template laat je elk percentage invoeren - gebruik een conservatief getal voor voorzichtigere schattingen.
Houdt het rekening met inflatie?
Het template toont nominale (niet voor inflatie gecorrigeerde) projecties. Gebruik voor reele koopkrachtschattingen een rendement verminderd met de verwachte inflatie.
Kan ik inhaalcontributies modelleren?
Verhoog het jaarlijkse bijdragebedrag in de instellingen om inhaalcontributies weer te geven. De projectie herberekent met het hogere bedrag.
Hoe wordt de pensioenbehoefte geschat?
De spaartekortanalyse gebruikt een doel op basis van je invoer. Pas het doelveld aan zodat het overeenkomt met je eigen schatting van pensioenuitgaven.
Hoe open ik dit in Google Sheets?
Upload het .xlsx-bestand naar Google Drive en open het vervolgens met Google Sheets. Alle formules en opmaak blijven behouden.
Meer Essentials-sjablonen voor Sparen & Pensioen
Hoogtepunten:
Op zoek naar premium spreadsheet-sjablonen?
Onze betaalde sjablonen bevatten geavanceerde dashboards met meerdere werkbladen, ingebouwde Excel-grafieken en doorlopende updates.
Krijg in plaats daarvan elk Ultimate sjabloon
Alle 58 Ultimate sjablonen in één aankoop voor $299 - $1,102 waarde, u houdt $803 over.