A dividend tracker spreadsheet keeps every dividend-paying position in a single holdings sheet and derives everything else from it: forward annual income, portfolio yield, a month-by-month income schedule, yield on cost against your purchase price, a log of payments actually received, and a reinvestment projection. This walkthrough follows the full structure using a worked example, a 10-stock portfolio worth $103,068 that produces $2,833 of forward annual dividends at about a 2.7 percent yield. Our Dividend Tracker Ultimate ($29) ships the whole thing ready-made for Excel and Google Sheets.
A dividend portfolio raises questions a brokerage app answers reluctantly. The app shows what landed in the account this week and what the total is worth today. It is quieter on the questions that shape an income portfolio over time: what the whole thing is set to pay across a full year, which months are fat and which are lean, how the yield on the money you actually invested compares to the yield a new buyer would get today, and what the income would become if every payment were reinvested. Those answers are all latent in a short list of facts you already know for each holding, and a spreadsheet is well suited to pulling them out.
The structure comes down to one thing done well: a single holdings list, entered once, feeding every other view by formula. Get that right and the monthly schedule, the yield-on-cost analysis, the reinvestment projection, and a headline dashboard all fall out without a second round of typing. The examples below come from our Dividend Tracker Ultimate Spreadsheet Template ($29), which ships the whole thing ready-made for Excel and Google Sheets. The layout is reproducible by hand if you would rather build your own dividend tracker spreadsheet from scratch.
What a dividend tracker spreadsheet has to hold
A dividend is a portion of a company’s profit paid out to shareholders, usually on a fixed schedule, and a portfolio of dividend payers generates a steady trickle of these payments that is worth keeping track of. Strip away the brokerage chrome and there are only a few kinds of data behind one:
- Per-holding records. Ticker, company, shares, cost basis, current price, the annual dividend per share, the payment frequency, and the ex-dividend date for each position. This is the raw material for everything else.
- A log of payments received. Each dividend as it actually arrives, with its date, amount, and whether it was reinvested. This is the second place records are entered.
- A few forward assumptions. Last year’s actual income for the year-over-year view, and the growth and reinvestment rates the projection sheets use to look ahead.
- Derived views. Market value, current yield, the monthly income schedule, yield on cost, the reinvestment projection, and the dashboard tiles. These are calculations, not entries. In a well-built sheet, nothing here is ever typed.
The tracker gives each of these its own sheet: Holdings for the positions, Dividend History for the log, Monthly Income for the schedule, Yield on Cost for the cost-basis view and the year-over-year comparison, a DRIP Calculator for the reinvestment model, and a Dashboard on top, with a How to Use sheet carrying the instructions. Records go into two of them, Holdings and Dividend History; the Yield on Cost and DRIP sheets add a handful of assumption cells for the forward views. Everything else reads the Holdings list.
The reason to prefer that arrangement over a page of standalone tiles is drift. When two summaries hold the same fact independently, the day one of them is updated and the other is not, they disagree, and an income tracker that quietly disagrees with itself is worse than none at all. Reading everything off one list removes the possibility, because the monthly schedule, the yield-on-cost table, and the dashboard are not copies of the Holdings numbers, they are functions of them, so they move the instant the source does.
Start with the positions: the Holdings sheet
The Holdings sheet is the only place a position is ever typed, and it is where every other number in the workbook begins. Each row is one holding. The columns you fill in are Ticker, Company Name, Shares, Cost Basis / Share, Current Price, Annual Div / Share, Frequency, Sector, and the Ex-Div Date. Two columns then calculate:
- Market Value = shares times current price
- Div Yield % = the annual dividend per share divided by the current price
One row makes the flow concrete. The sample’s Johnson & Johnson position is 50 shares bought at a $155 cost basis, currently priced at $162, so the market value is 50 times $162, or $8,100. With an annual dividend of $3.80 a share, the current yield is $3.80 over $162, which is 2.3 percent, and the position is set to pay 50 times $3.80, or $190 across the year. Every one of those figures follows from the numbers typed into the row.
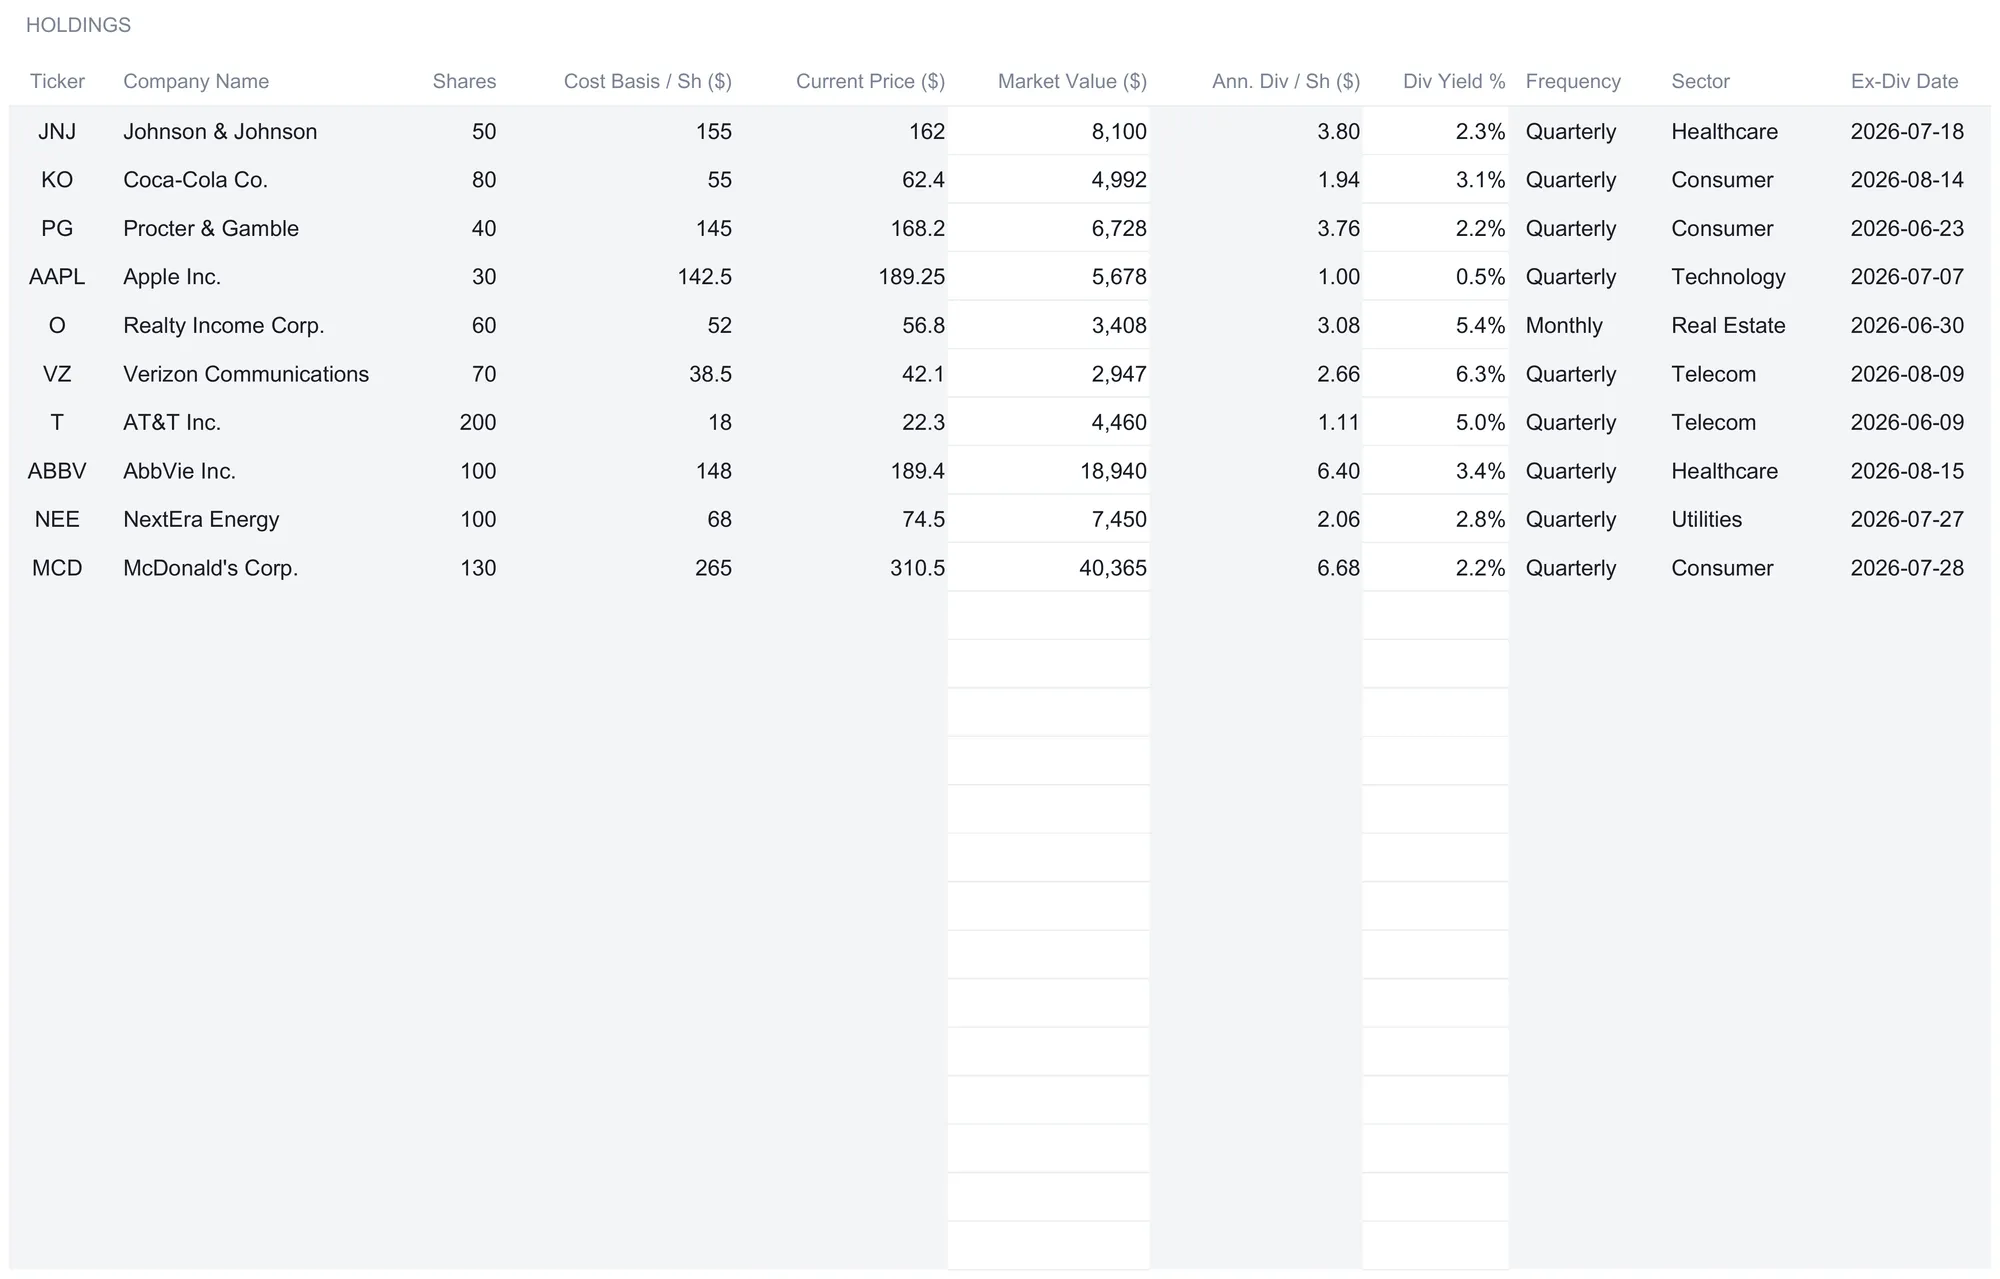
The full sample is 10 holdings, from consumer-staple names like Coca-Cola and Procter & Gamble to a monthly-paying real estate trust in Realty Income and a high-cost-basis McDonald’s position. Laid side by side, the spread of yields is the point. Verizon shows the highest current yield at 6.3 percent and Apple the lowest at 0.5 percent, a reminder that dividend payers are not one kind of stock. Frequency varies too: nine of the ten pay quarterly, while Realty Income pays monthly, which matters a great deal once the calendar view is built. Added together, the 10 rows total 860 shares and $103,068 of market value, and the annual dividend across the whole list, worked out as a share-weighted sum, comes to $2,833.
The sheet supports up to 30 holdings and the formulas already run down all 30 rows, so a new position goes on the first free row and every other sheet updates with nothing to drag. Below the totals sits a Market Value by Sector block that tallies each sector’s value, its holding count, and its share of the portfolio. In the sample it reads Consumer at 50.5 percent across three names, Healthcare at 26.2 percent, and the rest spread thinly, with a single McDonald’s position alone accounting for roughly 39 percent of the whole. A sector typed over the built-in dropdown still counts, landing in an Other line so the block always ties back to the portfolio total. This is where concentration becomes a standing number rather than something you sense, and the tracker reports it plainly and leaves what to make of it to you.
Two columns are worth flagging as the ones to keep current. Current Price drives every valuation and current-yield figure, and Annual Div / Share drives every income figure, so when a company raises or cuts its dividend, editing that one cell flows through the monthly schedule, the yield-on-cost table, and the dashboard at once. There is no live feed doing it for you. A number is exactly as current as the last time you refreshed it by hand, which is the honest trade a spreadsheet makes against a connected app: total control and total transparency, in exchange for doing the updating yourself.
Log what actually arrives: the Dividend History sheet
Where the Holdings sheet describes what a portfolio is set to pay, the Dividend History sheet records what it actually paid. It is the second sheet that takes records rather than assumptions, and it holds up to 100 entries. Each row carries a Date, Ticker, Amount, Shares, Type, whether it was Reinvested, and a free-text Note, plus one computed column:
- Div / Sh = the payment amount divided by the shares it was paid on
That per-share figure is a quiet cross-check. Comparing it against the Holdings sheet’s annual dividend divided by the number of payments a year tells you whether a logged payment lines up with the rate on record; a row that does not match is either entered wrong or a dividend that has moved since you set it. In the sample, the AbbVie payment of $160 on 100 shares works out to $1.60 a share, which is exactly a quarter of its $6.40 annual rate, so the log and the holding agree.
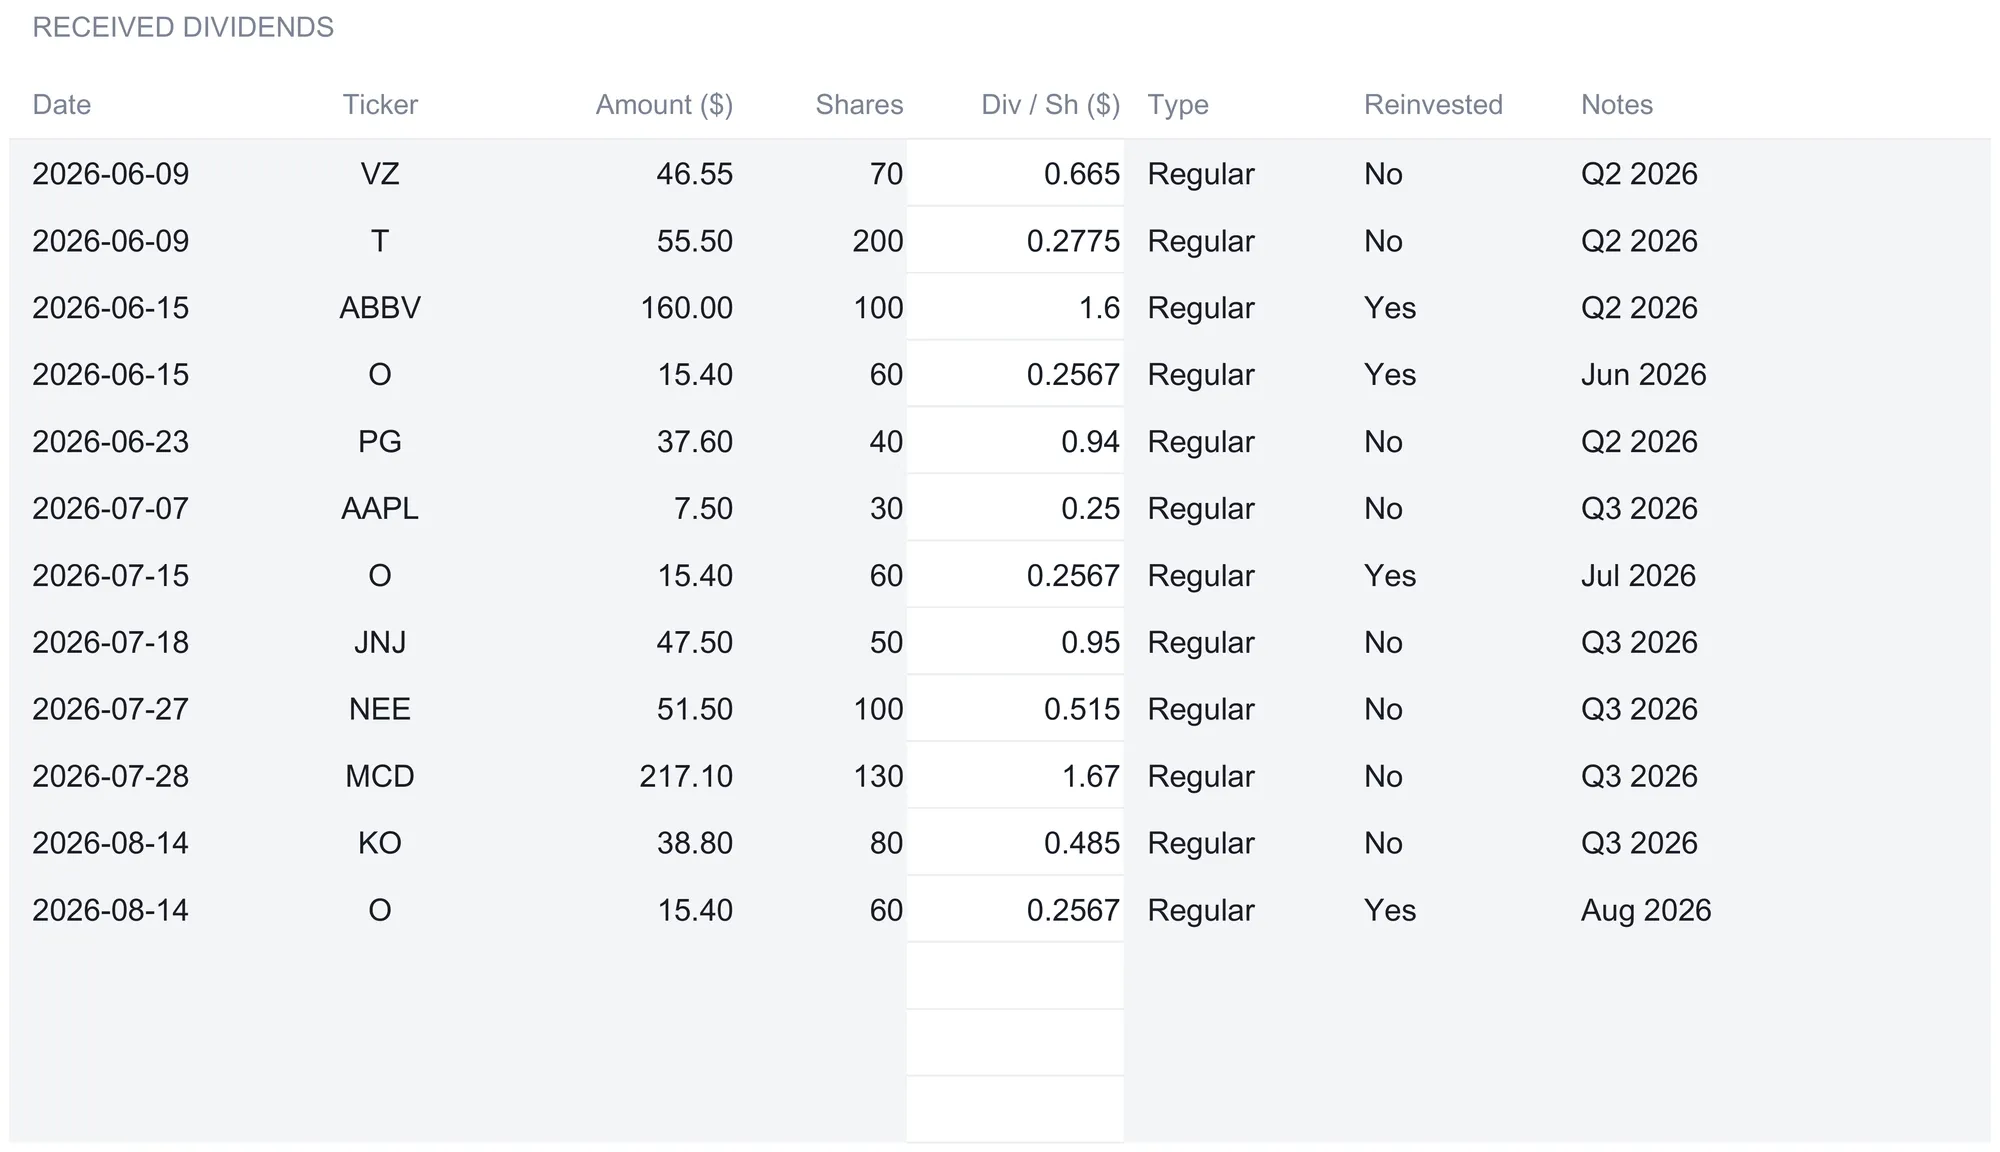
The sample logs 12 payments received between June and August 2026, and reading them makes the shape of an income portfolio concrete in a way the projection cannot. Realty Income appears three times, once a month, because it is a monthly payer, while every quarterly name appears once. McDonald’s is the largest single payment at $217.10, AbbVie next at $160, and Apple the smallest at $7.50, mirroring the spread of dividend rates on the Holdings sheet. Four of the payments are tagged as reinvested, and the Type column separates regular dividends from anything unusual.
Below the log, two summaries close the loop. A single Total Received line sums every logged amount, and it reads $708.25 for the sample so far. A Total by Ticker table then lists each ticker that appears in the log with its running total and a count of payments, and its own total ties back to the same $708.25 across 12 payments. That figure is the dashboard’s Total Received tile, and because it is a straight sum of what you entered, it is the one number on the whole workbook that reflects cash in hand rather than a forward estimate. Keeping actual receipts beside the forward figure is what lets you check, at any point in the year, how the income you have banked compares to the pace the Holdings sheet projects.
Read the year by month: the Monthly Income sheet
The Monthly Income sheet turns the flat annual figure into a calendar. It takes no input at all. Every holding gets a row tagged with its frequency, and the sheet spreads that holding’s annual dividend across the twelve months its own cycle lands on, counted from the ex-dividend date on the Holdings sheet. A quarterly payer fills four months, a monthly payer fills all twelve, and a holding with no ex-dividend date shows nothing until the date is entered.
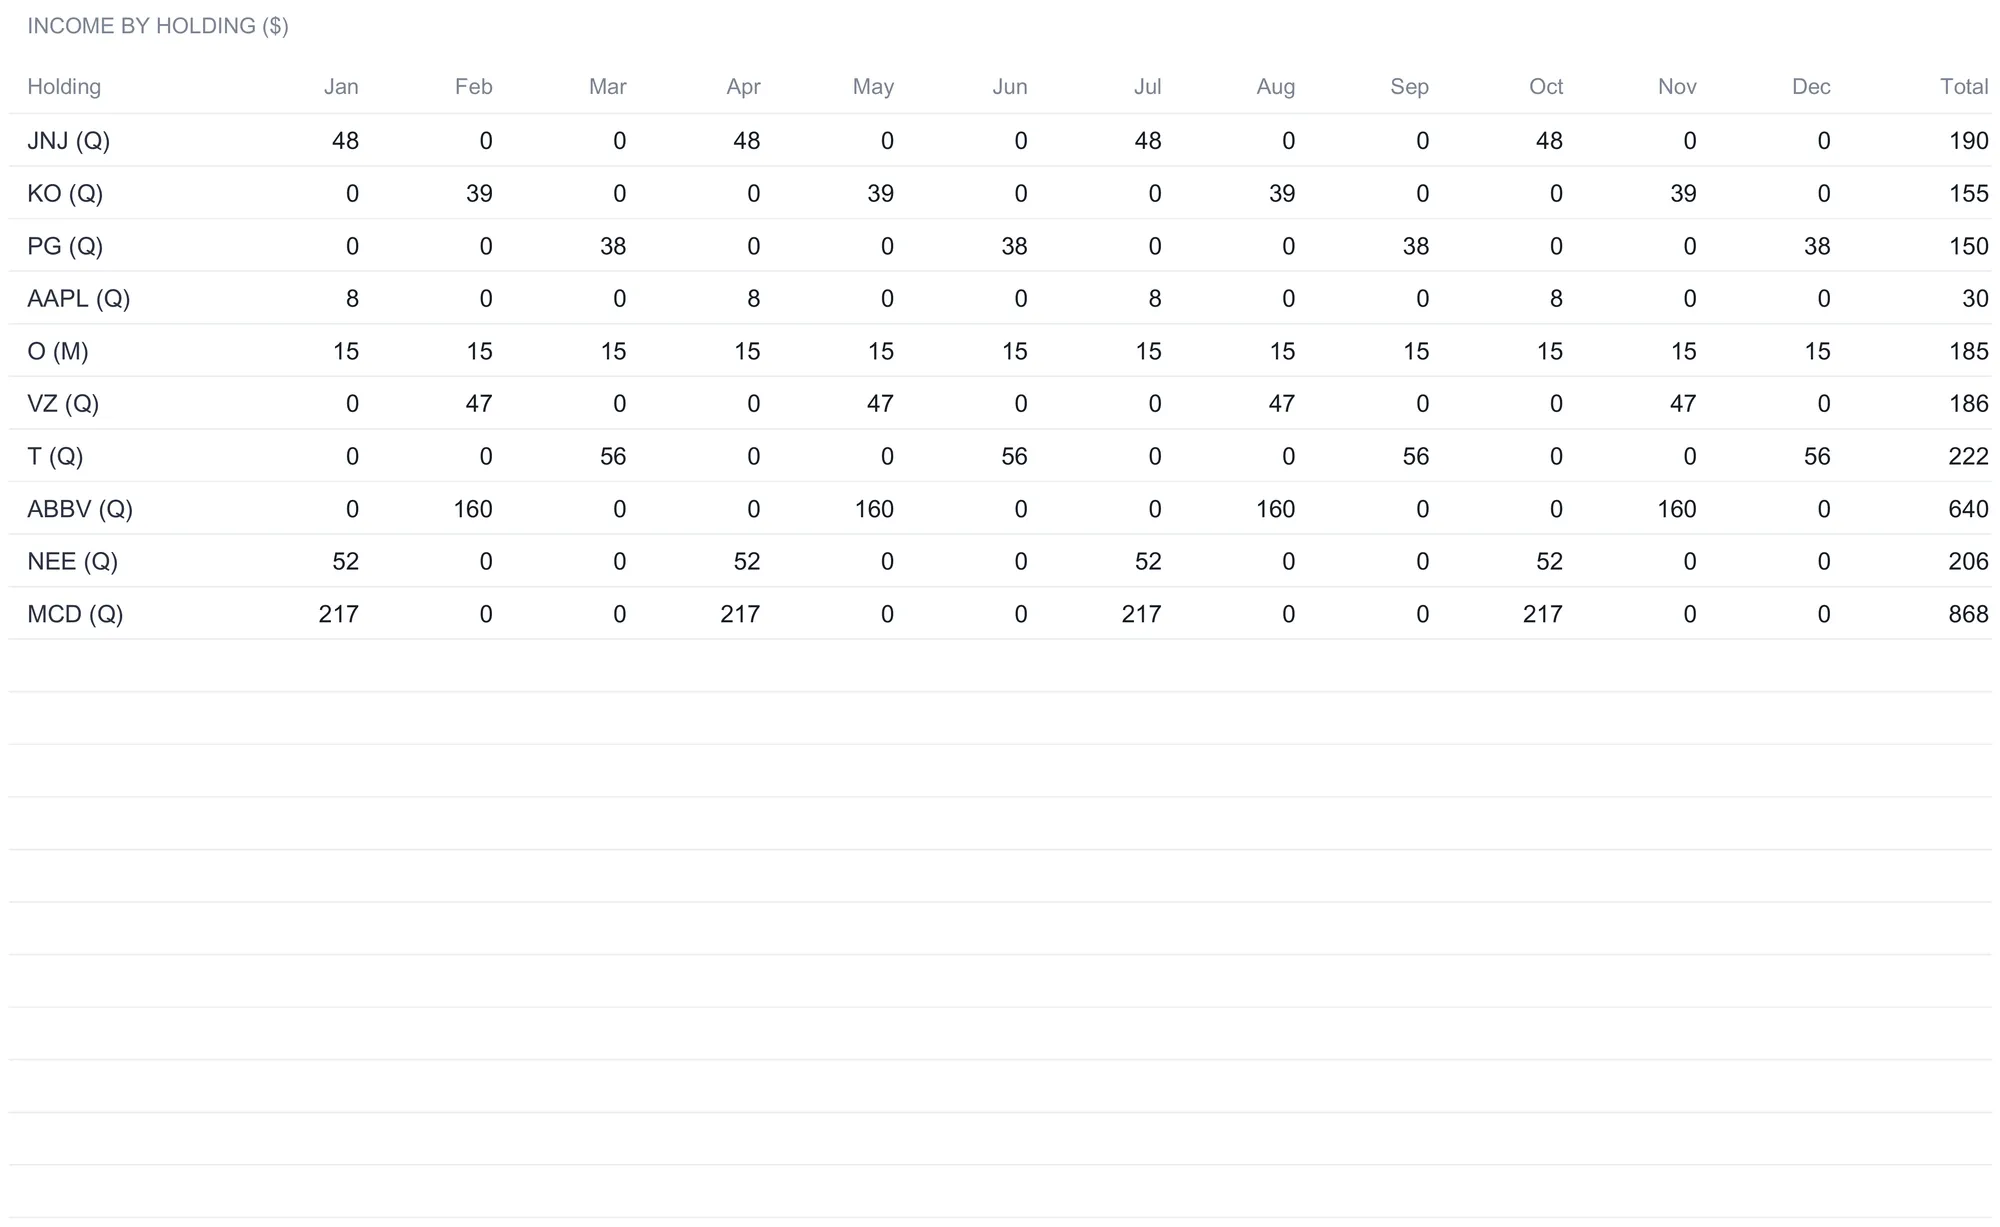
Reading the sample down the columns shows why this view earns its own sheet. Realty Income contributes about $15 every single month, the mark of a monthly payer, while McDonald’s drops roughly $217 into January, April, July, and October and nothing in between. Because four of the nine quarterly names in the sample sit on the January, April, July, October cycle, McDonald’s among them, the portfolio’s income is markedly uneven: the total row lands near $339 in each of those four months, about $261 in February, May, August, and November, and about $109 in the remaining four, all of which still add to the same $2,833 for the year. That lumpiness is invisible on an annual figure and obvious here, and it is the sort of thing worth knowing before leaning on dividend income month to month. The row totals also reconcile to the Holdings sheet: Johnson & Johnson’s twelve monthly cells sum to $190, exactly its annual dividend, and every other row does the same.
Two points about precision are worth stating plainly. The on-screen monthly figures are rounded to whole dollars, so a quarter of Johnson & Johnson’s $190 shows as $48 rather than $47.50, while the underlying total stays exact. And the schedule is a forward projection built from today’s dividend rate and the stated ex-dividend date, not a record of receipts; the Dividend History sheet is where actual payments live. The two are designed to be read together, projection against reality.
Measure the yield on what you paid: the Yield on Cost sheet
The Yield on Cost sheet answers a question the Holdings sheet deliberately leaves alone: what each holding yields against the price you originally paid, rather than against today’s price. It restates each position with its cost basis per share, share count, Total Cost, annual dividend per share, and Annual Income, then divides:
- Yield on Cost = annual income divided by total cost
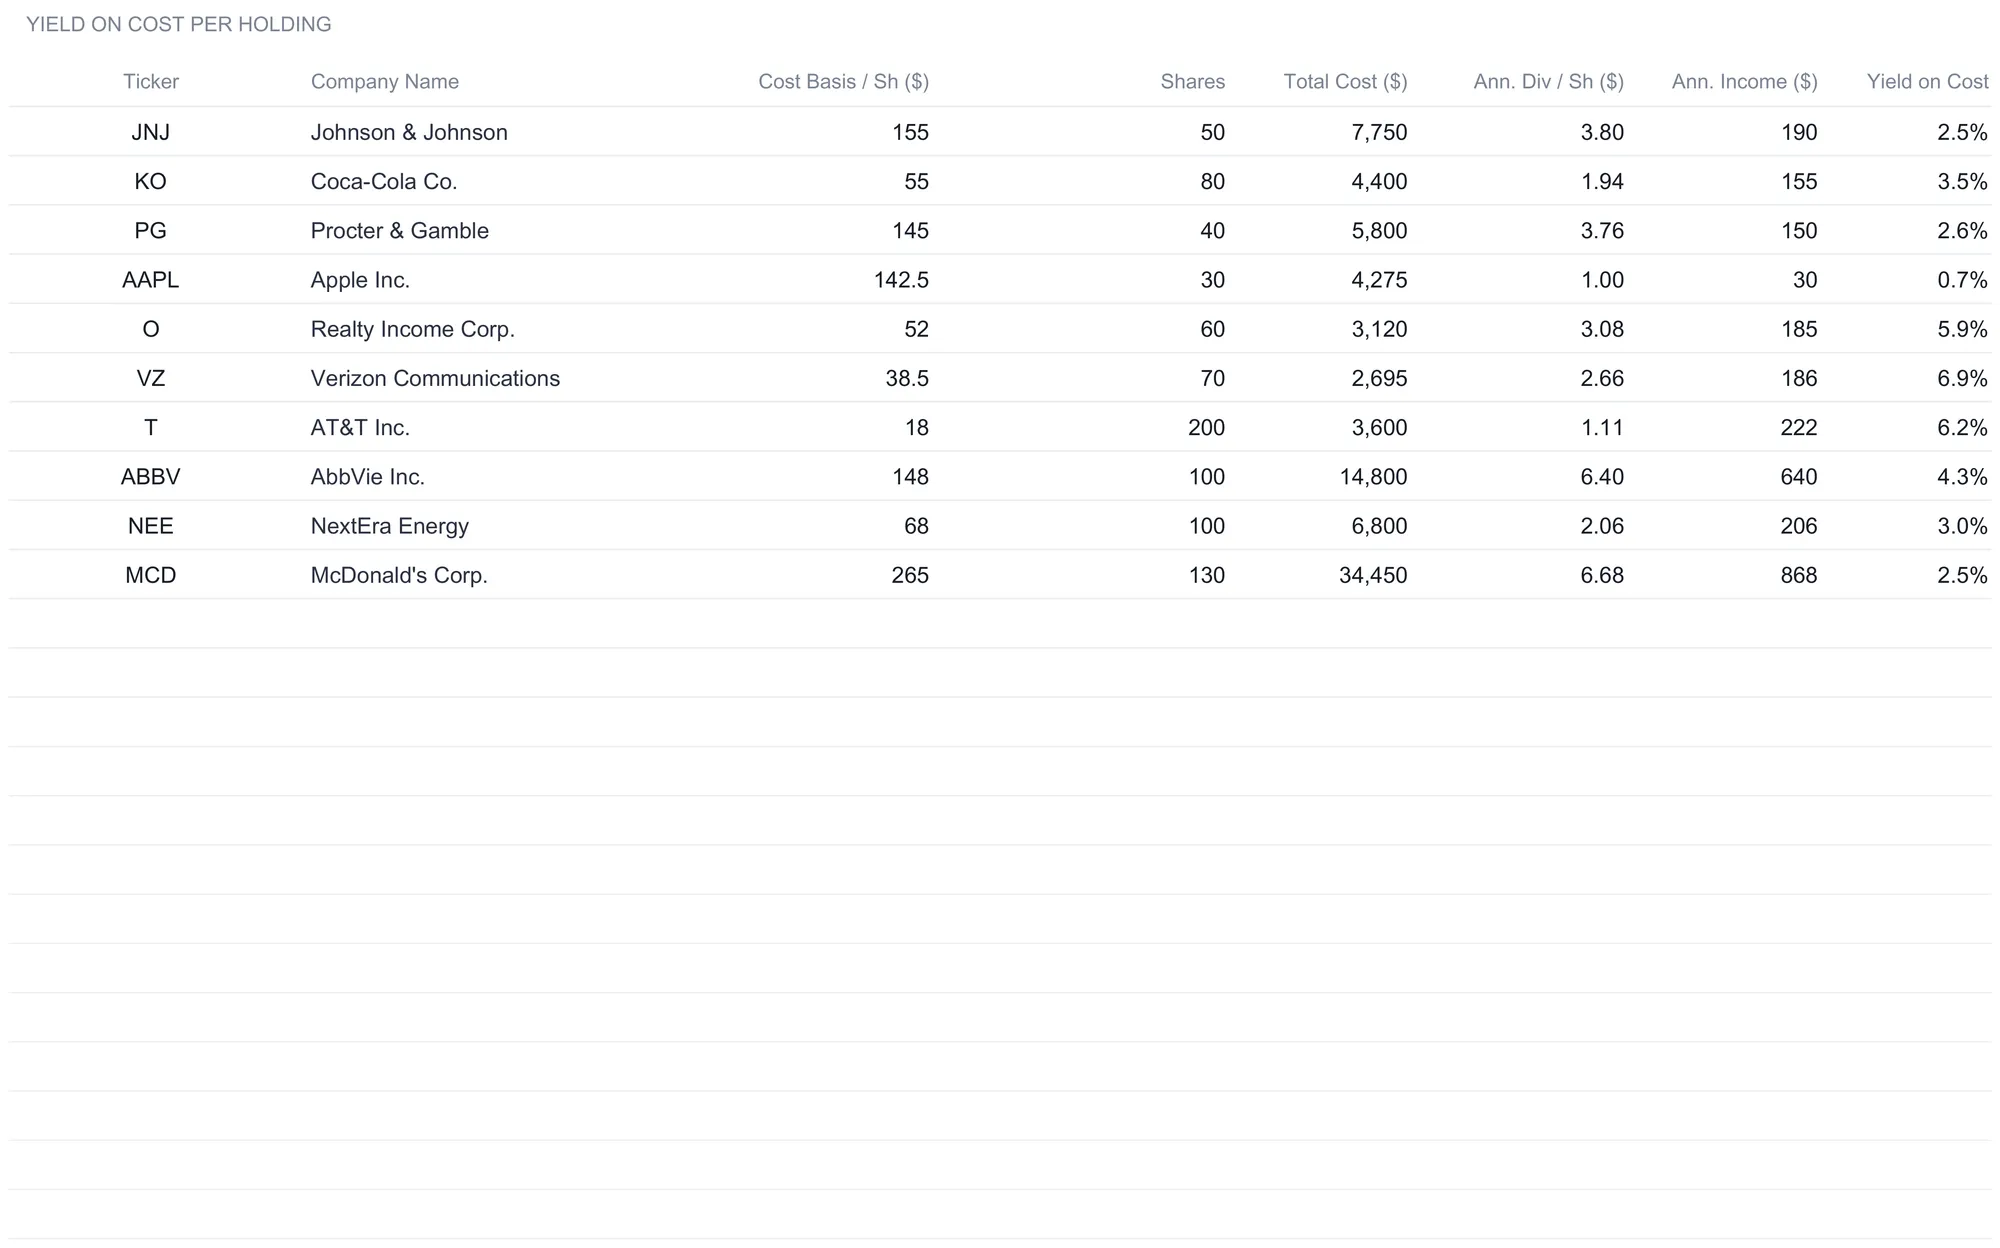
The gap between this sheet and the Holdings yield is the whole point. AT&T, bought at a $18 cost basis and now near $22, yields 5.0 percent at today’s price but 6.2 percent on what it cost, because the dividend is measured against the smaller original outlay. Verizon reads 6.9 percent on cost against 6.3 percent current, and across the ten holdings the total annual income of $2,833 sits on a total cost of $87,690, a portfolio-wide yield on cost of about 3.2 percent against the 2.7 percent the portfolio yields at current market value. Neither number is more correct than the other; they answer different questions, one about the money you committed and one about the money the position is worth now, and the tracker keeps them on separate sheets so neither stands in for the other.
Below the per-holding table, a Dividend Income Year-over-Year section adds a time dimension. It places last year’s actual income, which you type into the 2025 column, beside this year’s forward figure pulled from Holdings, and then projects a 2027 figure at a dividend growth rate stated above the table. In the sample the total income rises from $2,699 logged in 2025 to $2,833 in 2026, a 4.96 percent increase, and the 2027 column applies an assumed 5 percent growth to reach $2,974.65. The sheet is careful to label that growth rate as an assumption rather than a forecast, and the year-over-year change per holding prints green when income grew and red when it fell, so a dividend cut shows up as a red row rather than hiding inside a portfolio total. That 4.96 percent portfolio-level change is the figure the dashboard surfaces as its Dividend Growth Rate tile, shown rounded to 5.0 percent.
Model reinvestment as a scenario: the DRIP Calculator
The DRIP Calculator is the workbook’s forward-looking sheet, and it is explicitly a model rather than a prediction. DRIP stands for dividend reinvestment plan, the practice of using each dividend to buy more shares of the same holding, and the sheet shows how that compounding would play out under assumptions you control. Five rows sit at the top under a DRIP Assumptions heading: the annual dividend income and portfolio market value carried over from Holdings, the portfolio yield those two produce, a Dividend Growth Rate, and a Share Price Appreciation rate, with the last two being yours to set. The sample uses 5 percent dividend growth and 7 percent price appreciation.
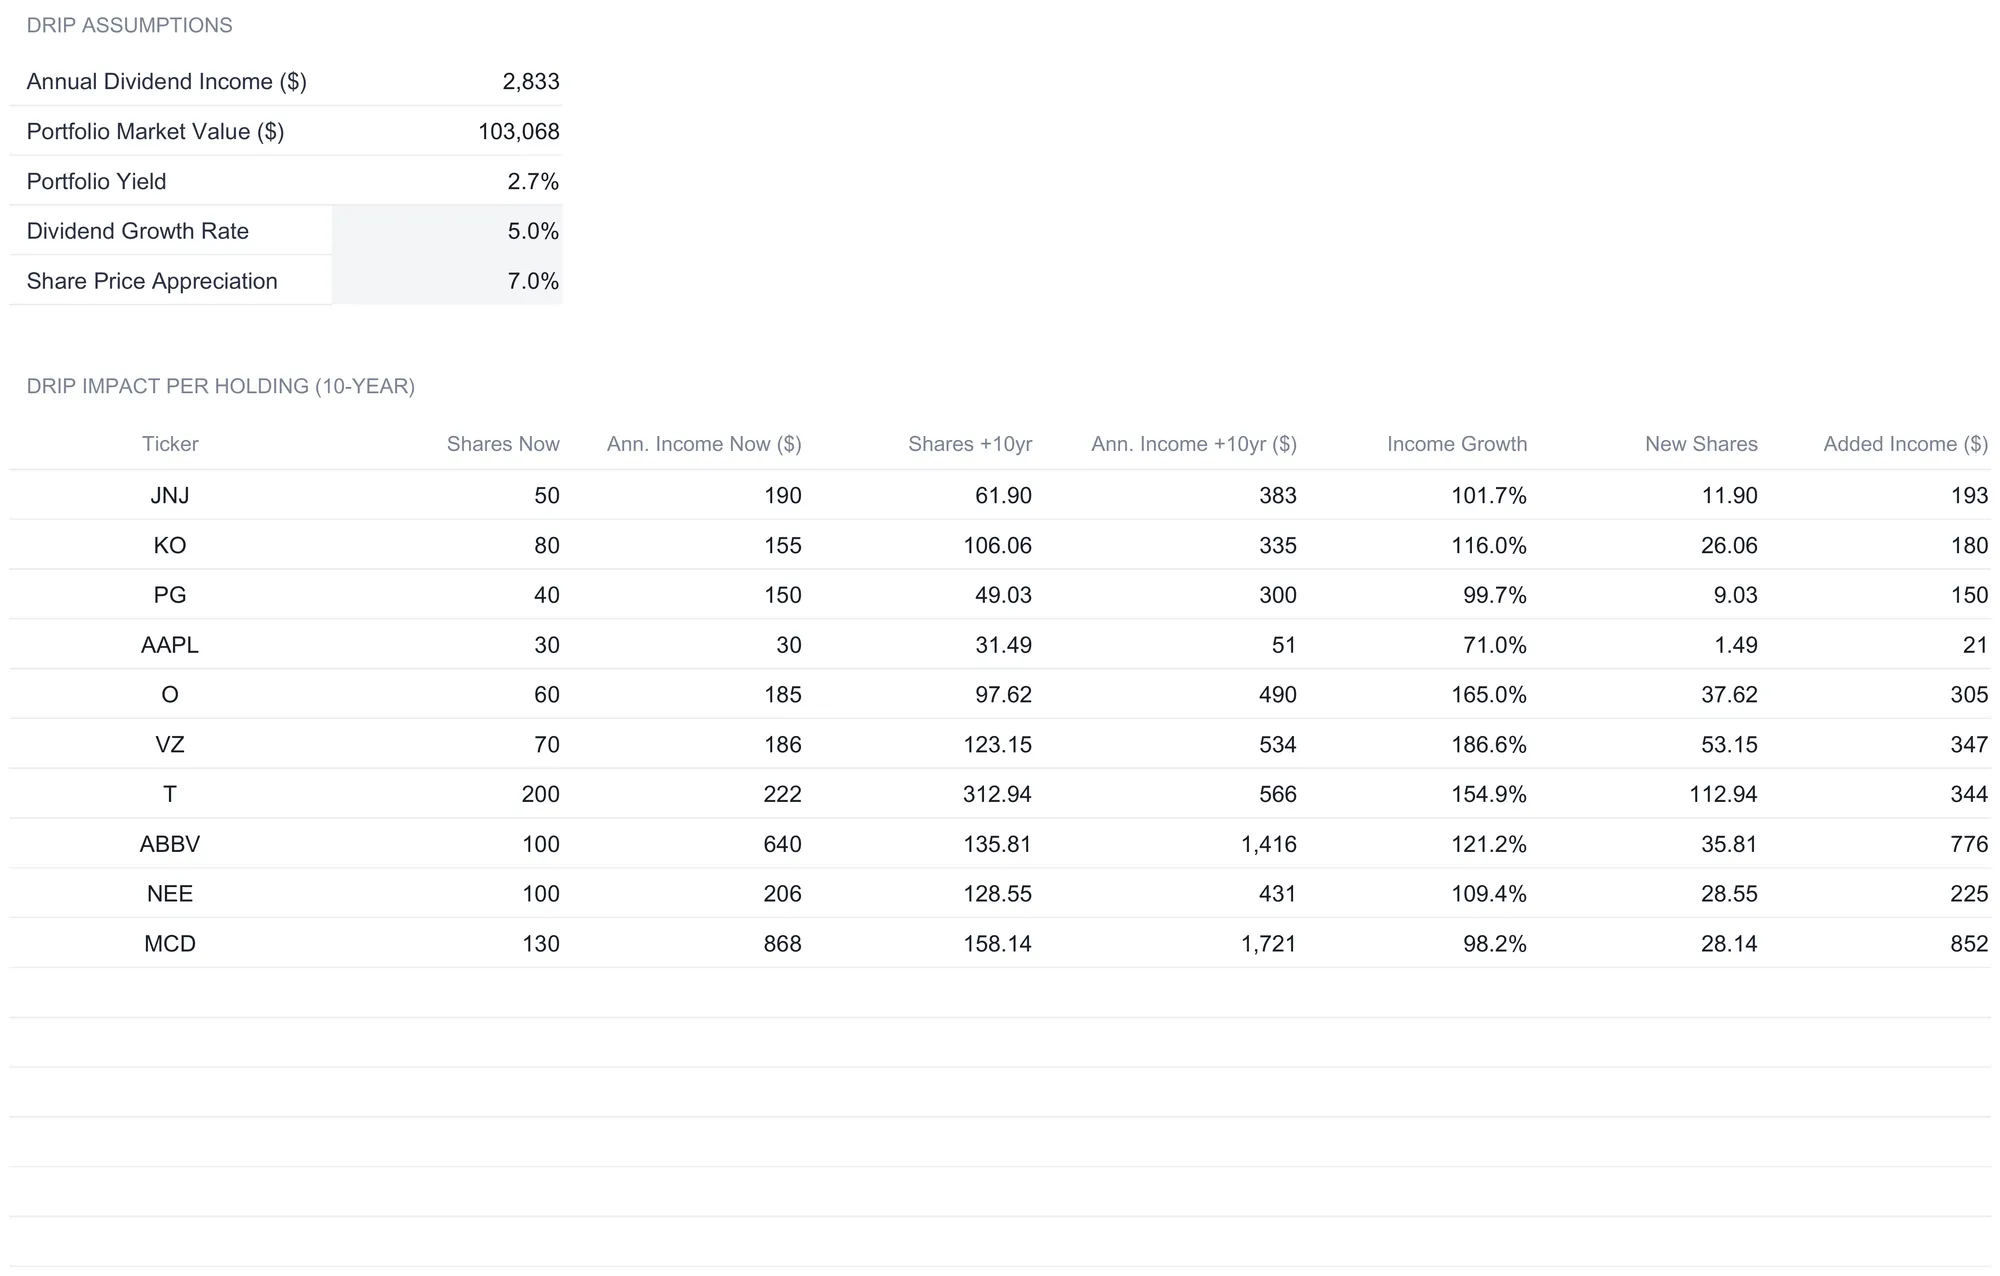
The per-holding table projects each position forward ten years, showing shares now, income now, shares and income after ten years of reinvestment, and the new shares and added income the reinvestment would produce. Under the sample assumptions, the portfolio’s shares grow from 860 to well over a thousand and its annual income rises from $2,833 to $6,227, with each holding compounding at its own yield. Realty Income and Verizon, the higher-yielding names, add the most proportionally, while low-yield Apple adds least, because a bigger dividend buys more new shares each year. Below the table, a sensitivity grid restates the projection across a range of inputs, with dividend growth rates from 0 to 10 percent down the side and holding periods from 5 to 25 years across the top, so a single view spans everything from a modest near-term outcome to a compounded figure many times larger. Both the rates and the year counts are yours to change.
The value here is in seeing how sensitive the outcome is to the assumptions, not in the specific dollar figures, which are only as real as the rates you feed them. The sheet says as much, heading its inputs DRIP Assumptions and its grid a DRIP sensitivity table. Read that way, it is a tool for understanding the mechanics of reinvestment, and what you do with that understanding is your call.
The dashboard: six numbers and a map of the year
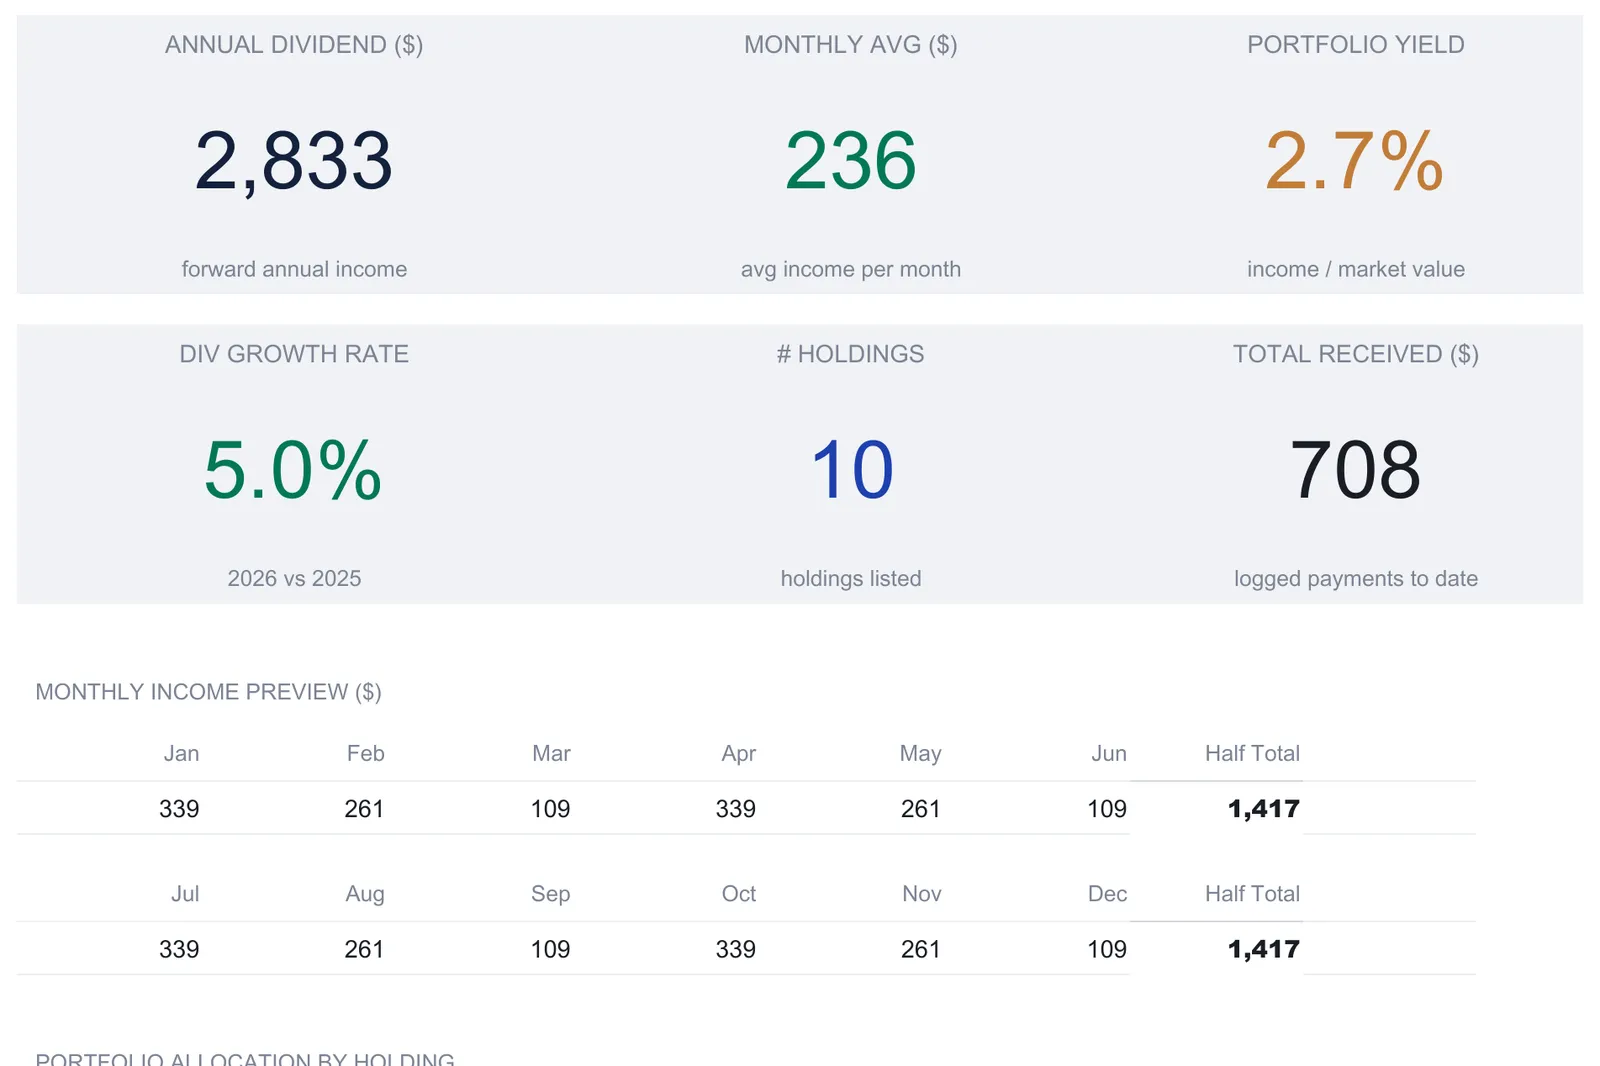
With the Holdings sheet filled and the two projection sheets set, the Dashboard states the whole portfolio in six tiles, a monthly preview, and a chart. Every figure on it is a formula; the only cell you touch is the currency dropdown beside the title.
| KPI | Sample value | What it reads |
|---|---|---|
| Annual Dividend | $2,833 | Forward annual income from Holdings |
| Monthly Avg | $236 | Annual dividend divided by 12 |
| Portfolio Yield | 2.7% | Annual dividend over market value |
| Div Growth Rate | 5.0% | 2026 income against 2025’s logged actual |
| # Holdings | 10 | Rows that carry a ticker |
| Total Received | $708 | Sum of the Dividend History log |
The six tiles are chosen to answer six different questions at a glance, and it is worth noticing that they draw on all three of the workbook’s angles at once. Annual Dividend, Monthly Avg, and Portfolio Yield are the forward picture from Holdings. Div Growth Rate is the year-over-year read from the Yield on Cost sheet. Total Received is the cash-in-hand figure from the Dividend History log. Putting a forward estimate, a growth trend, and an actual total on the same row is the point of the front page, because each checks the others.
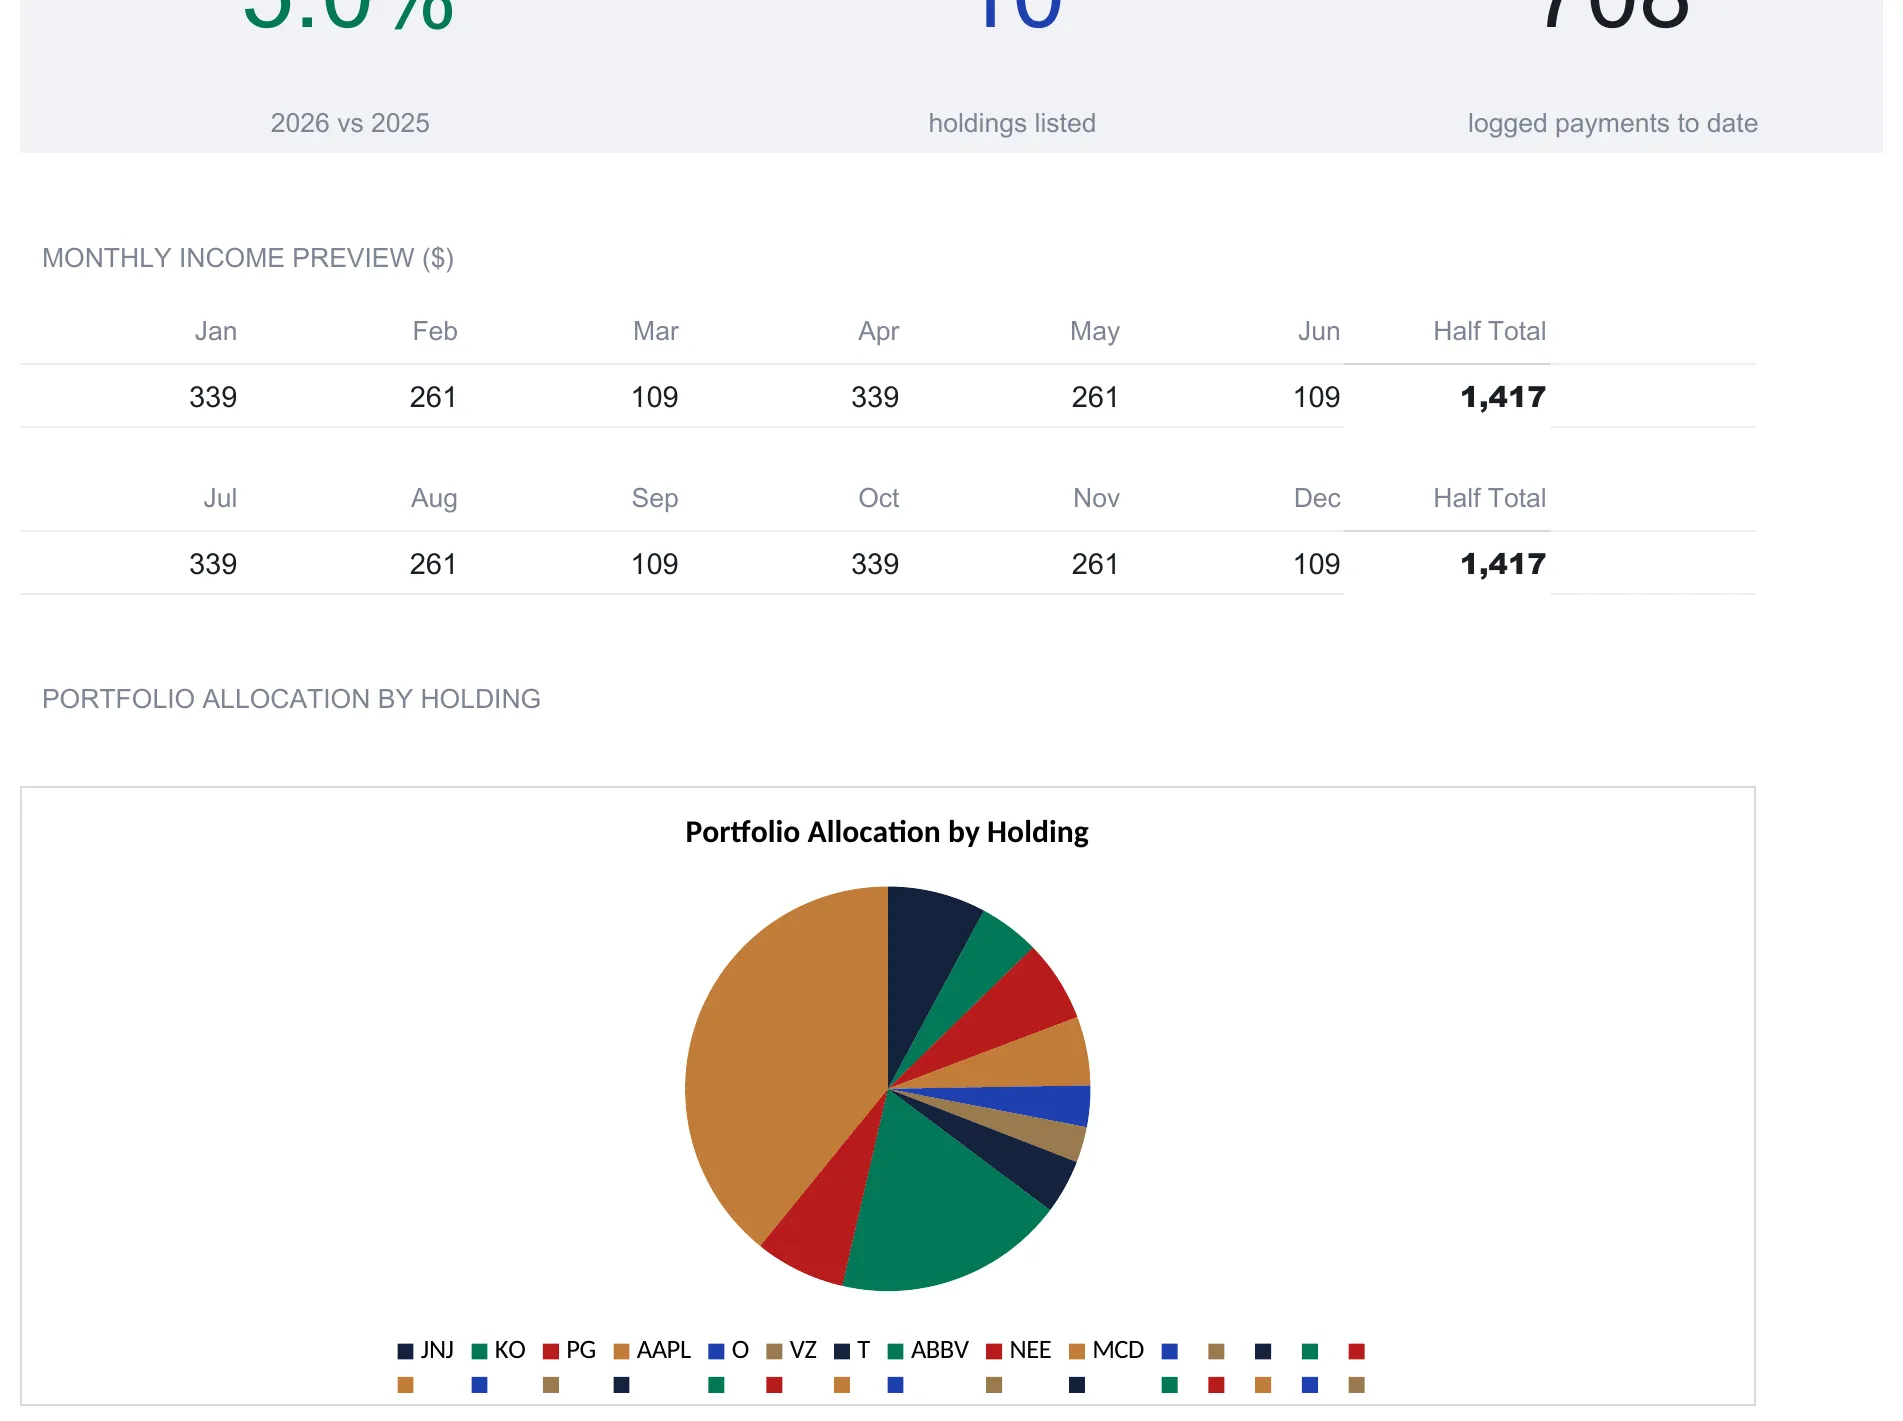
Below the tiles, a Monthly Income Preview repeats the calendar in a compact two-row grid, with a half-year total on each row that reads $1,417 for the first six months and $1,417 for the second, adding to the annual $2,833. A Portfolio Allocation by Holding chart then plots each position’s share of the market value, where McDonald’s single large slice makes the portfolio’s concentration visible without leaving the front page. Because every figure traces back to the Holdings and Dividend History sheets, the dashboard and the detail sheets cannot disagree; the front page is a summary of the same numbers, never a separate copy that could fall out of step.
Yield, yield on cost, and growth in plain terms
A few of the tracker’s numbers carry more jargon than meaning, so it is worth restating them plainly, because each is a simple division of figures the workbook already holds.
Current yield (Verizon’s $2.66 dividend over its $42.10 price, or 6.3 percent) is what a holding pays relative to what a share costs today.
Yield on cost (Verizon’s $186.20 of income over its $2,695 total cost, or 6.9 percent) is what the same dividend pays relative to what you originally spent.
Portfolio yield (the portfolio’s $2,833 over its $103,068 of value, or 2.7 percent) is the whole portfolio’s income as a share of its worth.
Dividend growth (2026’s $2,833 against 2025’s $2,699, or 4.96 percent) is how much the income changed from one year to the next.
The distinction the whole workbook hinges on is which price a yield divides by. Current yield and portfolio yield divide by today’s market value, because the question is what the money is earning relative to what it is worth now. Yield on cost divides by your purchase price, because the question is what the money is earning relative to what you put in. A single dividend, two denominators, two honest answers.
Where dividends land at tax time
For US investors, the income this tracker totals also carries a tax character the spreadsheet does not attempt to classify. Dividends are treated as either ordinary or qualified, and the two are taxed differently. Ordinary dividends are included in ordinary income, while qualified dividends can be taxed at lower capital-gain rates, and the payer identifies which is which on the Form 1099-DIV you receive for distributions of at least $10. The tracker does not need to make that call: it totals the income, with the Dividend History log giving you a dated record and the dashboard giving you the annual figure, so you arrive at tax time with the numbers already in hand. IRS Topic no. 404 covers how dividends and other corporate distributions are reported, and a tax professional can confirm how a specific holding is treated.
Excel or Google Sheets for a dividend tracker
The tracker is an .xlsx file built entirely on plain formulas, with no macros and no add-ons, so it runs identically in Microsoft Excel, in Google Sheets after upload, and in LibreOffice Calc. Google Sheets suits an investor who wants the file on any device and does not mind refreshing prices and dividend rates in a browser; Excel suits one who prefers a local copy and a desktop. A currency selector on the Dashboard relabels every money column and KPI across the workbook from a long list of symbols, though it relabels only and does not convert the underlying numbers. The structure described here is equally buildable in either program, and the same one-list discipline is what keeps it honest wherever it runs.
Which tracker fits which investor
- Dividend Tracker Ultimate Spreadsheet Template ($29) is the workbook this walkthrough follows: the holdings list, the received-payments log, the month-by-month income schedule, the yield-on-cost and year-over-year views, the DRIP projection, and the six-tile dashboard, for up to 30 holdings.
- The free Dividend Tracker is a single dividends sheet for anyone who just wants to list holdings and see the annual income and yield each one produces. The Dividend Tracker Essentials ($19) takes the other angle: its dividends sheet logs payments received, with an ex-date, a pay date, and a qualified flag on each row, under a six-tile dashboard and a dividends-by-stock chart.
- Investment Portfolio Tracker Ultimate Spreadsheet Template ($29) widens the lens from income to the whole portfolio, with sector asset allocation against targets, a rebalancing guide, and year-over-year performance, and a single dividend sheet rather than the five income views here. It suits an investor whose focus is the full allocation picture, where the dividend tracker suits one whose focus is the income stream itself.
Related
- Dividend Income Tracker in Google Sheets (Free + Paid Versions) - the general guide to building a dividend log in Sheets, and where the free and paid tiers differ
- Bond vs Dividend Stock Income Spreadsheet (Side-by-Side Returns) - comparing two income approaches side by side in a sheet
- How to Track an Investment Portfolio in a Spreadsheet - the same one-list discipline applied to the whole portfolio, with allocation and performance views
Frequently asked questions
Does the spreadsheet pull live dividend data or stock prices automatically?
No. Current Price and Annual Div / Share are manual columns on the Holdings sheet, and they are the two figures worth revisiting, because every valuation, yield, and projection across every sheet reads them. There is no market data feed and no broker connection, so the numbers are only as current as the last time you updated them. That is the trade against a connected app: the file stays entirely on your machine with formulas you can read and change, but nobody refreshes the prices or dividend rates except you.
What is the difference between dividend yield and yield on cost in this tracker?
They divide the same annual dividend by different prices. Div Yield % on the Holdings sheet measures the dividend against the current price, so it answers what the holding yields at today's value. Yield on Cost, on its own sheet, measures the same dividend against the price you originally paid, so it answers what the holding yields on the money you put in. A position bought years ago at a low price can show a much higher yield on cost than current yield, and the two sit on separate sheets so neither overwrites the other.
How does the Monthly Income sheet know which month each dividend lands in?
It reads two things from the Holdings sheet: the payment Frequency (Monthly, Quarterly, Semi-Annual, or Annual) and the Ex-Div Date. Each holding pays in the months its own cycle lands on, counted from that ex-dividend date, so a quarterly payer with a July date fills July, October, January, and April. Move the date to a month the company actually pays in and the whole row shifts with it. A holding with no ex-dividend date shows no months until the date is entered.
Is the DRIP calculator a prediction of what my dividends will be?
No. The DRIP Calculator is a what-if model, not a forecast. It compounds the sample portfolio forward using assumptions you set, a dividend growth rate, a share-price appreciation rate, and reinvestment at the portfolio's own yield, and the sheet labels those inputs as assumptions rather than predictions. Changing any assumption changes every projected figure. It shows how reinvesting would compound under a given scenario, which is a different thing from stating what a real portfolio will do.
How are stock dividends taxed?
In the US, dividends are classified as either ordinary or qualified, and the two are taxed differently: ordinary dividends are included in ordinary income, while qualified dividends can be taxed at lower capital-gain rates. The payer identifies which is which on the Form 1099-DIV you receive for distributions of at least $10. IRS Topic no. 404 covers dividends and other corporate distributions, and a tax professional can confirm how a specific holding is treated.
Sources
- Topic no. 404, Dividends and other corporate distributions - Internal Revenue Service
- Dividend (glossary) - U.S. Securities and Exchange Commission (Investor.gov)
About this article
Every figure, column name, formula, and feature description checked on 2026-09-10 against the published Dividend Tracker Ultimate workbook customers download (Dashboard, Holdings, Dividend History, Monthly Income, Yield on Cost, DRIP Calculator, How to Use), with the free and Essentials Dividend Tracker workbooks checked for the tier comparison. IRS Topic no. 404 and the Investor.gov dividend glossary entry checked against the live sources at writing time. Last reviewed September 2026.