Rental Property Cash Flow Essentials Template
Track rental income and expenses for investment properties. Calculate net cash flow, cap rate, and return metrics for landlords.
What's Included
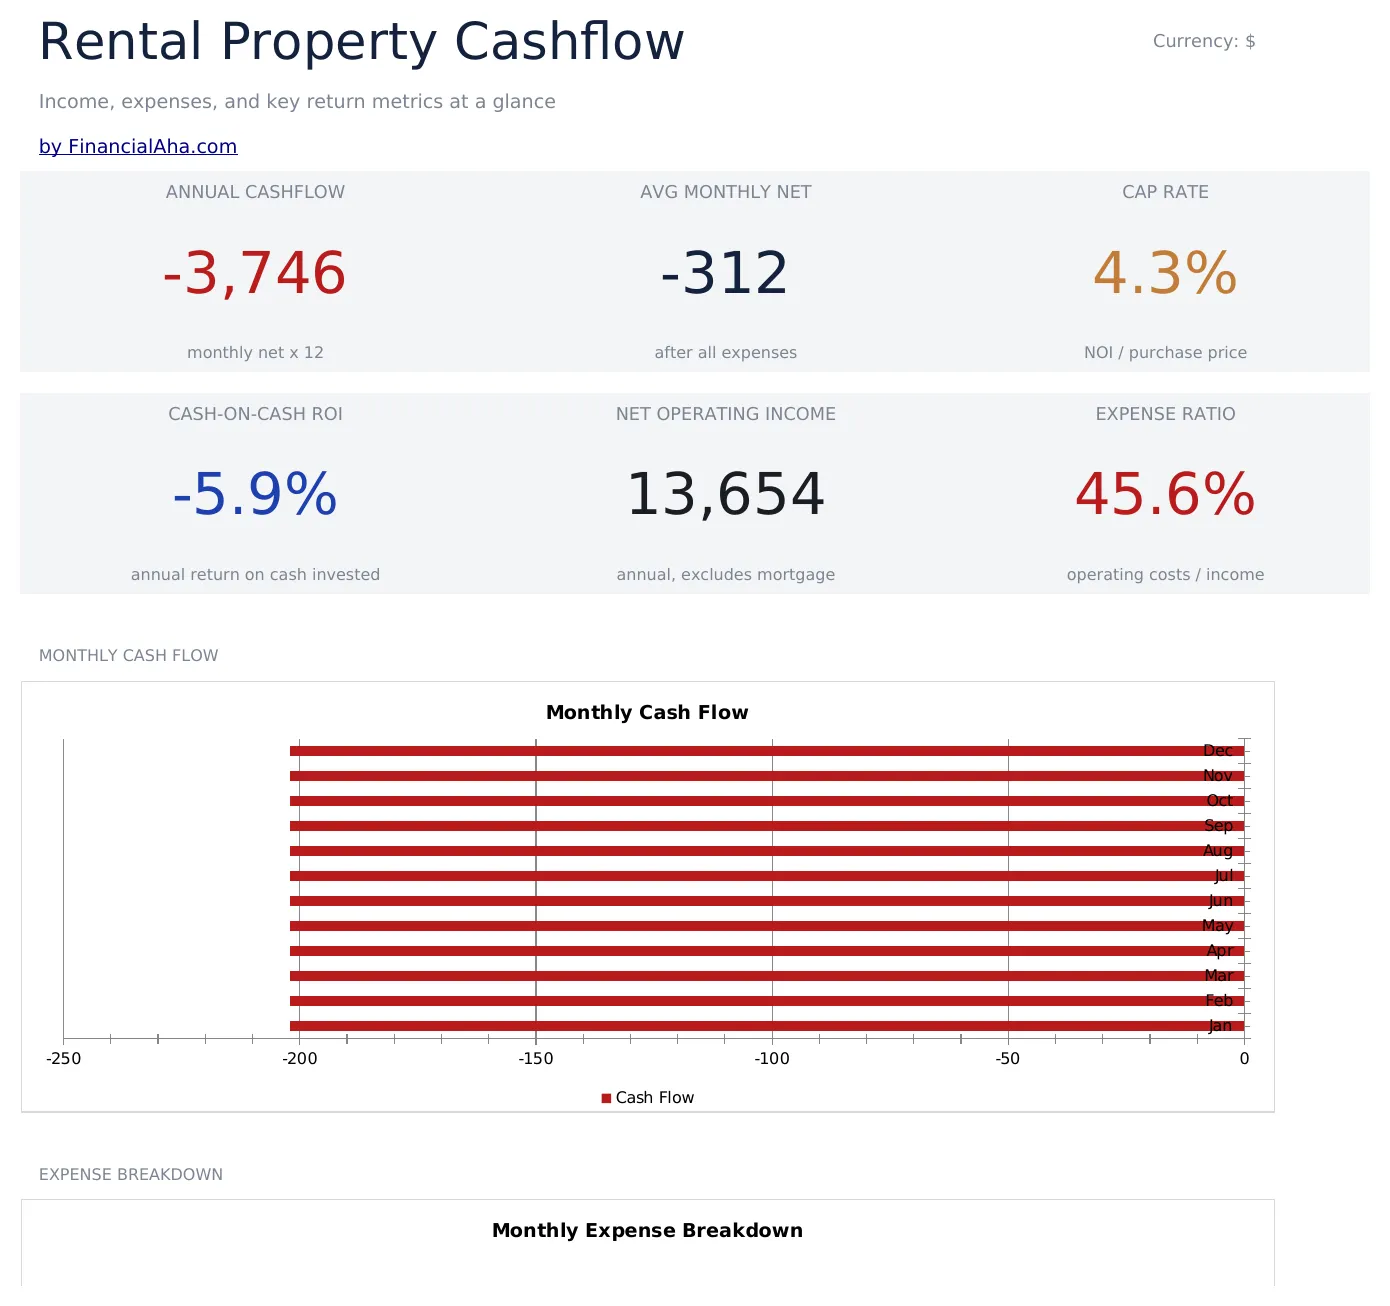
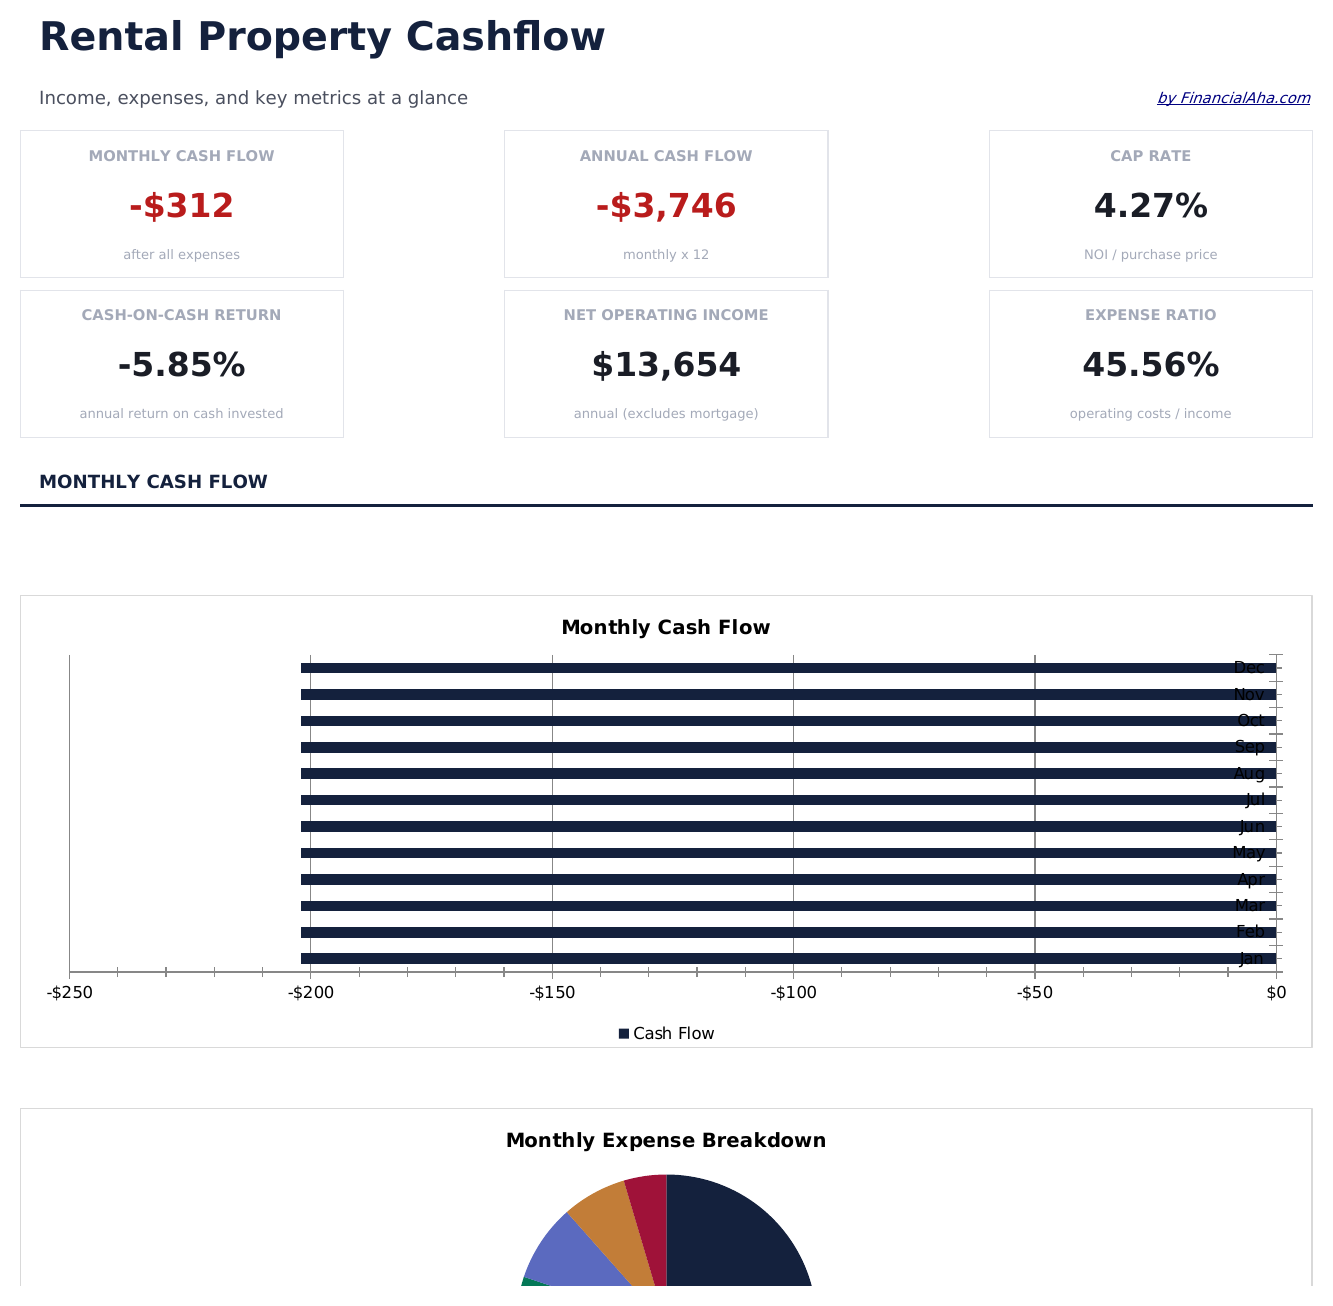
- Dashboard with property performance metrics including net cash flow, cap rate, and cash-on-cash return
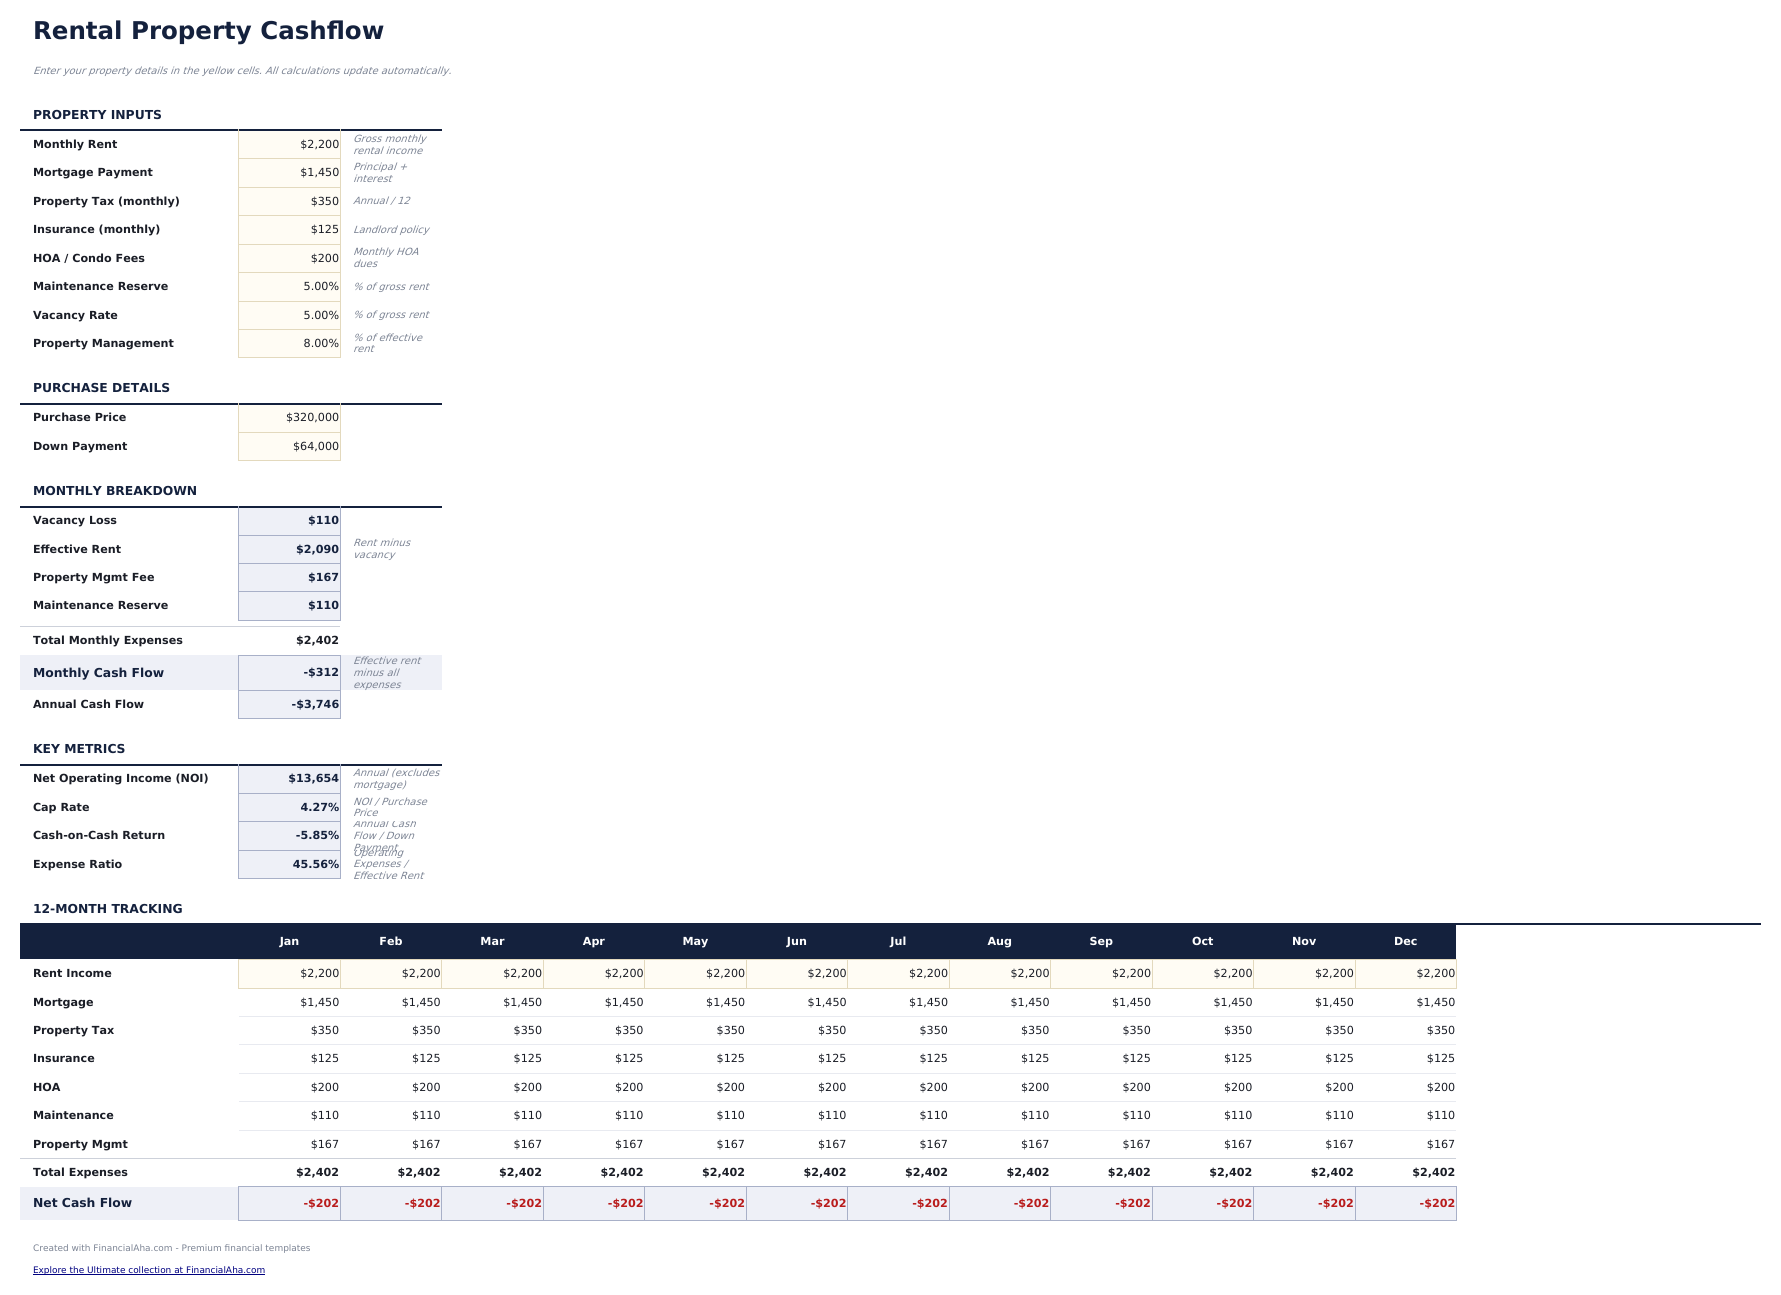
- Property setup with rental income, mortgage payment, property taxes, insurance, and management fee inputs
- Net cash flow calculations subtracting all expenses from gross rental income to show monthly and annual profit
- Vacancy and maintenance reserves with percentage-based inputs that automatically reduce effective income
- Return on investment metrics with color-coded input cells (yellow) and auto-calculated performance figures (blue)
- Works in Microsoft Excel, Google Sheets, and LibreOffice Calc with no setup required
Need more from this template?
The Essentials version covers everyday tracking. Ultimate goes further with multi-entity support, scenario analysis, and ultimate-grade reporting.
- Dashboard with property performance metrics including net cash flow, cap rate, and cash-on-cash return
- Property setup with rental income, mortgage payment, property taxes, insurance, and management fee inputs
- Net cash flow calculations subtracting all expenses from gross rental income to show monthly and annual profit
- Vacancy and maintenance reserves with percentage-based inputs that automatically reduce effective income
- Track up to 5 rental properties with purchase price, mortgage, taxes, insurance, HOA, maintenance, and management fee details
- Dashboard with 6 KPI cards: total monthly cash flow, total properties, gross rental income, total expenses, net operating income, and average cap rate
- Monthly cash flow sheet tracking income and expenses per property across 12 months with running totals and annual summary
- ROI Calculator showing cash-on-cash return, cap rate, gross yield, and total return per property and across the portfolio
- Sensitivity analysis grid showing how net cash flow changes as vacancy rate and rent price vary across 25 combinations
Preview
See what's inside this template
How to Use This Rental Property Cash Flow Template
Enter property details
Input monthly rental income, mortgage payment, property taxes, insurance, and management fees on the setup sheet.
Set vacancy and maintenance
Enter vacancy rate and maintenance reserve as percentages. These reduce effective income automatically.
Review net cash flow
The template calculates monthly and annual net cash flow after all expenses and reserves are deducted from rental income.
Check return metrics
The dashboard shows cap rate, cash-on-cash return, and net operating income for evaluating property performance.
Customer Reviews
What Our Customers Say
"If I get half as good at handling my finances as you are at customer service, this'll be the best $26 I've spent lately."
"Great tool! Simplifies financial planning without the hassle of complex spreadsheets."
"I recently purchased your super convenient spreadsheet, it really helps me!"
"They're great and super intuitive. Thank you!"
Built by Claude AI. Perfected by us.
We use Claude AI to draft each template, after a deep research. Then our team steps in. We refine the layout, stress-test every formula, fix edge cases, and polish the design until it feels like something we would actually use ourselves. The AI gets us 80% there. The last 20% is all human judgment.
Frequently Asked Questions
What is cap rate?
Capitalization rate divides net operating income by the property purchase price. It measures the return independent of financing.
What vacancy rate should I use?
Common assumptions range from 5% to 10% depending on market conditions and property type. Enter the rate that matches your local market.
Does it include mortgage payments?
Yes. The cash flow calculation deducts the full mortgage payment (principal and interest) from rental income alongside all other expenses.
Can I track multiple properties?
This template covers one property. Duplicate the file for each rental property and track them individually.
How do I open this in Google Sheets?
Upload the .xlsx file to Google Drive, then open it with Google Sheets. All formulas and formatting will be preserved.
More Essentials Business Finance Templates
Highlights:
Looking for premium spreadsheet templates?
Our paid templates include advanced multi-sheet dashboards, native Excel charts, and ongoing updates.
Get every Ultimate template instead
All 58 Ultimate templates in one purchase for $299 - $1,102 value, you keep $803.