Bedrijfsbudget Essentials-sjabloon
Plan en volg zakelijke inkomsten en uitgaven op maandbasis. Omvat operationele kosten, omzet en afdelingsbudgetten.
Wat zit erin
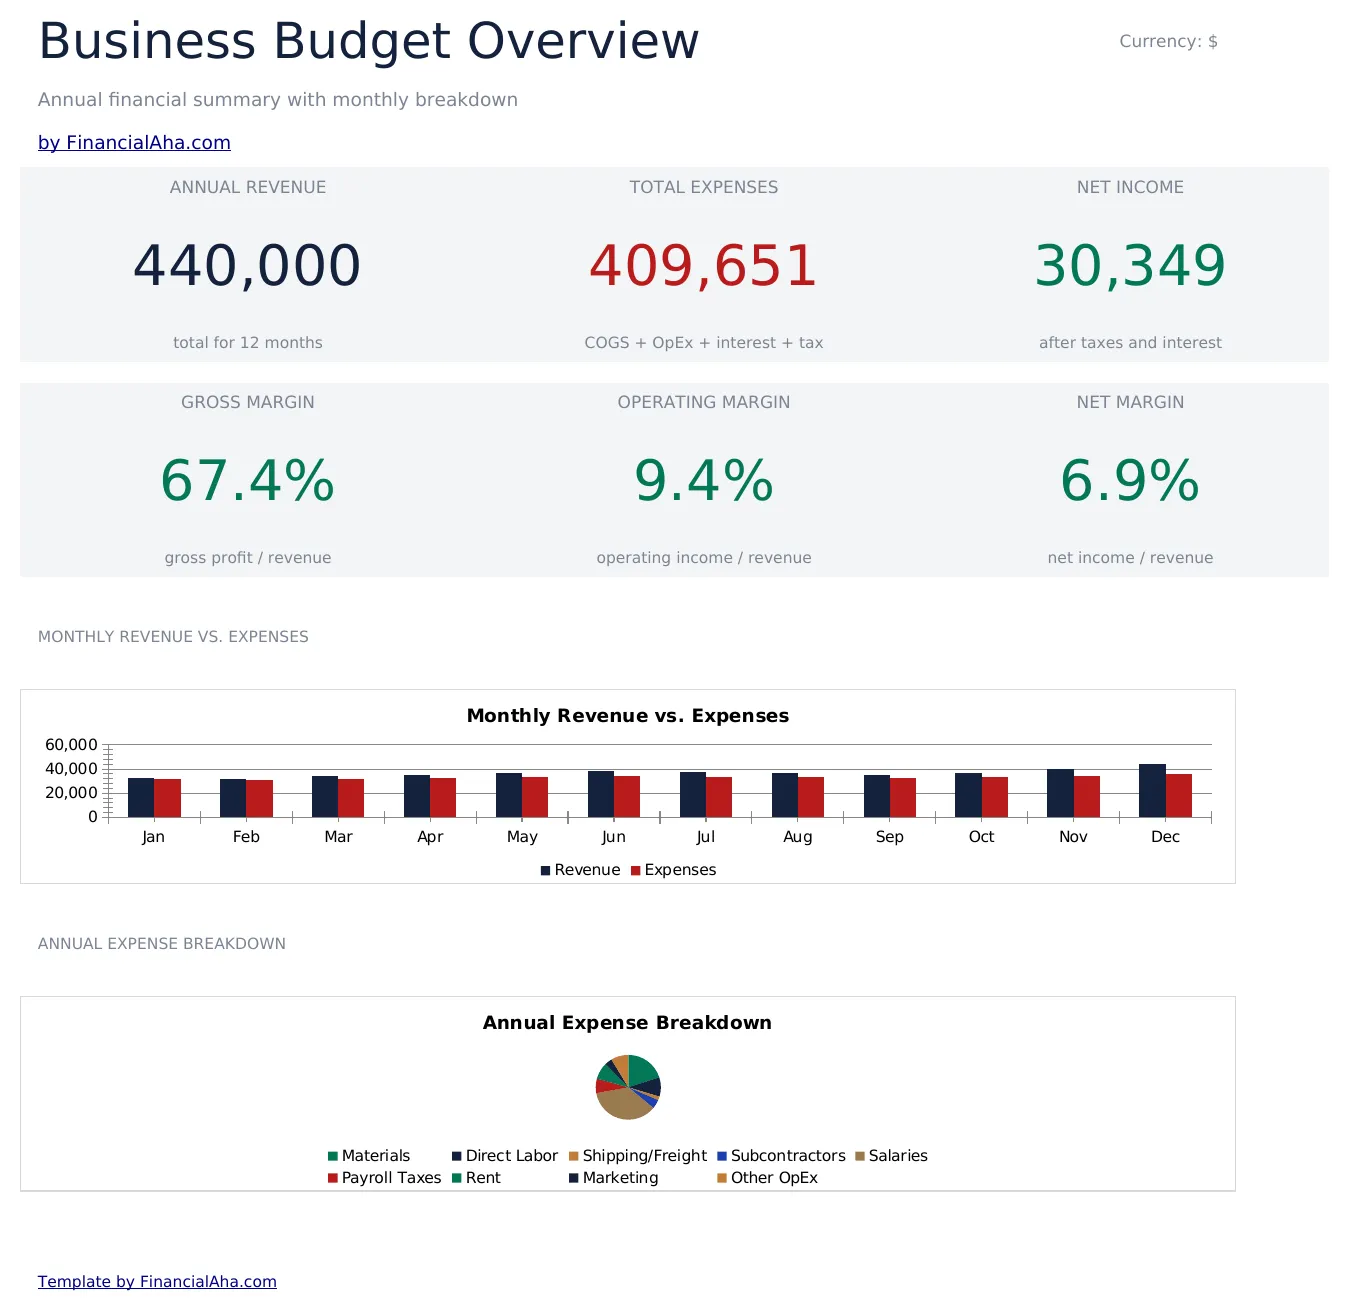
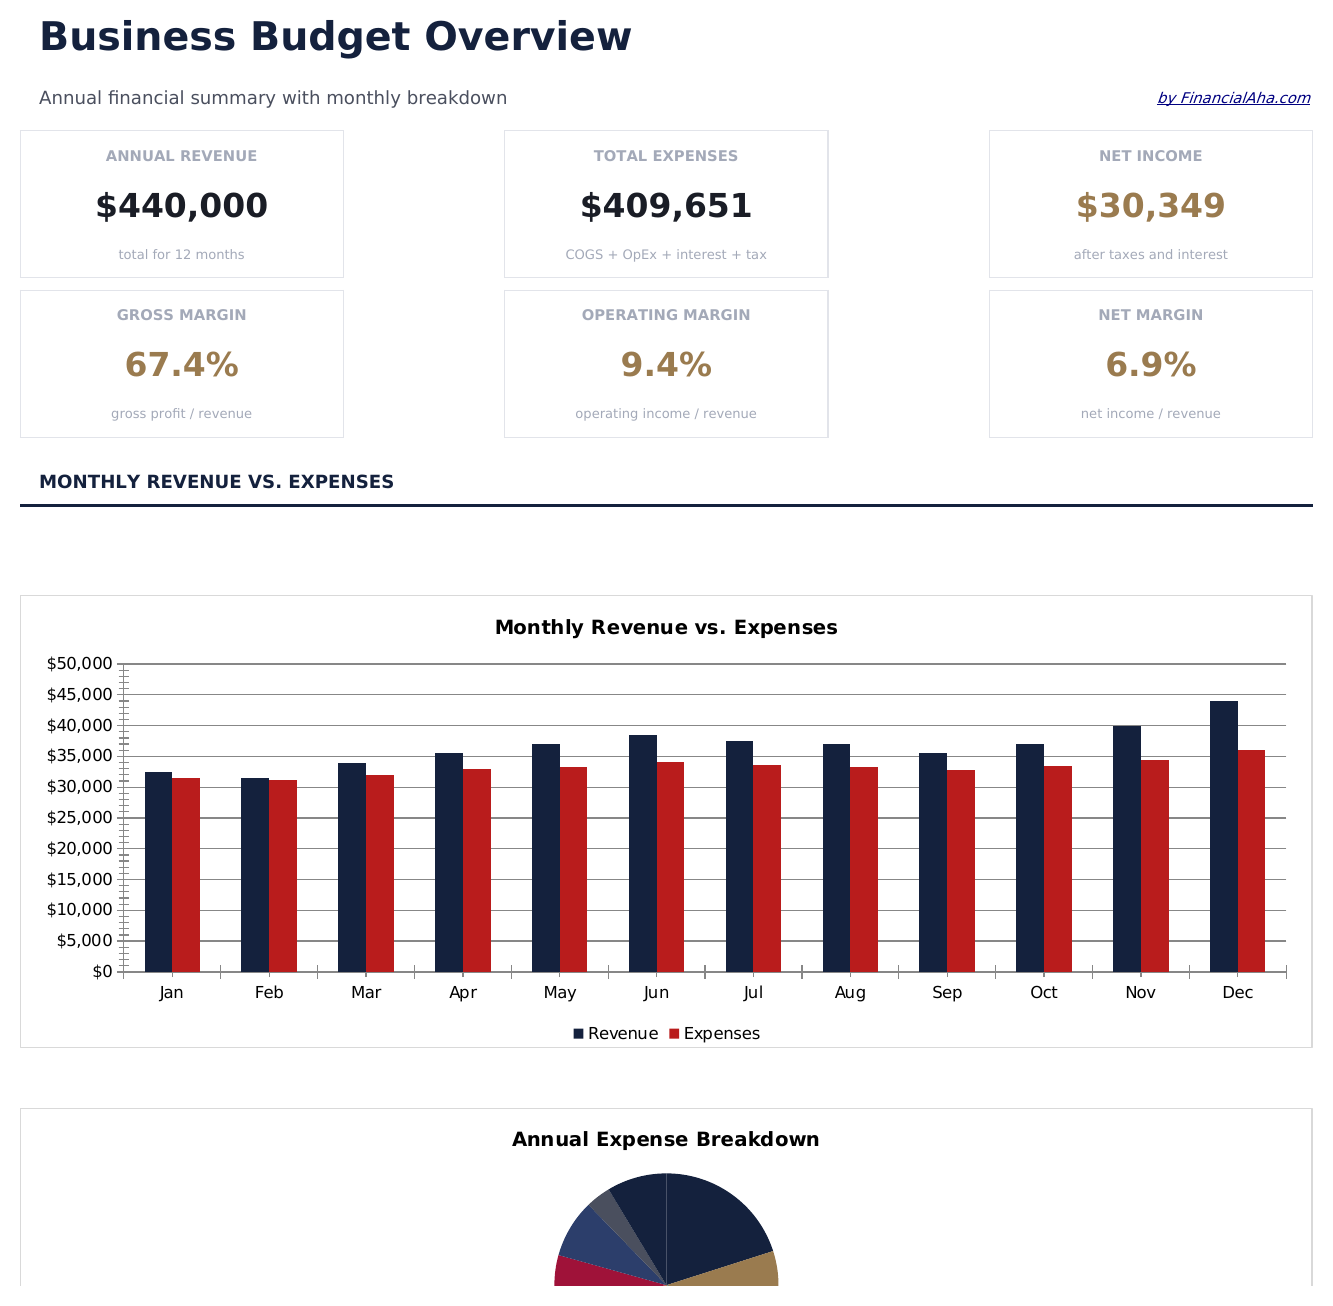
- Dashboard met bedrijfsbudgetoverzicht met totale omzet, totale uitgaven, netto-inkomen en budgetbenutting
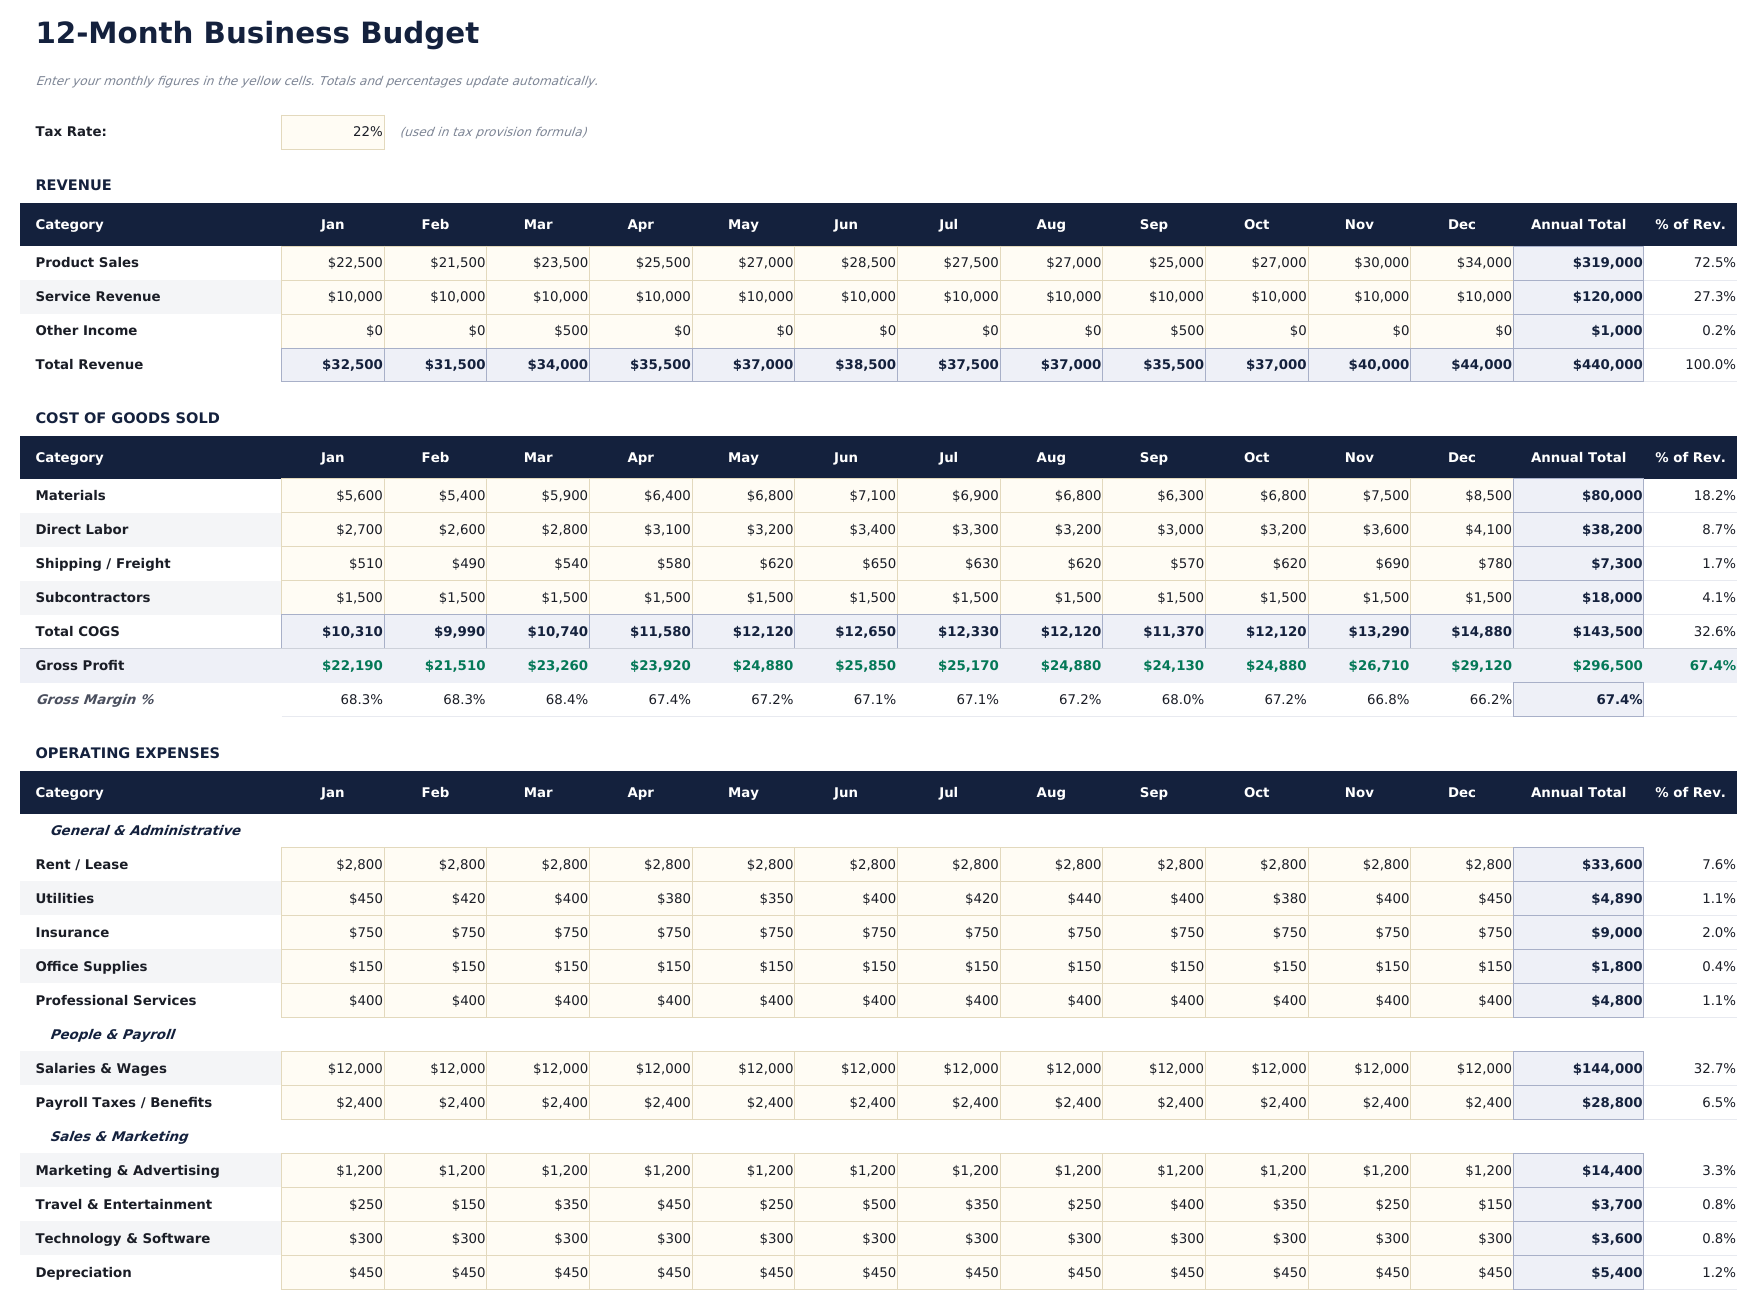
- Maandelijks budget met omzetcategorieen en uitgavenposten voor salarissen, huur, marketing, nutsvoorzieningen en benodigdheden
- Afdelings- of categorie-indelingen voor apart budgetbeheer van verkoop, operations, administratie en andere teams
- Budget versus werkelijke vergelijkingskolommen met automatische afwijkingsberekeningen voor elke omzet- en uitgavenpost
- Kleurgecodeerde afwijkingsindicatoren die gunstige en ongunstige afwijkingen markeren met automatisch berekende percentages
- Werkt in Microsoft Excel, Google Sheets en LibreOffice Calc zonder installatie
Need more from this template?
The Essentials version covers everyday tracking. Ultimate goes further with multi-entity support, scenario analysis, and ultimate-grade reporting.
- Dashboard met bedrijfsbudgetoverzicht met totale omzet, totale uitgaven, netto-inkomen en budgetbenutting
- Maandelijks budget met omzetcategorieen en uitgavenposten voor salarissen, huur, marketing, nutsvoorzieningen en benodigdheden
- Afdelings- of categorie-indelingen voor apart budgetbeheer van verkoop, operations, administratie en andere teams
- Budget versus werkelijke vergelijkingskolommen met automatische afwijkingsberekeningen voor elke omzet- en uitgavenpost
- Werkblad Omzetbudget met tot 10 omzetstromen, maandelijkse doelen en jaartotalen met bewerkbare groeiaannames
- Werkblad Kostenbudget met tot 15 uitgavencategorieën over 12 maanden met maandelijkse en jaarlijkse totalen
- Werkblad Afdelingsbudgetten dat budget toewijst over tot 6 afdelingen met personeelsbezetting, salaris en bedrijfskostenuitsplitsingen
- Dashboard met 6 KPI-kaarten: gebudgetteerde omzet, gebudgetteerde kosten, nettobudget, grootste uitgavencategorie, omzetgroeipercentage en operationele marge
- Werkblad Kwartaalbeoordeling dat Q1 tot en met Q4 gebudgetteerd versus werkelijke omzet, kosten en netto-inkomen vergelijkt met afwijkingsanalyse
Voorbeeld
Bekijk wat er in dit sjabloon zit
Hoe gebruik je dit Bedrijfsbudget sjabloon
Voer omzetcategorieen in
Maak een lijst van elke inkomstenbron met gebudgetteerde maandbedragen - productverkoop, servicevergoedingen, abonnementen of andere inkomstenstromen.
Voeg uitgavenposten toe
Vul operationele uitgaven in per categorie - salarissen, huur, marketing, nutsvoorzieningen, benodigdheden en verzekeringen met maandbudgetten.
Voer werkelijke bedragen in
Naarmate de maand vordert, registreer de werkelijke omzet en uitgaven. De afwijkingskolommen tonen waar u boven of onder budget zit.
Bekijk het dashboard
Het dashboard vat de totale omzet, totale uitgaven, netto-inkomen en algehele budgetbenutting samen met afwijkingsmarkeringen.
Customer Reviews
What Our Customers Say
"If I get half as good at handling my finances as you are at customer service, this'll be the best $26 I've spent lately."
"Great tool! Simplifies financial planning without the hassle of complex spreadsheets."
"I recently purchased your super convenient spreadsheet, it really helps me!"
"They're great and super intuitive. Thank you!"
Gebouwd door Claude AI. Verfijnd door ons.
We gebruiken Claude AI om elk sjabloon te ontwerpen, na uitgebreid onderzoek. Daarna neemt ons team het over. We verfijnen de indeling, testen elke formule grondig, lossen randgevallen op en polijsten het ontwerp totdat het iets is dat we zelf ook echt zouden gebruiken. De AI brengt ons 80% van de weg. De laatste 20% is puur menselijk oordeel.
Veelgestelde vragen
Kan ik per afdeling budgetteren?
Ja. Organiseer uitgavencategorieen per afdeling - verkoop, marketing, operations, administratie. Voeg afdelingssubtotalen toe voor budgetbeheer per afdeling.
Hoe werkt het bijhouden van afwijkingen?
De template berekent het verschil tussen gebudgetteerde en werkelijke bedragen voor elke post. Gunstige afwijkingen (onder budget) en ongunstige (boven budget) zijn kleurgecodeerd.
Kan ik het uitbreiden naar een heel jaar?
Ja. Voeg kolommen toe voor elke maand tot 12 maanden. Het templateformaat ondersteunt maandelijks bijhouden over het volledige boekjaar.
Is dit voor kleine of grote bedrijven?
Het werkt voor elke omvang. Kleine bedrijven gebruiken minder categorieen, terwijl grotere bedrijven meer posten en afdelingsindelingen toevoegen.
Hoe open ik dit in Google Sheets?
Upload het .xlsx-bestand naar Google Drive en open het vervolgens met Google Sheets. Alle formules en opmaak blijven behouden.
Meer Essentials-sjablonen voor Bedrijfsfinancien
Hoogtepunten:
Op zoek naar premium spreadsheet-sjablonen?
Onze betaalde sjablonen bevatten geavanceerde dashboards met meerdere werkbladen, ingebouwde Excel-grafieken en doorlopende updates.
Krijg in plaats daarvan elk Ultimate sjabloon
Alle 58 Ultimate sjablonen in één aankoop voor $299 - $1,102 waarde, u houdt $803 over.