Verkoopprognose Essentials-sjabloon
Projecteer toekomstige verkopen per product, dienst of kanaal. Bouw omzetprognoses met groeiaannames en seizoenscorrecties.
Wat zit erin
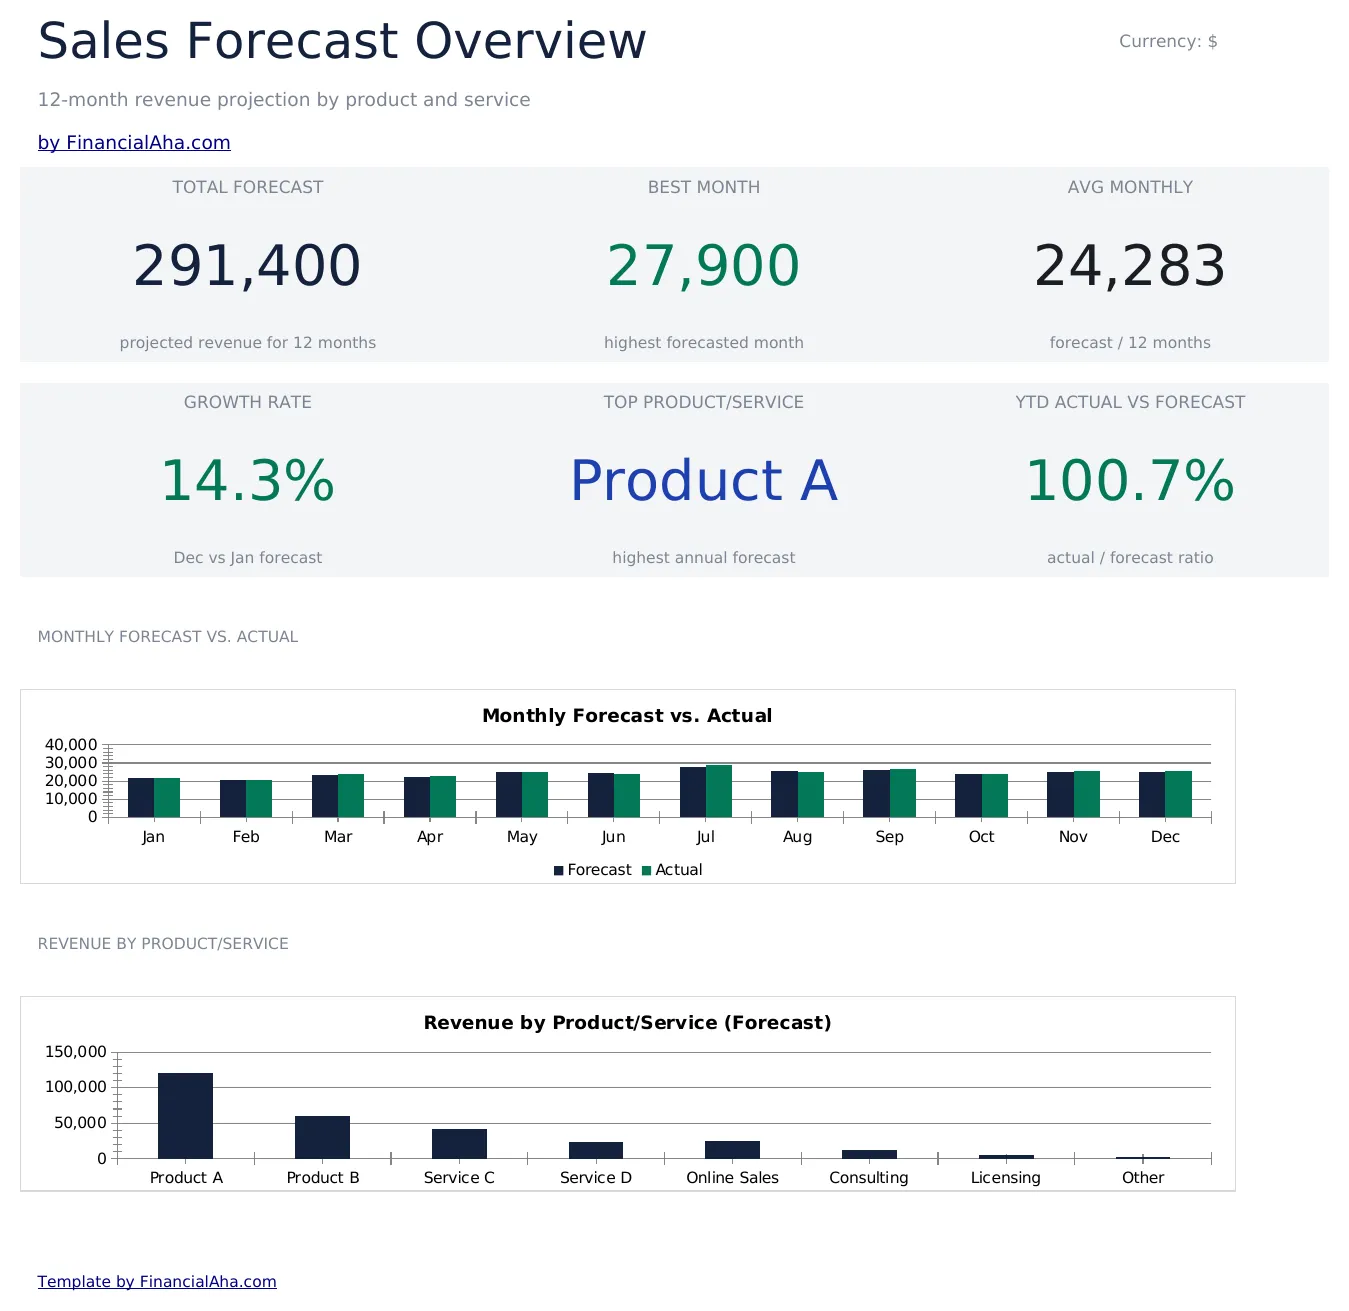
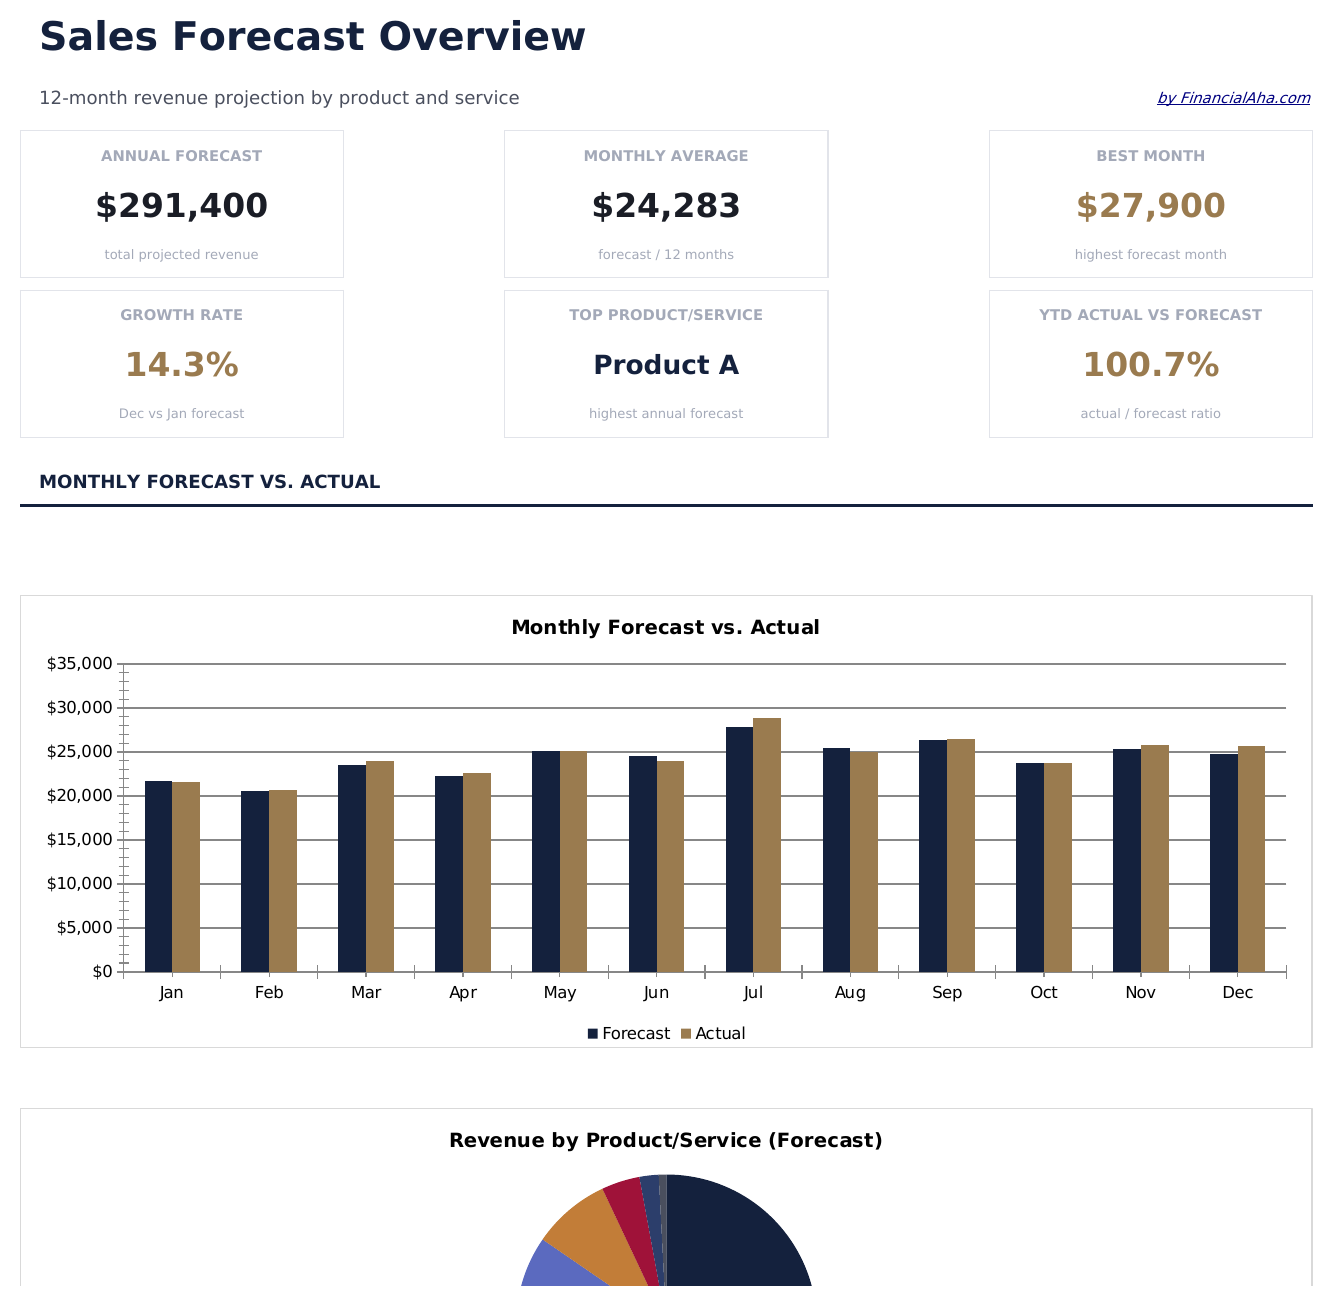
- Dashboard met verkoopprognosesamenvatting met geprojecteerde totale omzet, groeipercentage en top-productlijnen
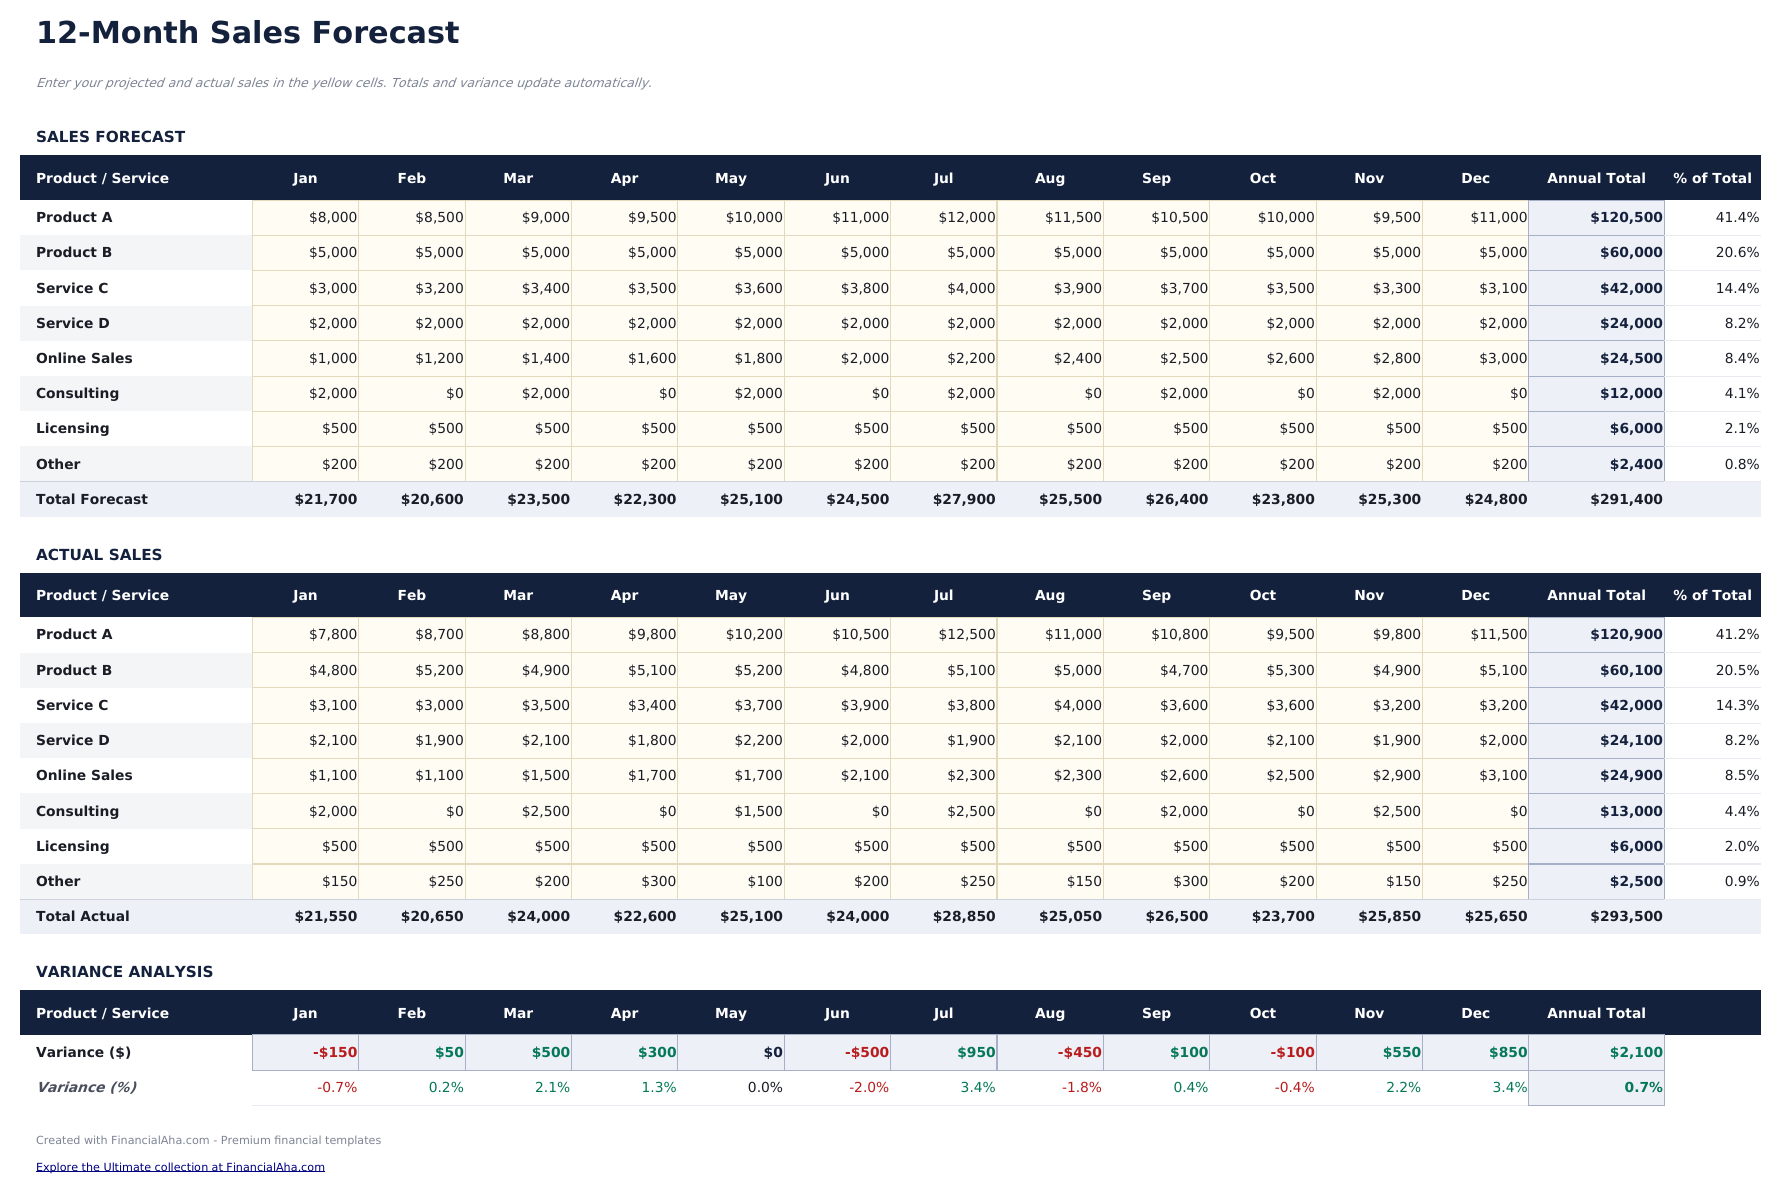
- Verkoopprognose per product of kanaal met eenheidsvolume, gemiddelde prijs en totale omzet per regelpost
- Groeiaannames met aanpasbare maand-op-maand of jaar-op-jaar percentuele stijgingsinvoer
- Maandelijkse en jaarlijkse prognosekolommen die groeipercentages toepassen op basisgegevens over de prognoseperiode
- Werkelijk vs. prognose vergelijkingskolommen met kleurgecodeerde variantie-indicatoren die over- of onderprestatie markeren
- Werkt in Microsoft Excel, Google Sheets en LibreOffice Calc zonder installatie
Need more from this template?
The Essentials version covers everyday tracking. Ultimate goes further with multi-entity support, scenario analysis, and ultimate-grade reporting.
- Dashboard met verkoopprognosesamenvatting met geprojecteerde totale omzet, groeipercentage en top-productlijnen
- Verkoopprognose per product of kanaal met eenheidsvolume, gemiddelde prijs en totale omzet per regelpost
- Groeiaannames met aanpasbare maand-op-maand of jaar-op-jaar percentuele stijgingsinvoer
- Maandelijkse en jaarlijkse prognosekolommen die groeipercentages toepassen op basisgegevens over de prognoseperiode
- Volg tot 50 actieve deals met bedrijf, contactpersoon, dealgrootte, fase, waarschijnlijkheid, verwachte sluitdatum en eigenaar
- Dashboard met 6 KPI-kaarten: totale pijplijnwaarde, gewogen pijplijn, deals in pijplijn, gemiddelde dealgrootte, winstpercentage en prognose deze maand
- Pijplijnwerkblad met fasegebaseerde waarschijnlijkheidsweging die automatisch de gewogen prognosewaarde per deal berekent
- Werkblad Maandelijkse Prognose dat verwachte boekingen per maand projecteert op basis van sluitdatums en gewogen dealwaarden
- Werkblad Faseanalyse met aantal deals, totale waarde, gemiddelde grootte en gewogen waarde per pijplijnfase
Voorbeeld
Bekijk wat er in dit sjabloon zit
Hoe gebruik je dit Verkoopprognose sjabloon
Productlijnen definieren
Vermeld elk product, elke dienst of elk omzetkanaal als een aparte rij met het basisverkoopvolume en de gemiddelde prijs.
Groeiaannames instellen
Voer maand-op-maand of jaar-op-jaar groeipercentages in voor elke productlijn. Het sjabloon past deze toe op de basiscijfers.
Prognoses bekijken
Maandelijkse kolommen tonen de geprojecteerde omzet die groeit over de prognoseperiode op basis van je volume- en prijsaannames.
Vergelijken met werkelijke cijfers
Naarmate werkelijke verkopen binnenkomen, voer je de werkelijke cijfers in naast de prognoses. De variantiekolom toont waar prestaties afwijken van de prognose.
Customer Reviews
What Our Customers Say
"If I get half as good at handling my finances as you are at customer service, this'll be the best $26 I've spent lately."
"Great tool! Simplifies financial planning without the hassle of complex spreadsheets."
"I recently purchased your super convenient spreadsheet, it really helps me!"
"They're great and super intuitive. Thank you!"
Gebouwd door Claude AI. Verfijnd door ons.
We gebruiken Claude AI om elk sjabloon te ontwerpen, na uitgebreid onderzoek. Daarna neemt ons team het over. We verfijnen de indeling, testen elke formule grondig, lossen randgevallen op en polijsten het ontwerp totdat het iets is dat we zelf ook echt zouden gebruiken. De AI brengt ons 80% van de weg. De laatste 20% is puur menselijk oordeel.
Veelgestelde vragen
Kan ik per kanaal prognosticeren?
Ja. Gebruik elke rij voor een ander verkoopkanaal - online, retail, groothandel of direct. Het sjabloon telt over alle kanalen op.
Hoe stel ik groeipercentages in?
Voer een groeipercentage per productlijn in. Het sjabloon past dit percentage toe op de verkopen van de vorige maand om de prognose van elke volgende maand te genereren.
Worden seizoenscorrecties verwerkt?
Je kunt individuele maandprognoses handmatig hoger of lager aanpassen om seizoenspatronen te verwerken bovenop het basisgroeipercentage.
Kan ik de prognose vergelijken met werkelijke cijfers?
Ja. Werkelijk vs. prognose vergelijkingskolommen met variantie-indicatoren tonen of de werkelijke verkopen voor- of achterlopen op de prognose.
Hoe open ik dit in Google Sheets?
Upload het .xlsx-bestand naar Google Drive en open het vervolgens met Google Sheets. Alle formules en opmaak blijven behouden.
Meer Essentials-sjablonen voor Bedrijfsfinancien
Hoogtepunten:
Op zoek naar premium spreadsheet-sjablonen?
Onze betaalde sjablonen bevatten geavanceerde dashboards met meerdere werkbladen, ingebouwde Excel-grafieken en doorlopende updates.
Krijg in plaats daarvan elk Ultimate sjabloon
Alle 58 Ultimate sjablonen in één aankoop voor $299 - $1,102 waarde, u houdt $803 over.