销售预测 Essentials 模板
按产品、服务或渠道预测未来销售。基于增长假设和季节性调整构建收入预测。
包含内容
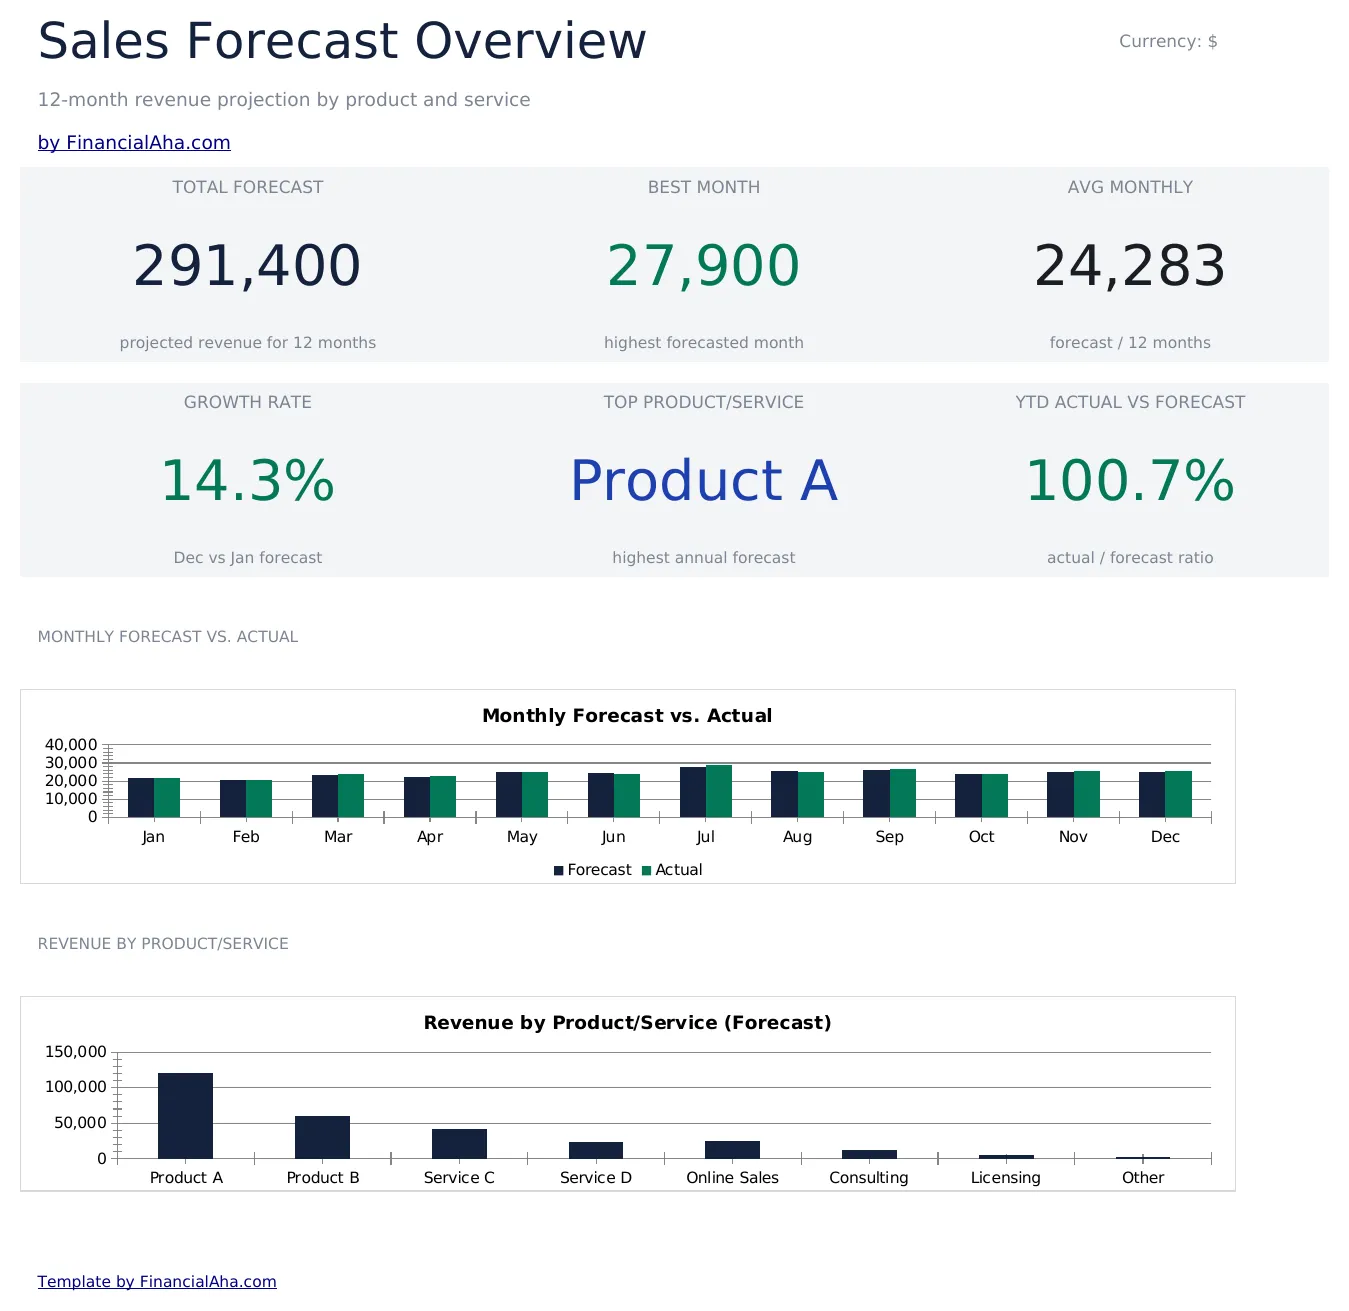
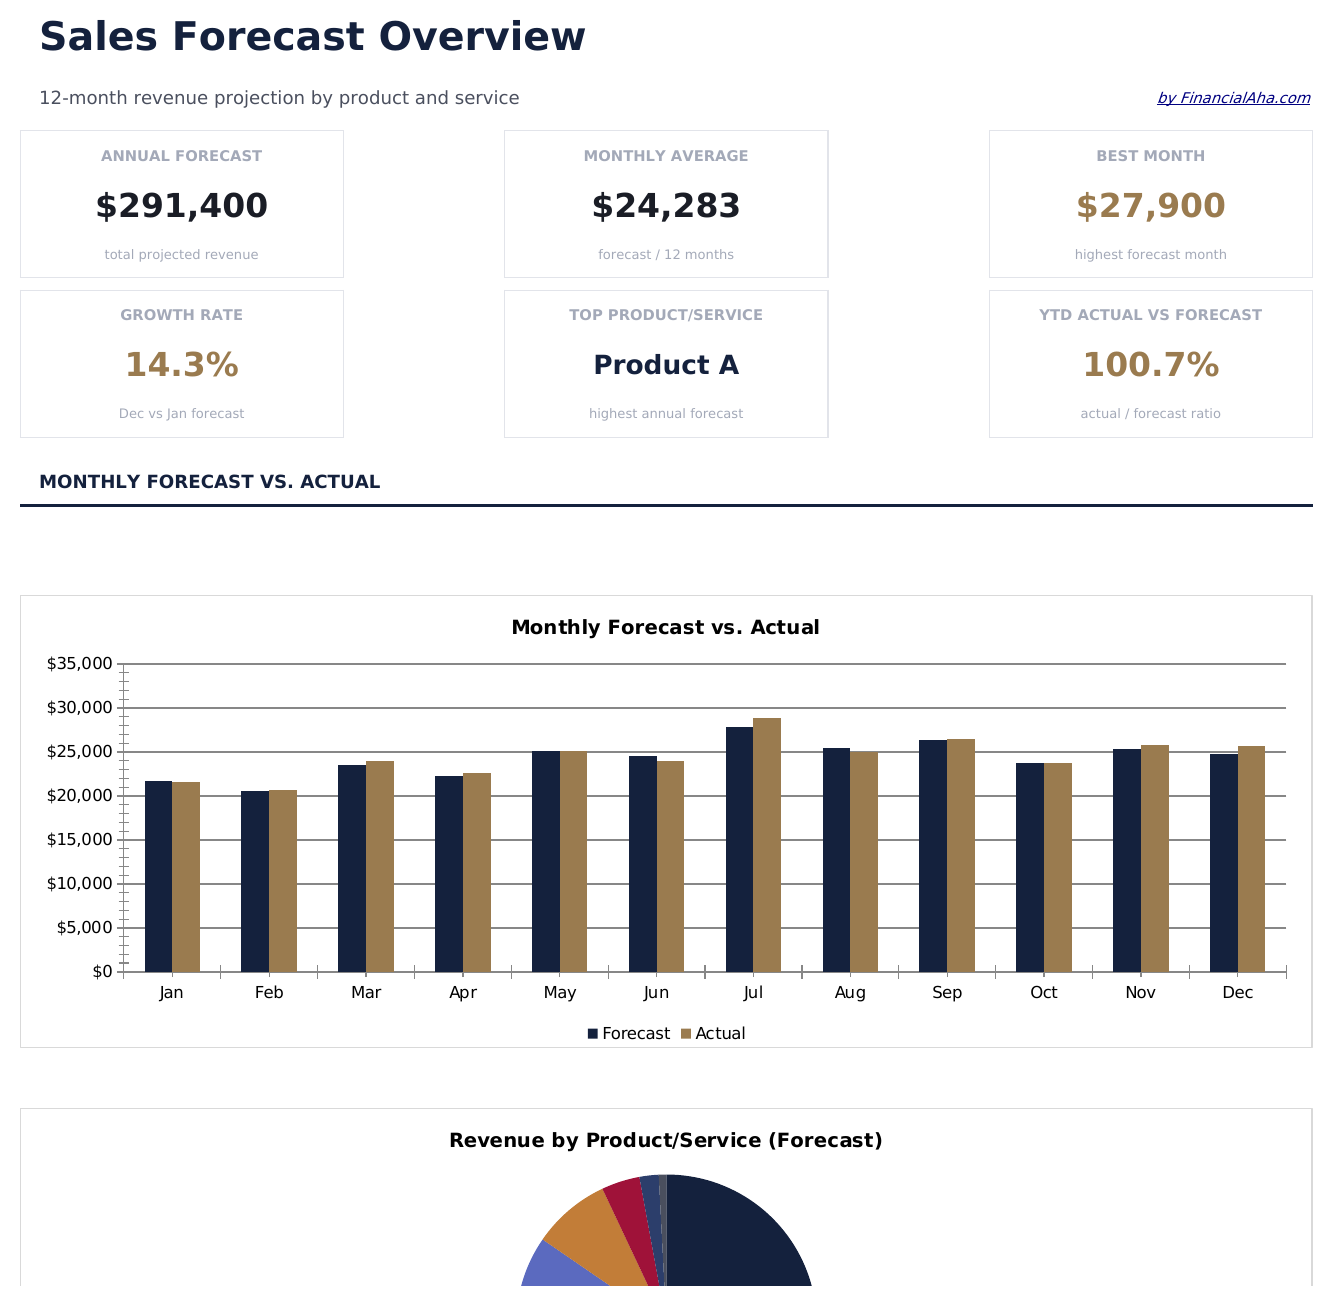
- 仪表板包含销售预测汇总,显示预计总收入、增长率和主要产品线
- 按产品或渠道的销售预测,包含单位销量、平均价格和每个行项目的总收入
- 增长率假设,可调整的环比或同比百分比增长输入
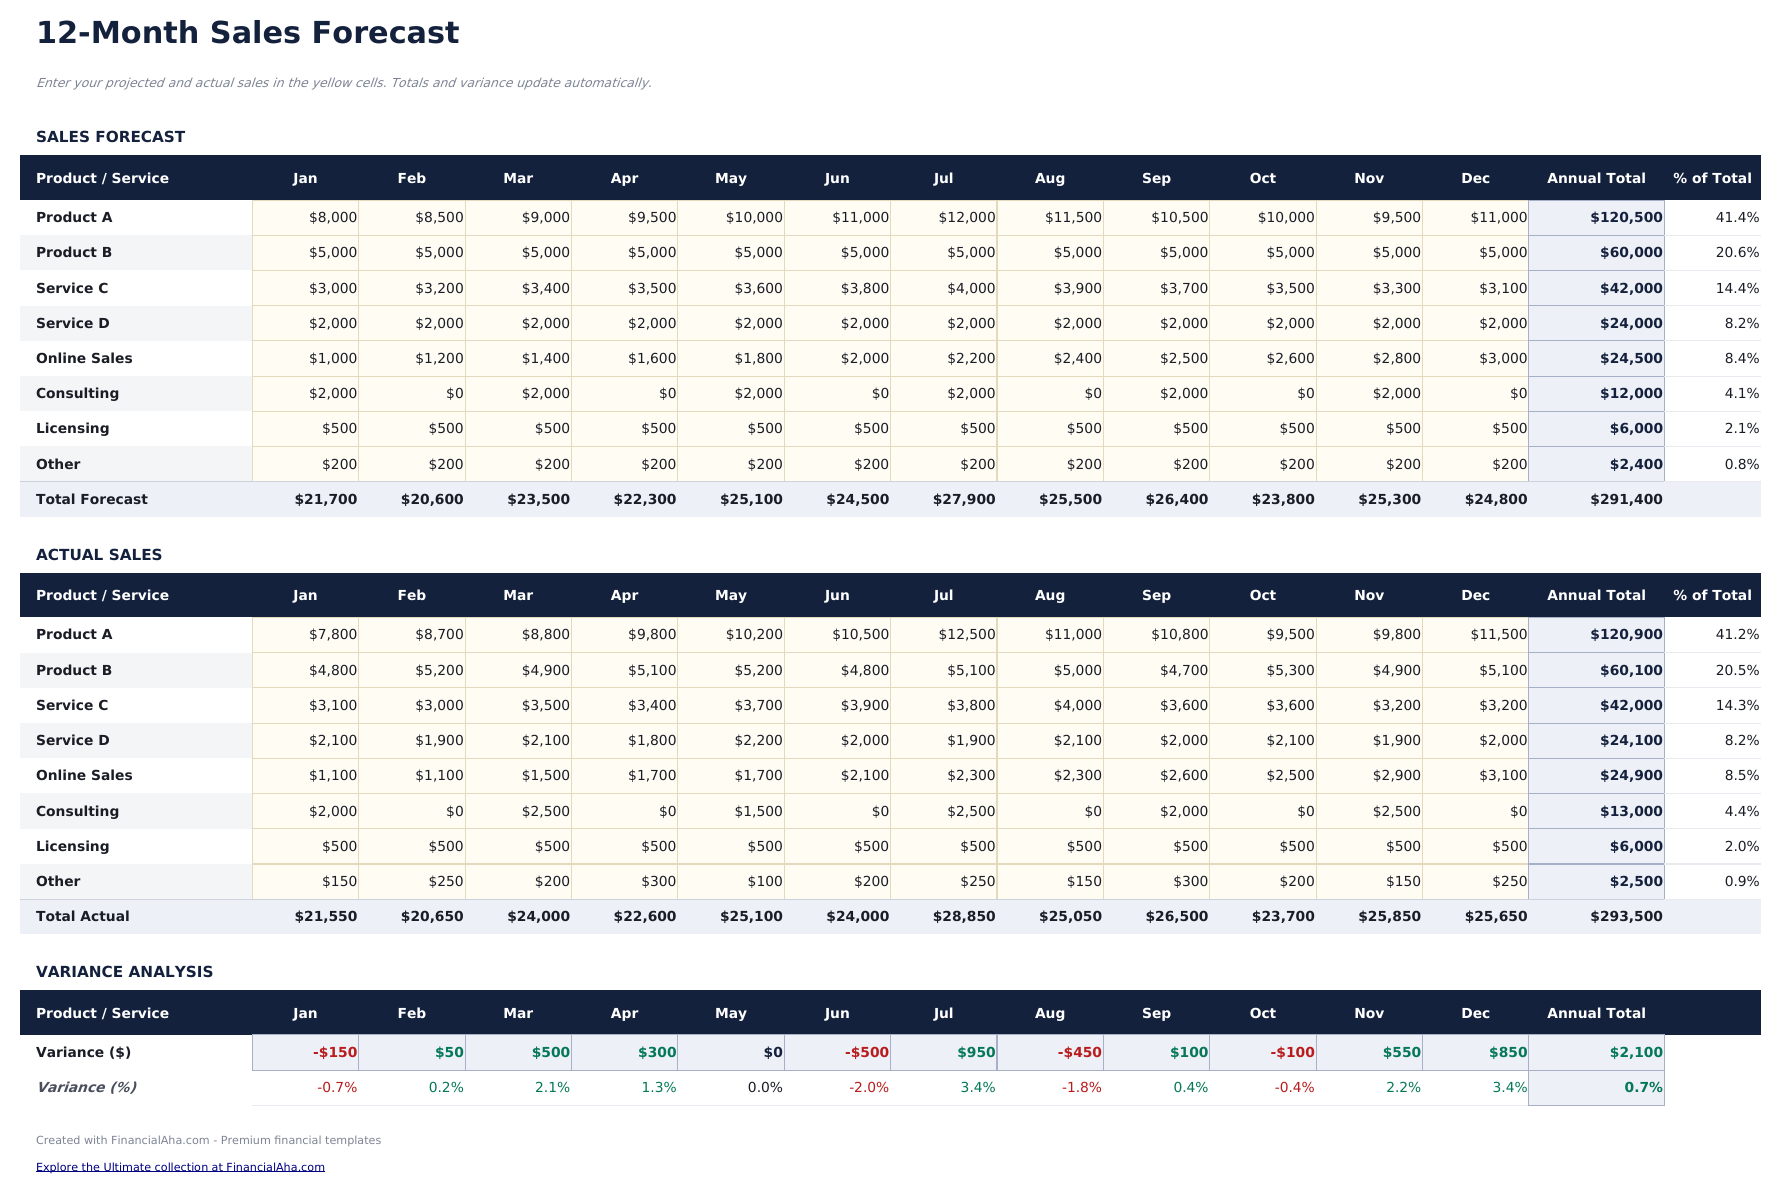
- 月度和年度预测列,将增长率应用于基线数据,覆盖整个预测期间
- 实际与预测对比列,彩色标记的差异指示器,突出显示超额或不足表现
- 适用于 Microsoft Excel、Google Sheets 和 LibreOffice Calc,无需任何设置
Need more from this template?
The Essentials version covers everyday tracking. Ultimate goes further with multi-entity support, scenario analysis, and ultimate-grade reporting.
- 仪表板包含销售预测汇总,显示预计总收入、增长率和主要产品线
- 按产品或渠道的销售预测,包含单位销量、平均价格和每个行项目的总收入
- 增长率假设,可调整的环比或同比百分比增长输入
- 月度和年度预测列,将增长率应用于基线数据,覆盖整个预测期间
- 跟踪最多50笔活跃交易,包含公司、联系人、交易规模、阶段、概率、预期成交日期和负责人
- 仪表板包含6个KPI卡片:管道总价值、加权管道、管道中交易数、平均交易规模、成交率和本月预测
- 管道表带有基于阶段的概率加权,自动计算每笔交易的加权预测值
- 月度预测表根据成交日期和加权交易价值预测每月预期订单
- 阶段分析表显示每个管道阶段的交易数量、总价值、平均规模和加权价值
预览
查看此模板的内容
如何使用这个销售预测模板
定义产品线
将每个产品、服务或收入渠道作为单独一行列出,附上基线销量和平均价格。
设置增长假设
为每个产品线输入环比或同比增长率。模板将其应用于基线数据。
查看预测结果
月度列显示基于您的销量和定价假设,在预测期间内增长的预计收入。
与实际数据对比
实际销售数据出来后,在预测旁输入实际数据。差异列显示实际表现与预测的差异。
Customer Reviews
What Our Customers Say
"If I get half as good at handling my finances as you are at customer service, this'll be the best $26 I've spent lately."
"Great tool! Simplifies financial planning without the hassle of complex spreadsheets."
"I recently purchased your super convenient spreadsheet, it really helps me!"
"They're great and super intuitive. Thank you!"
由 Claude AI 构建,经我们精心打磨。
我们使用 Claude AI 在深入研究后起草每个模板。然后由团队接手,优化布局、全面测试每个公式、修复边界情况,并打磨设计,直到达到我们自己愿意使用的标准。AI 完成了 80% 的工作,最后 20% 靠的是人工判断。
常见问题
可以按渠道预测吗?
可以。每行代表一个不同的销售渠道 - 线上、零售、批发或直销。模板汇总所有渠道的合计。
如何设置增长率?
为每个产品线输入百分比增长率。模板将此比率应用于上月销售额,生成每个后续月份的预测。
它能处理季节性调整吗?
您可以手动调整个别月份的预测值,在基础增长率之上按季节性模式进行上调或下调。
可以将预测与实际数据对比吗?
可以。实际与预测对比列和差异指示器显示实际销售是超前还是落后于预测。
如何在 Google Sheets 中打开?
将 .xlsx 文件上传到 Google Drive,然后使用 Google Sheets 打开。所有公式和格式都会保留。
更多 企业财务 Essentials 模板
亮点:
不如获取每一个 Ultimate 模板
全部 58 个 Ultimate 模板一次购买即可获得,仅需 $299 - 价值 $1,102,您可节省 $803。