Pronóstico de Ventas Plantilla Essentials
Proyecta ventas futuras por producto, servicio o canal. Construye pronósticos de ingresos con supuestos de crecimiento y ajustes estacionales.
Qué incluye
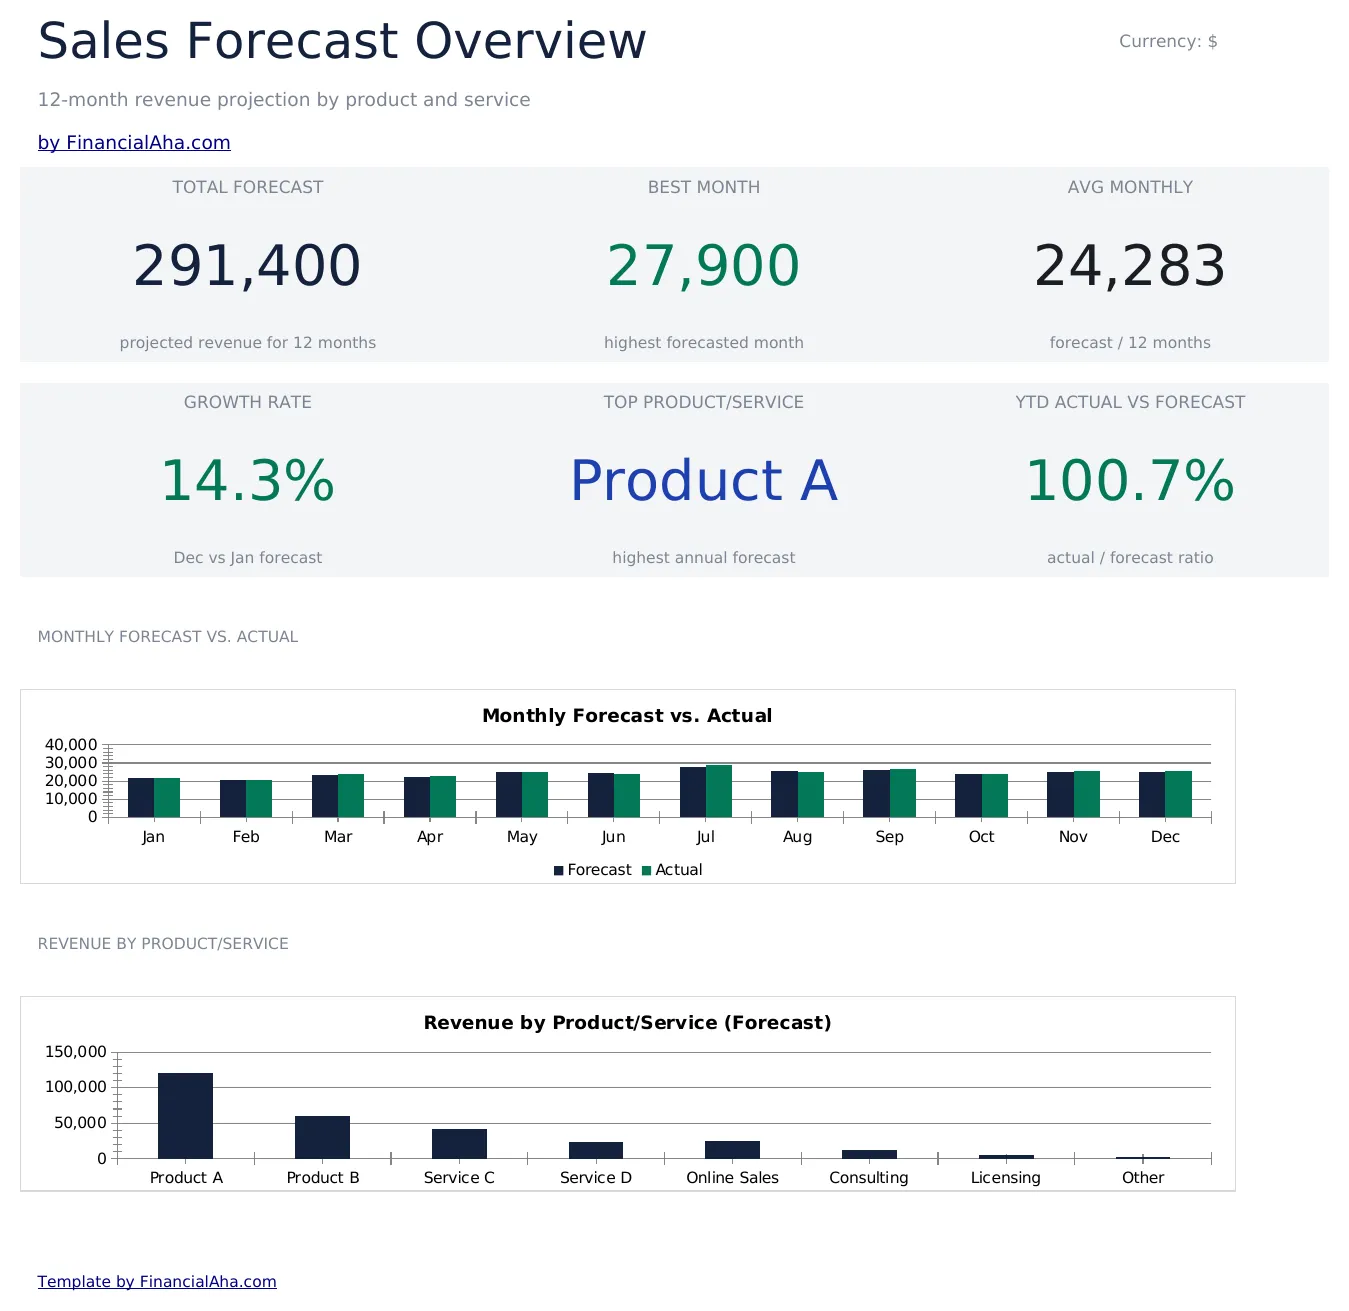
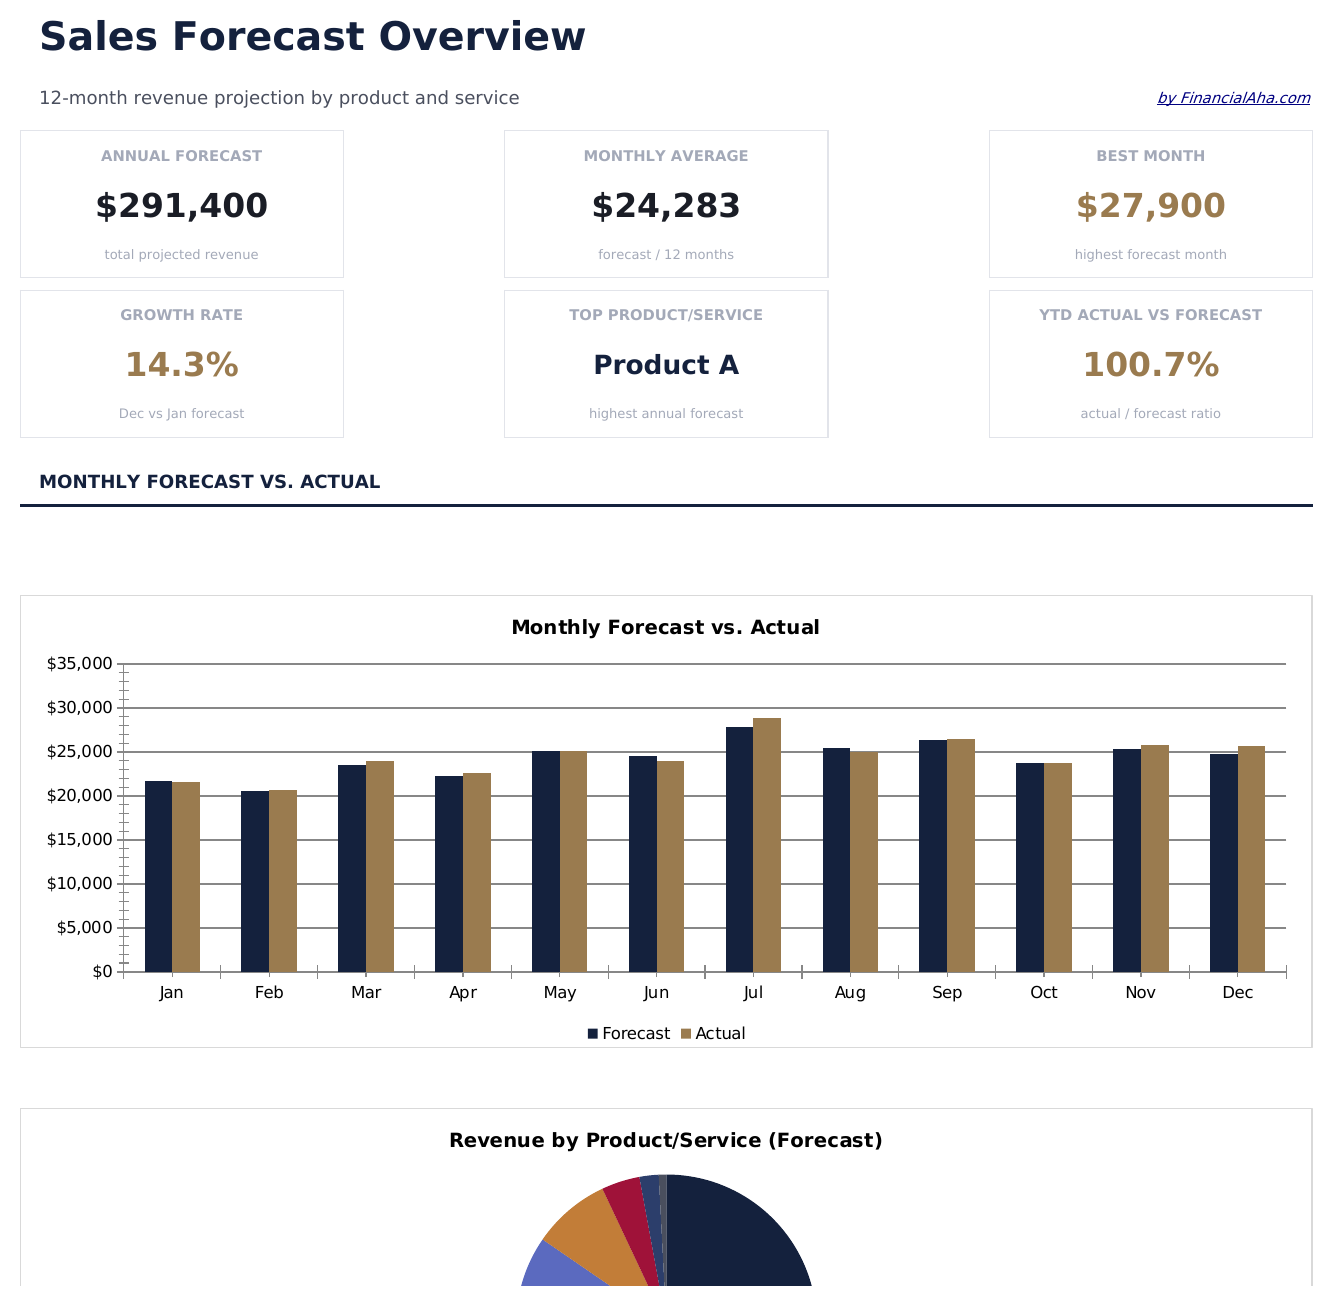
- Panel con resumen de pronóstico de ventas mostrando ingresos totales proyectados, tasa de crecimiento y principales líneas de productos
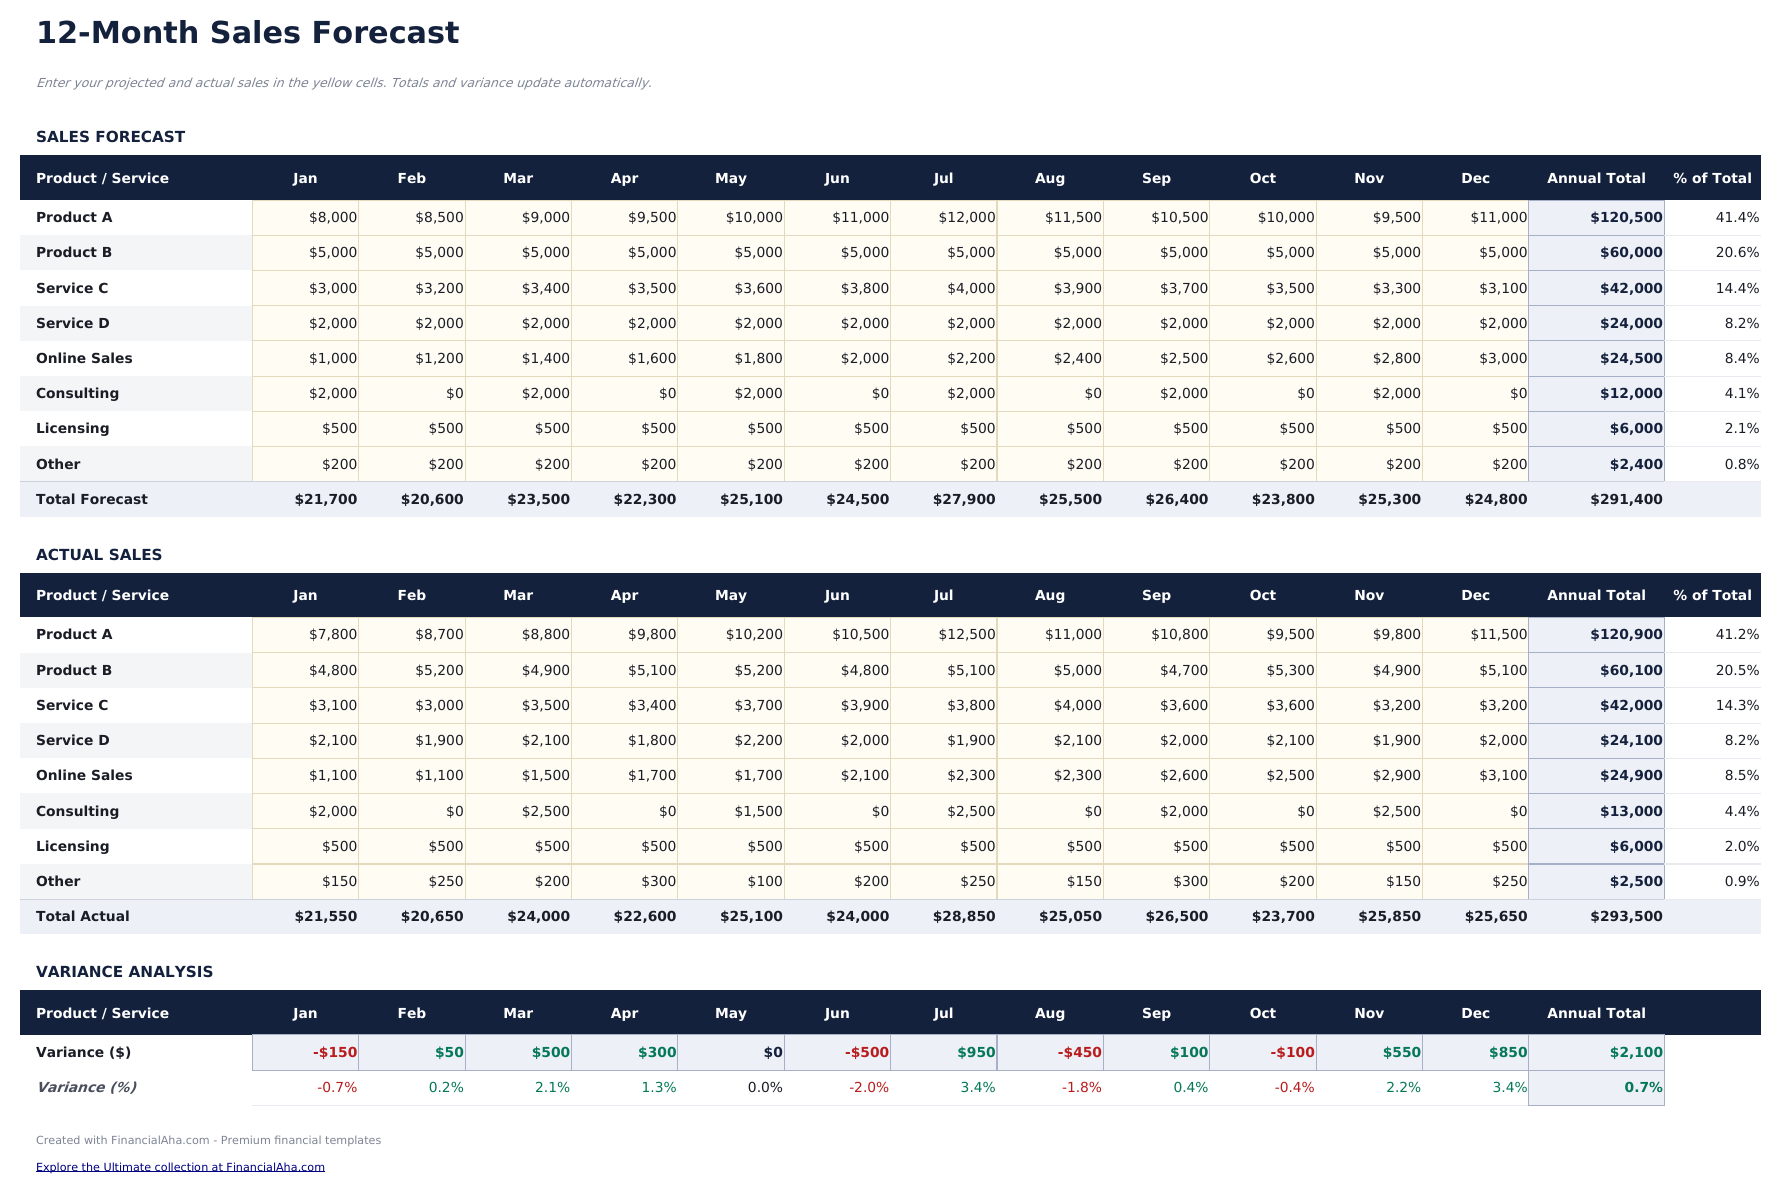
- Pronóstico de ventas por producto o canal con volumen de unidades, precio promedio e ingreso total por línea
- Supuestos de tasa de crecimiento con porcentajes ajustables de incremento mes a mes o año a año
- Columnas de proyección mensual y anual que aplican tasas de crecimiento a las cifras base a lo largo del período del pronóstico
- Columnas de comparación real vs. pronóstico con indicadores de variación con código de color resaltando rendimiento superior o inferior
- Funciona en Microsoft Excel, Google Sheets y LibreOffice Calc sin configuración necesaria
Need more from this template?
The Essentials version covers everyday tracking. Ultimate goes further with multi-entity support, scenario analysis, and ultimate-grade reporting.
- Panel con resumen de pronóstico de ventas mostrando ingresos totales proyectados, tasa de crecimiento y principales líneas de productos
- Pronóstico de ventas por producto o canal con volumen de unidades, precio promedio e ingreso total por línea
- Supuestos de tasa de crecimiento con porcentajes ajustables de incremento mes a mes o año a año
- Columnas de proyección mensual y anual que aplican tasas de crecimiento a las cifras base a lo largo del período del pronóstico
- Seguimiento de hasta 50 negocios activos con empresa, contacto, monto del negocio, etapa, probabilidad, fecha de cierre esperada y responsable
- Panel con 6 tarjetas de KPI: valor total del pipeline, pipeline ponderado, negocios en pipeline, tamaño promedio de negocio, tasa de cierre y pronóstico del mes
- Hoja de Pipeline con ponderación de probabilidad por etapa que calcula automáticamente el valor ponderado del pronóstico por negocio
- Hoja de Pronóstico Mensual que proyecta las reservas esperadas por mes según fechas de cierre y valores ponderados de los negocios
- Hoja de Análisis por Etapa que muestra cantidad de negocios, valor total, tamaño promedio y valor ponderado por etapa del pipeline
Vista previa
Mira qué contiene esta plantilla
Cómo usar esta plantilla de Pronóstico de Ventas
Define las líneas de productos
Lista cada producto, servicio o canal de ingresos como una fila separada con su volumen de ventas base y precio promedio.
Establece los supuestos de crecimiento
Ingresa tasas de crecimiento mes a mes o año a año para cada línea de producto. La plantilla las aplica a las cifras base.
Revisa las proyecciones
Las columnas mensuales muestran los ingresos proyectados creciendo a lo largo del período del pronóstico según tus supuestos de volumen y precio.
Compara con cifras reales
A medida que llegan las ventas reales, ingresa las cifras reales junto a las proyecciones. La columna de variación muestra dónde el rendimiento difiere del pronóstico.
Customer Reviews
What Our Customers Say
"If I get half as good at handling my finances as you are at customer service, this'll be the best $26 I've spent lately."
"Great tool! Simplifies financial planning without the hassle of complex spreadsheets."
"I recently purchased your super convenient spreadsheet, it really helps me!"
"They're great and super intuitive. Thank you!"
Creadas por Claude AI. Perfeccionadas por nosotros.
Usamos Claude AI para crear el borrador de cada plantilla, después de una investigación profunda. Luego nuestro equipo interviene. Refinamos el diseño, probamos cada fórmula a fondo, corregimos casos especiales y pulimos el diseño hasta que se siente como algo que realmente usaríamos nosotros mismos. La IA nos lleva al 80%. El último 20% es criterio humano.
Preguntas frecuentes
¿Puedo pronosticar por canal?
Sí. Usa cada fila para un canal de ventas diferente - en línea, retail, mayoreo o directo. La plantilla totaliza todos los canales.
¿Cómo establezco las tasas de crecimiento?
Ingresa un porcentaje de tasa de crecimiento por línea de producto. La plantilla aplica esta tasa a las ventas del mes anterior para generar la proyección de cada mes siguiente.
¿Maneja ajustes estacionales?
Puedes ajustar manualmente las proyecciones de meses individuales hacia arriba o hacia abajo para considerar patrones estacionales además de la tasa de crecimiento base.
¿Puedo comparar pronóstico con cifras reales?
Sí. Las columnas de comparación real vs. pronóstico con indicadores de variación muestran si las ventas reales están por encima o por debajo de la proyección.
¿Cómo abro esto en Google Sheets?
Sube el archivo .xlsx a Google Drive y luego ábrelo con Google Sheets. Todas las fórmulas y el formato se conservarán.
Más plantillas Essentials de Finanzas Empresariales
Destacados:
¿Buscas plantillas premium?
Nuestras plantillas de pago incluyen paneles avanzados con múltiples hojas, gráficos nativos de Excel y actualizaciones continuas.
Mejor obtenga todas las plantillas Ultimate
Las 58 plantillas Ultimate en una sola compra por $299 - valor de $1,102, usted se queda con $803.