Previsione di Vendita Modello Essentials
Proietta le vendite future per prodotto, servizio o canale. Crea previsioni di ricavi con ipotesi di crescita e aggiustamenti stagionali.
Cosa include
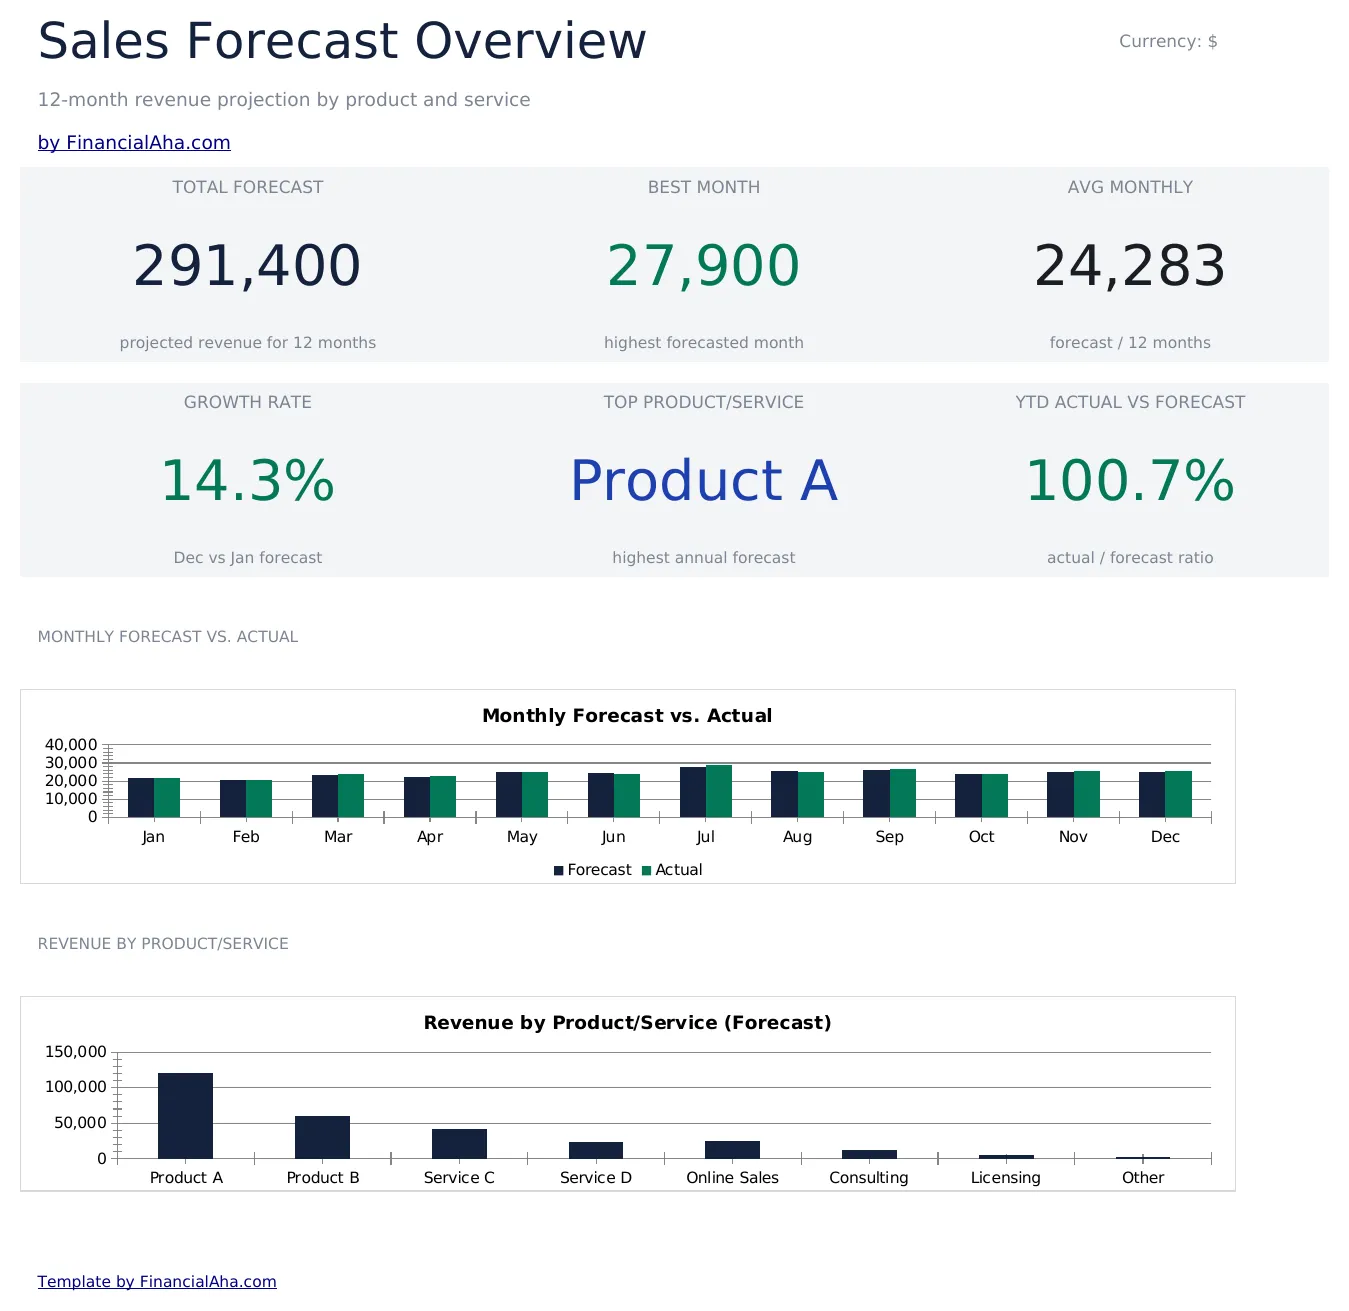
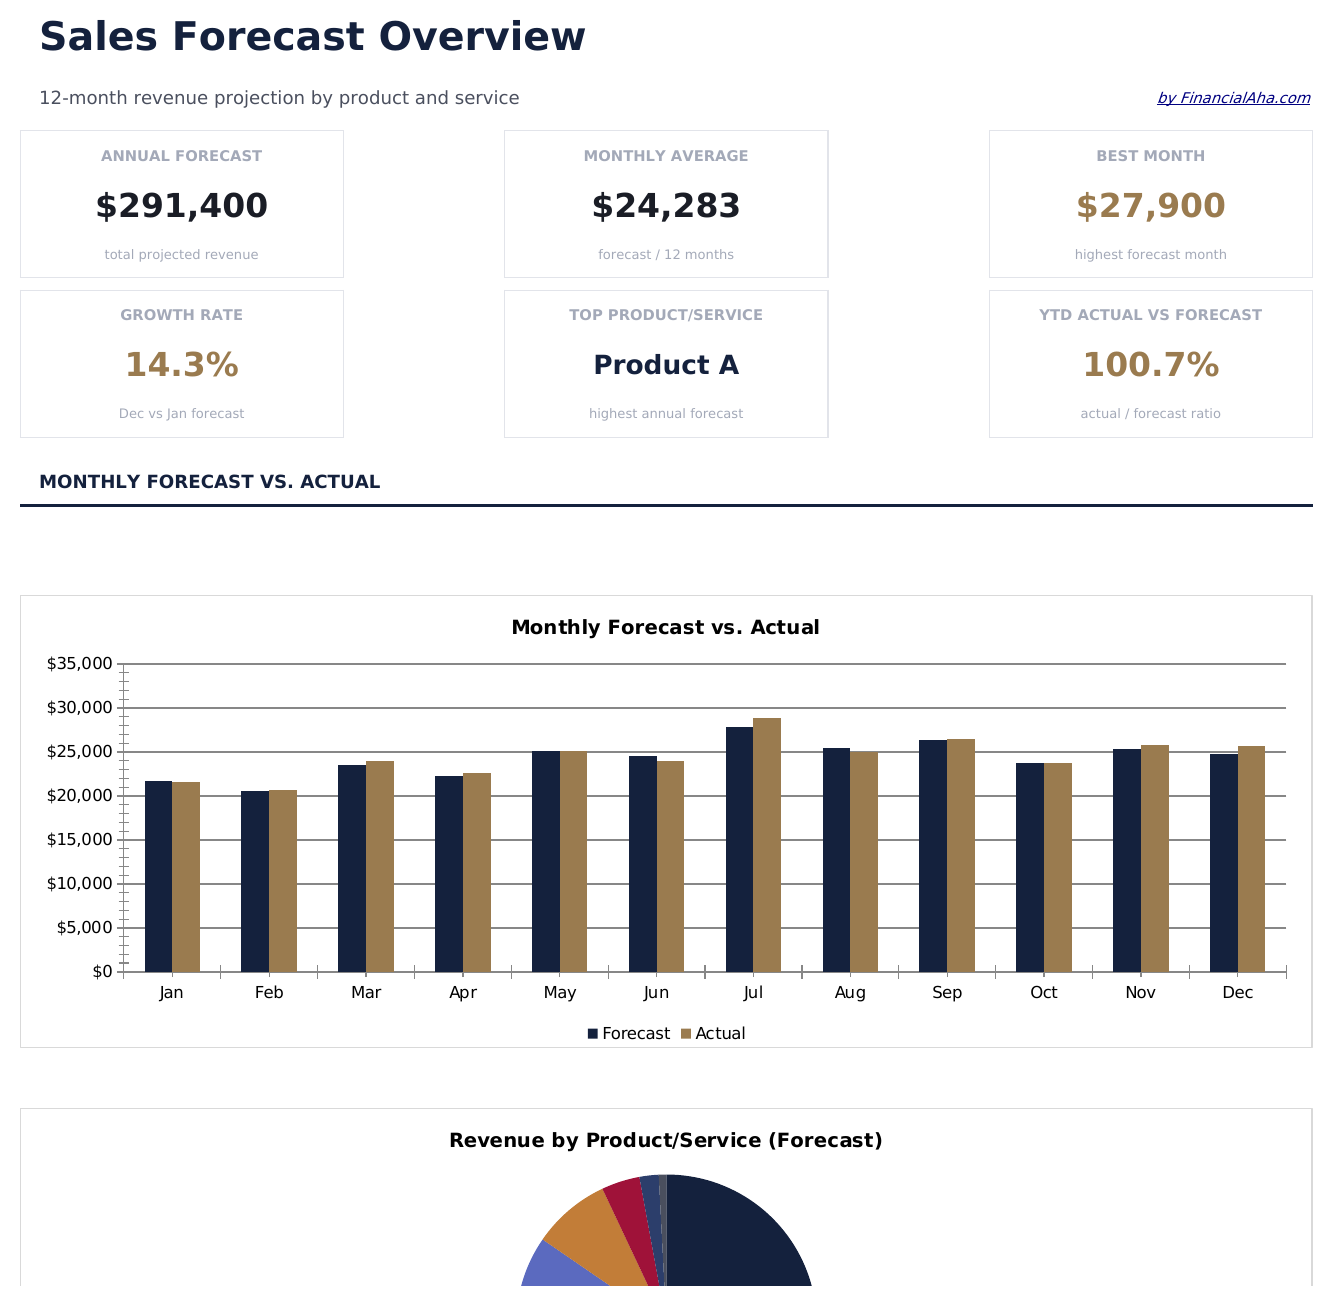
- Dashboard con riepilogo della previsione di vendita che mostra i ricavi totali proiettati, il tasso di crescita e le principali linee di prodotto
- Previsione di vendita per prodotto o canale con volume unitario, prezzo medio e ricavi totali per voce
- Ipotesi di tasso di crescita con input di aumento percentuale mensile o annuale regolabili
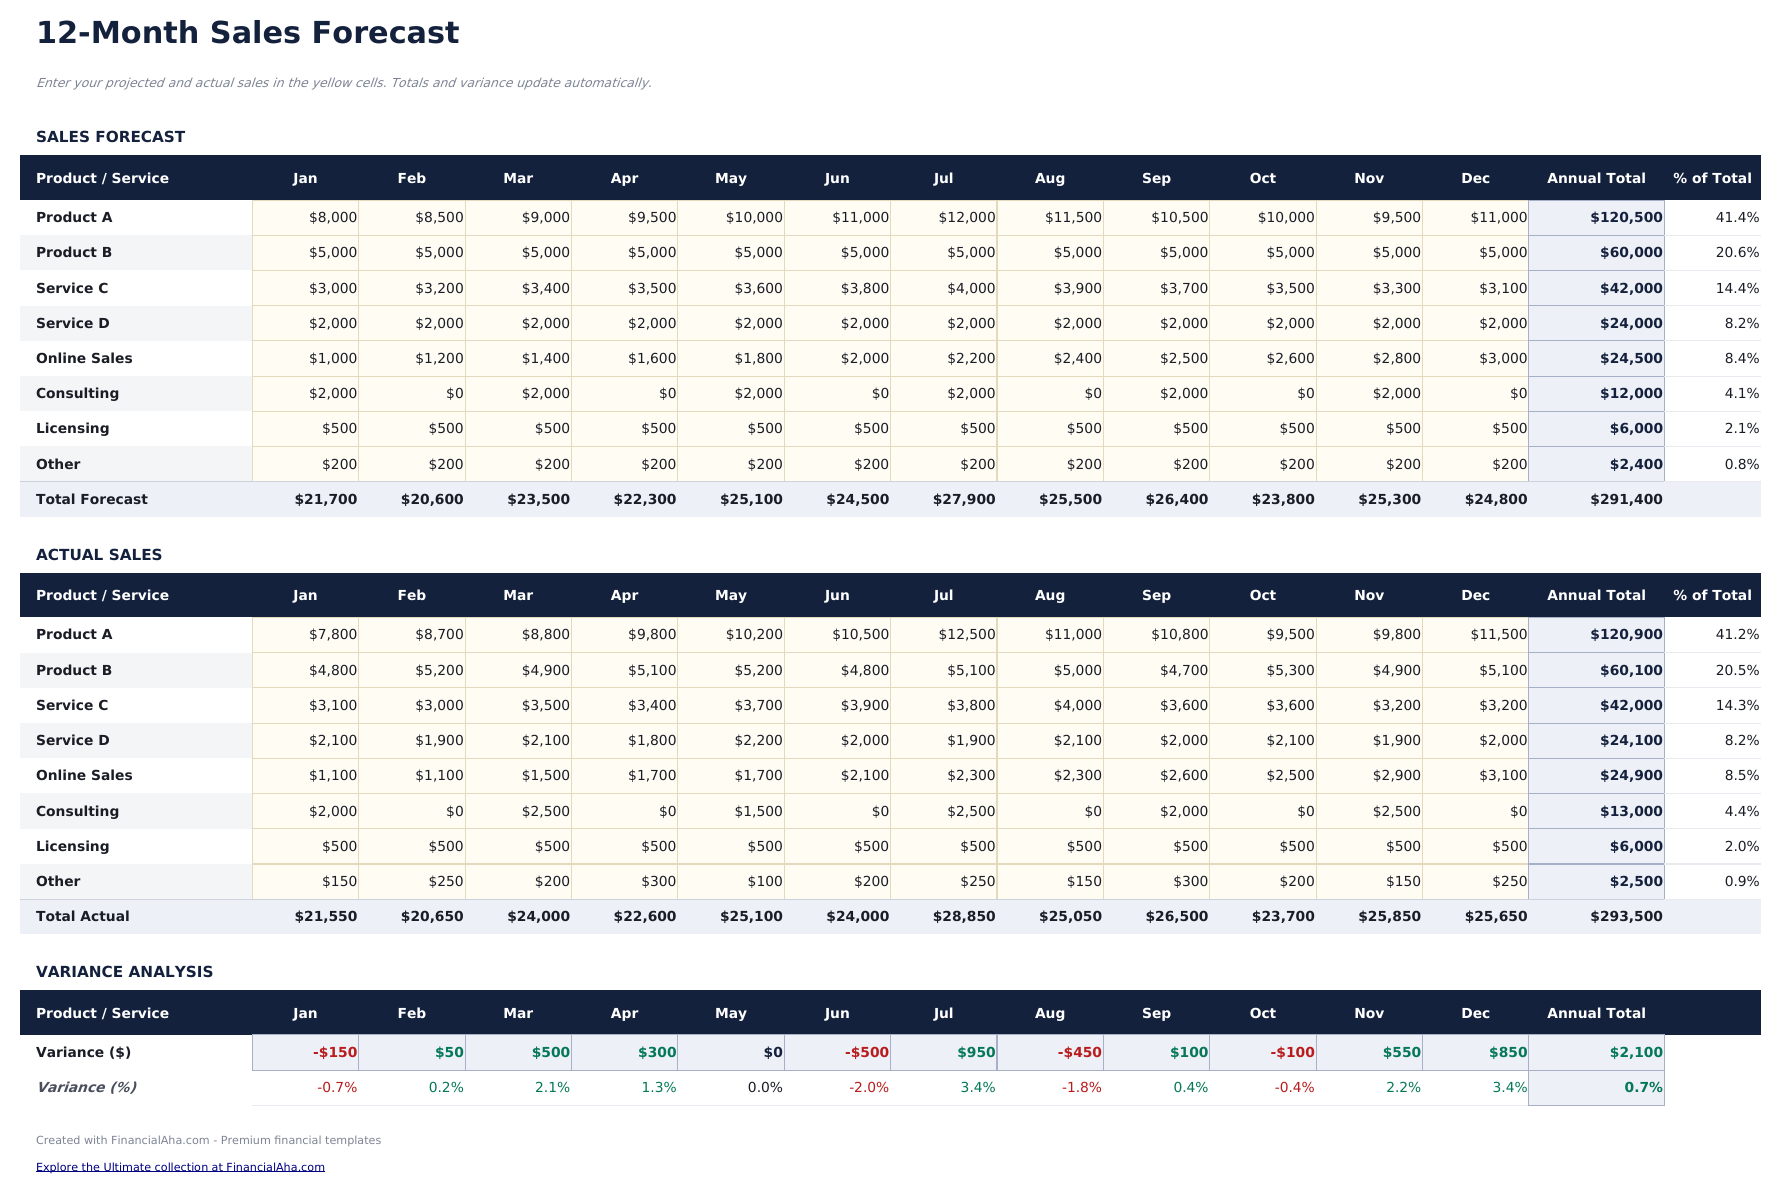
- Colonne di proiezione mensile e annuale che applicano i tassi di crescita ai valori di riferimento nel periodo di previsione
- Colonne di confronto tra dati effettivi e previsione con indicatori di scarto codificati per colore che evidenziano sovra o sotto performance
- Funziona in Microsoft Excel, Google Sheets e LibreOffice Calc senza configurazione richiesta
Need more from this template?
The Essentials version covers everyday tracking. Ultimate goes further with multi-entity support, scenario analysis, and ultimate-grade reporting.
- Dashboard con riepilogo della previsione di vendita che mostra i ricavi totali proiettati, il tasso di crescita e le principali linee di prodotto
- Previsione di vendita per prodotto o canale con volume unitario, prezzo medio e ricavi totali per voce
- Ipotesi di tasso di crescita con input di aumento percentuale mensile o annuale regolabili
- Colonne di proiezione mensile e annuale che applicano i tassi di crescita ai valori di riferimento nel periodo di previsione
- Monitora fino a 50 trattative attive con azienda, contatto, valore, fase, probabilita, data di chiusura prevista e responsabile
- Dashboard con 6 schede KPI: valore totale pipeline, pipeline ponderata, trattative in pipeline, valore medio trattativa, tasso di chiusura e previsione questo mese
- Foglio Pipeline con ponderazione probabilistica per fase che calcola automaticamente il valore di previsione ponderato per trattativa
- Foglio Previsione Mensile che proietta le prenotazioni attese per mese in base alle date di chiusura e ai valori ponderati
- Foglio Analisi per Fase che mostra conteggio trattative, valore totale, dimensione media e valore ponderato per fase della pipeline
Anteprima
Scopri cosa contiene questo modello
Come usare questo modello Previsione di Vendita
Definisci le linee di prodotto
Elenca ogni prodotto, servizio o canale di ricavo come riga separata con il suo volume di vendita base e il prezzo medio.
Imposta le ipotesi di crescita
Inserisci i tassi di crescita mensili o annuali per ogni linea di prodotto. Il modello li applica ai valori di riferimento.
Rivedi le proiezioni
Le colonne mensili mostrano i ricavi proiettati in crescita nel periodo di previsione in base alle ipotesi di volume e prezzo.
Confronta con i dati effettivi
Quando arrivano le vendite reali, inserisci i dati effettivi accanto alle proiezioni. La colonna di scarto mostra dove le performance differiscono dalla previsione.
Customer Reviews
What Our Customers Say
"If I get half as good at handling my finances as you are at customer service, this'll be the best $26 I've spent lately."
"Great tool! Simplifies financial planning without the hassle of complex spreadsheets."
"I recently purchased your super convenient spreadsheet, it really helps me!"
"They're great and super intuitive. Thank you!"
Creati da Claude AI. Perfezionati da noi.
Utilizziamo Claude AI per creare ogni modello, dopo una ricerca approfondita. Poi interviene il nostro team. Miglioriamo il layout, testiamo ogni formula, correggiamo i casi limite e rifiniamo il design fino a ottenere qualcosa che useremmo noi stessi. L'AI ci porta all'80%. L'ultimo 20% è tutto giudizio umano.
Domande frequenti
Posso fare previsioni per canale?
Sì. Usa ogni riga per un canale di vendita diverso - online, al dettaglio, all'ingrosso o diretto. Il modello totalizza su tutti i canali.
Come si impostano i tassi di crescita?
Inserisci un tasso di crescita percentuale per linea di prodotto. Il modello applica questo tasso alle vendite del mese precedente per generare la proiezione di ogni mese successivo.
Gestisce gli aggiustamenti stagionali?
Puoi modificare manualmente le proiezioni dei singoli mesi verso l'alto o verso il basso per tenere conto dei modelli stagionali in aggiunta al tasso di crescita base.
Posso confrontare la previsione con i dati effettivi?
Sì. Le colonne di confronto tra dati effettivi e previsione con indicatori di scarto mostrano se le vendite reali sono avanti o indietro rispetto alla proiezione.
Come posso aprirlo in Google Sheets?
Carica il file .xlsx su Google Drive, poi aprilo con Google Sheets. Tutte le formule e la formattazione saranno conservate.
Altri modelli Essentials Finanza Aziendale
Punti Chiave:
Cerchi modelli di fogli di calcolo premium?
I nostri modelli a pagamento includono dashboard multi-foglio avanzate, grafici nativi Excel e aggiornamenti continui.
Privato e sicuro
I tuoi dati finanziari restano sul tuo dispositivo. Non li vediamo mai.
Scopri di piu →Ottieni invece ogni modello Ultimate
Tutti i 58 modelli Ultimate in un unico acquisto per $299 - valore di $1,102, risparmi $803.