Proyección de Pérdidas y Ganancias Plantilla Essentials
Proyecta ingresos, costos y utilidades durante un período determinado. Útil para planificación de negocios, pronósticos y evaluación de escenarios financieros.
Qué incluye
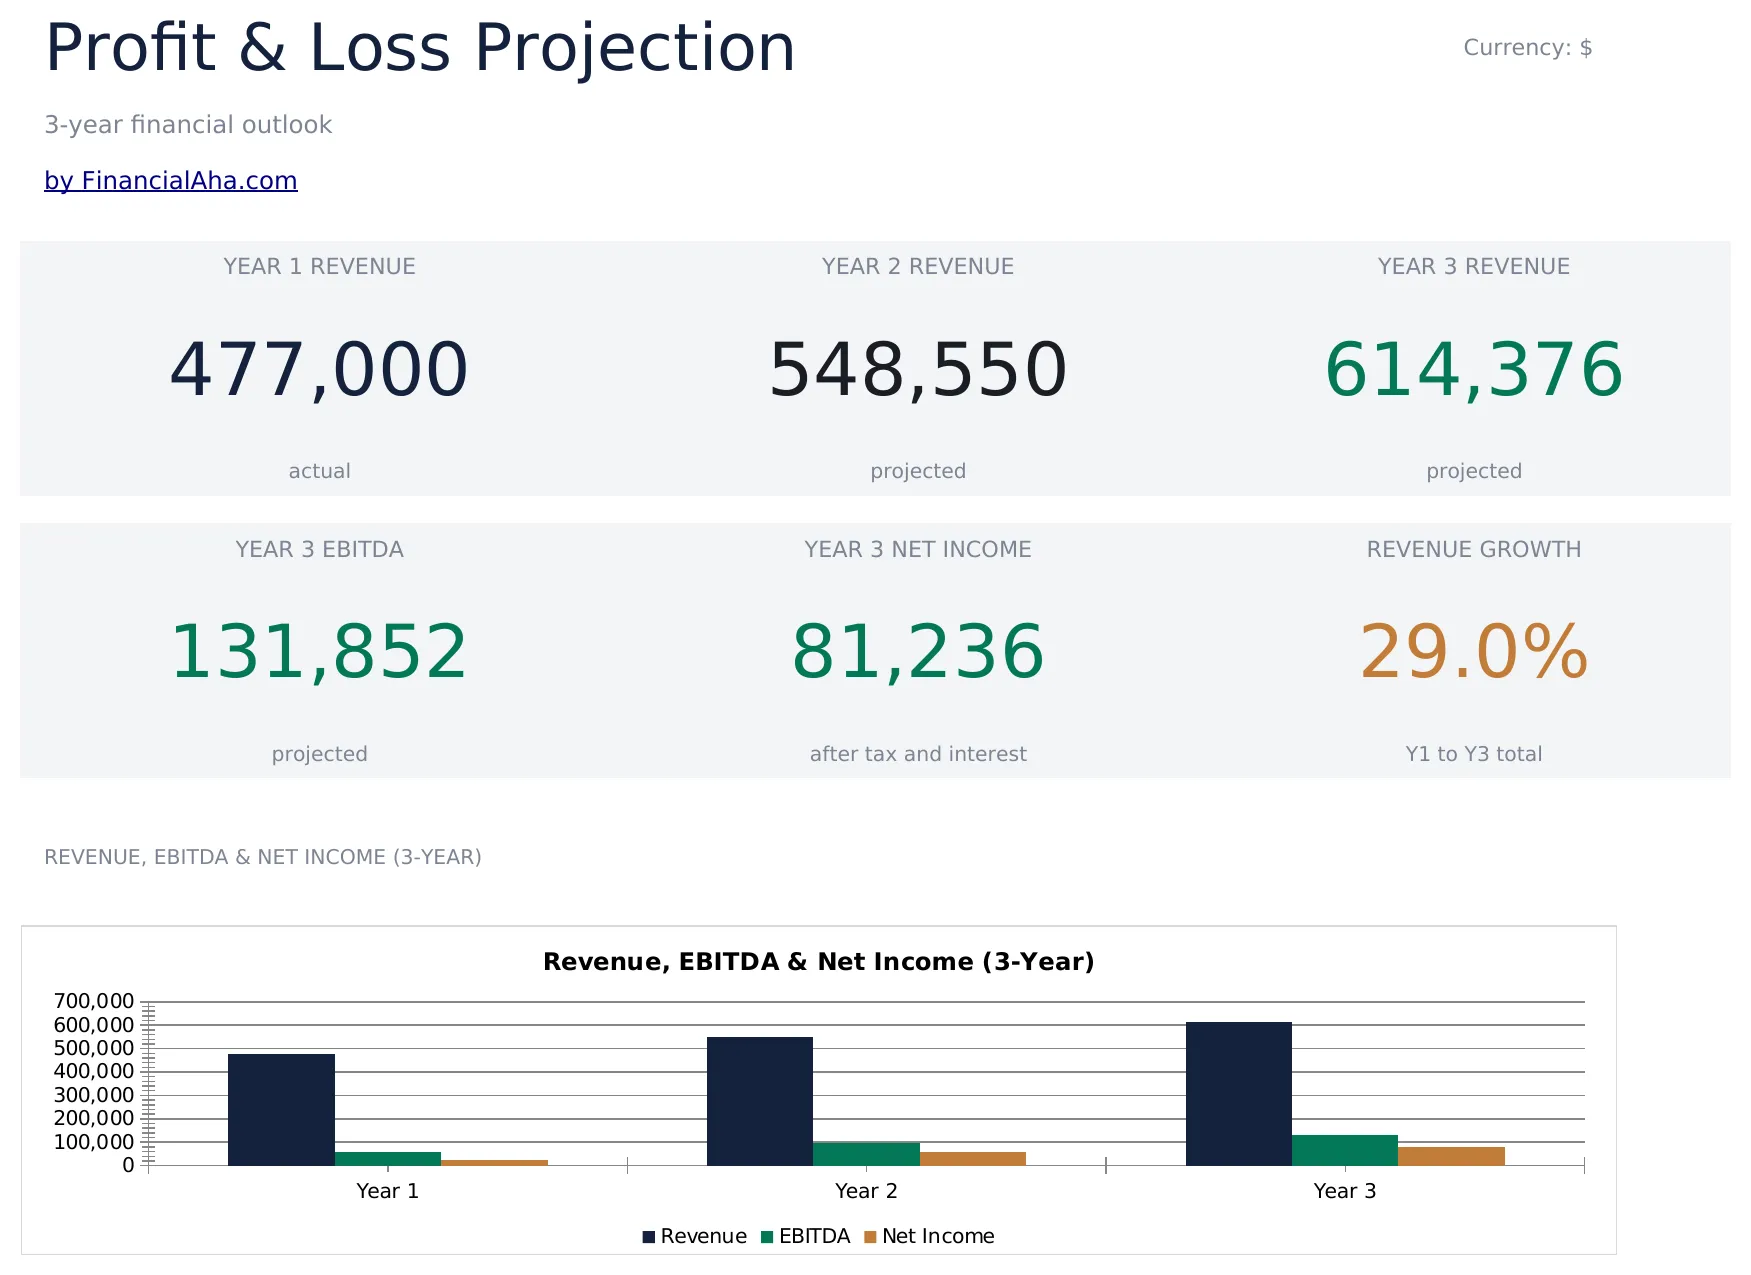
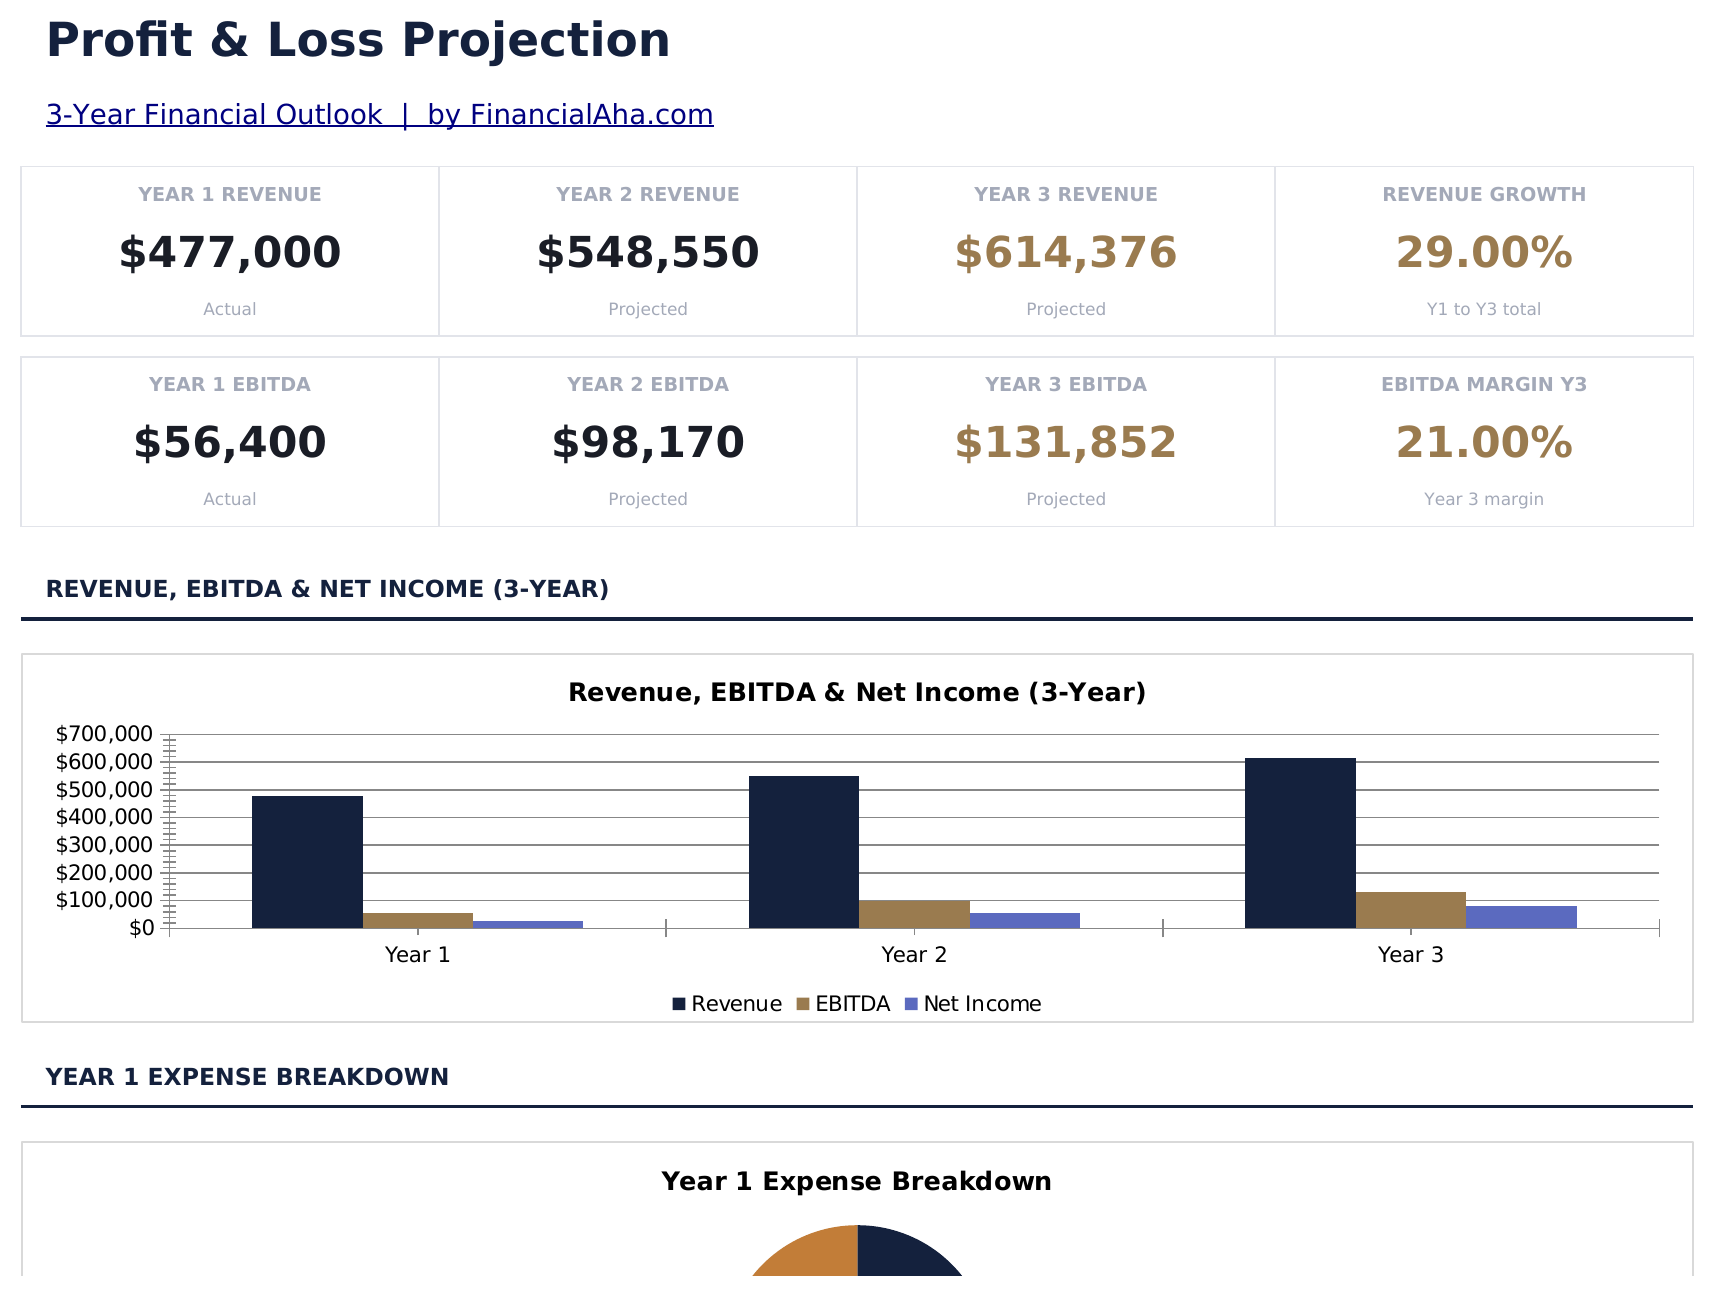
- Panel con resumen de P&G mostrando ingresos totales, costo de ventas, utilidad bruta y utilidad neta
- Estado de P&G con líneas de ingresos, costos directos, gastos operativos y utilidad neta con subtotales automáticos
- Cálculos de utilidad bruta y utilidad neta con porcentajes de margen automáticos mostrados junto a los montos en dólares
- Columnas de proyección mensual o trimestral abarcando hasta 12 meses con totales anuales automáticos al final
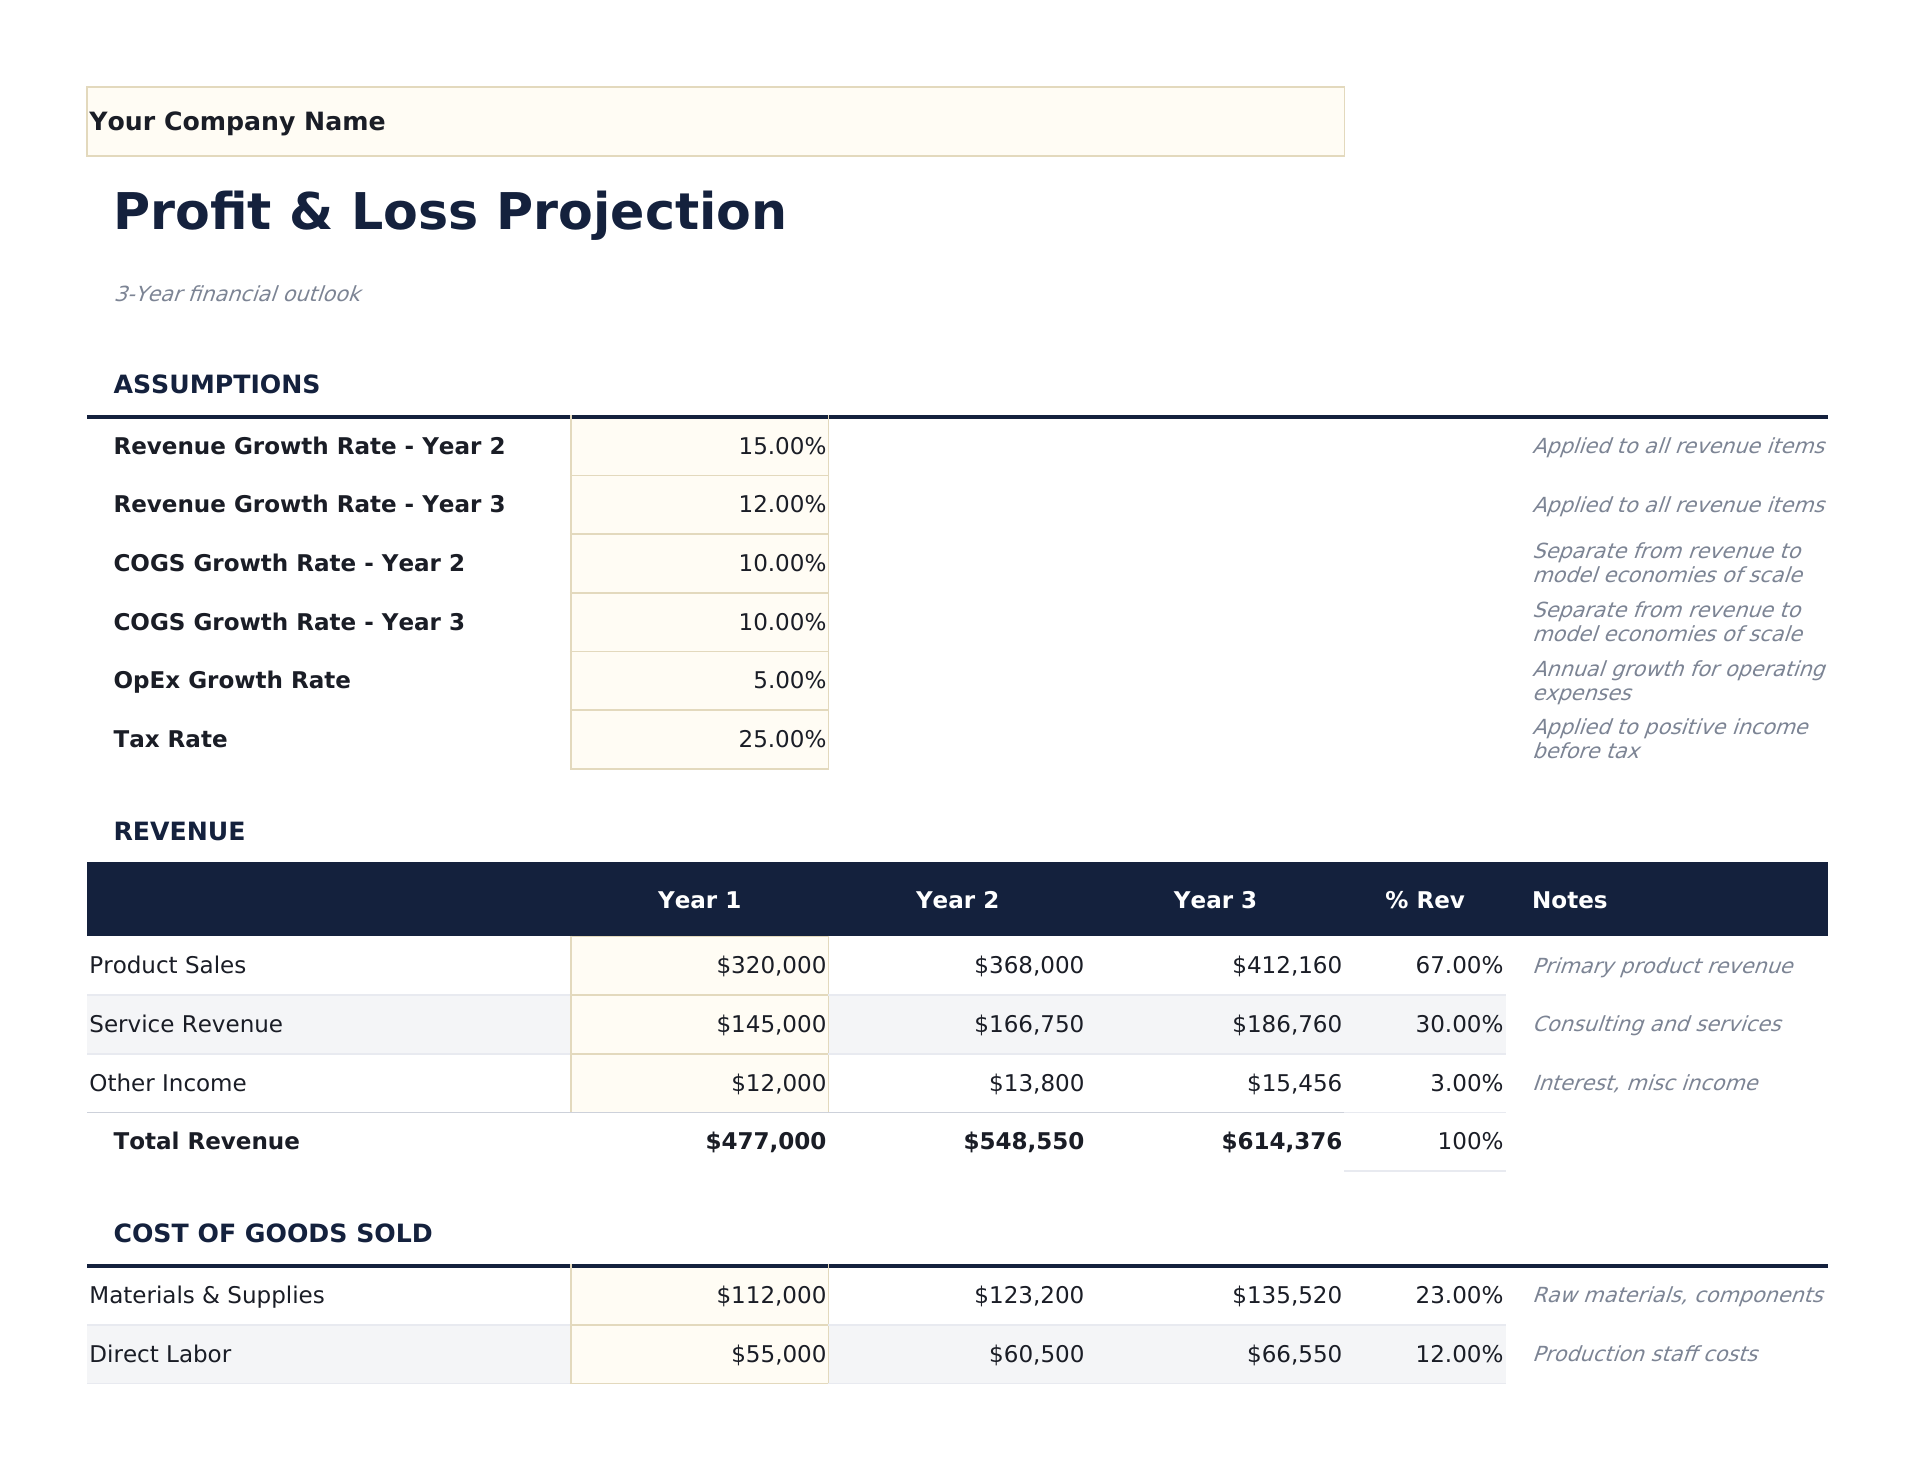
- Visualización de porcentaje de margen con celdas de entrada con código de color (amarillo) y proyecciones calculadas por fórmula (azul)
- Funciona en Microsoft Excel, Google Sheets y LibreOffice Calc sin configuración necesaria
Need more from this template?
The Essentials version covers everyday tracking. Ultimate goes further with multi-entity support, scenario analysis, and ultimate-grade reporting.
- Panel con resumen de P&G mostrando ingresos totales, costo de ventas, utilidad bruta y utilidad neta
- Estado de P&G con líneas de ingresos, costos directos, gastos operativos y utilidad neta con subtotales automáticos
- Cálculos de utilidad bruta y utilidad neta con porcentajes de margen automáticos mostrados junto a los montos en dólares
- Columnas de proyección mensual o trimestral abarcando hasta 12 meses con totales anuales automáticos al final
- Hoja de Pronóstico de Ingresos con hasta 10 líneas de productos o servicios, proyecciones mensuales y totales anuales con seguimiento de tasa de crecimiento
- Hoja de COGS que desglosa costos de materiales directos, mano de obra directa y gastos generales por línea de ingresos con cálculos de margen bruto
- Hoja de Gastos Operativos con 12 categorías de gastos en 12 columnas mensuales y seguimiento de presupuesto vs real anual
- Estado de P&L consolidado que extrae datos de todas las hojas de entrada: ingresos, COGS, utilidad bruta, gastos operativos, ingreso operativo e ingreso neto
- Panel con 6 tarjetas de KPI: ingresos anuales, COGS anual, % de margen bruto, ingreso operativo, ingreso neto y mes de punto de equilibrio
Vista previa
Mira qué contiene esta plantilla
Cómo usar esta plantilla de Proyección de Pérdidas y Ganancias
Ingresa las proyecciones de ingresos
Lista cada fuente de ingresos con montos proyectados mensuales o trimestrales a lo largo del período de proyección.
Agrega el costo de ventas
Ingresa los costos directos asociados con la entrega de tu producto o servicio. La utilidad bruta se calcula automáticamente.
Completa los gastos operativos
Agrega estimaciones mensuales para nómina, renta, marketing, servicios públicos, seguros y otros costos operativos.
Revisa la utilidad neta
El panel muestra ingresos proyectados, margen bruto, gastos operativos y utilidad neta con porcentajes de margen.
Customer Reviews
What Our Customers Say
"If I get half as good at handling my finances as you are at customer service, this'll be the best $26 I've spent lately."
"Great tool! Simplifies financial planning without the hassle of complex spreadsheets."
"I recently purchased your super convenient spreadsheet, it really helps me!"
"They're great and super intuitive. Thank you!"
Creadas por Claude AI. Perfeccionadas por nosotros.
Usamos Claude AI para crear el borrador de cada plantilla, después de una investigación profunda. Luego nuestro equipo interviene. Refinamos el diseño, probamos cada fórmula a fondo, corregimos casos especiales y pulimos el diseño hasta que se siente como algo que realmente usaríamos nosotros mismos. La IA nos lleva al 80%. El último 20% es criterio humano.
Preguntas frecuentes
¿Cuántos meses puedo proyectar?
La plantilla admite hasta 12 columnas mensuales con un total anual. Ajusta los encabezados de fecha para tu período de proyección.
¿Cuál es la diferencia entre utilidad bruta y utilidad neta?
La utilidad bruta es el ingreso menos los costos directos (costo de ventas). La utilidad neta resta todos los gastos operativos de la utilidad bruta. Ambas se muestran con porcentajes de margen.
¿Puedo usar trimestral en lugar de mensual?
Sí. Cambia los encabezados de columna de meses a trimestres e ingresa cifras trimestrales. El total anual sigue sumando todas las columnas.
¿Es útil para planificación de startups?
Sí. Las proyecciones de P&G son una parte fundamental de los planes de negocio. Combina esto con la plantilla de Costos de Inicio para una imagen financiera completa.
¿Cómo abro esto en Google Sheets?
Sube el archivo .xlsx a Google Drive y luego ábrelo con Google Sheets. Todas las fórmulas y el formato se conservarán.
Más plantillas Essentials de Finanzas Empresariales
Destacados:
¿Buscas plantillas premium?
Nuestras plantillas de pago incluyen paneles avanzados con múltiples hojas, gráficos nativos de Excel y actualizaciones continuas.
Mejor obtenga todas las plantillas Ultimate
Las 58 plantillas Ultimate en una sola compra por $299 - valor de $1,102, usted se queda con $803.