Projection du compte de résultat Modèle Essentials
Projetez les revenus, les coûts et le bénéfice sur une période donnée. Utile pour la planification d'entreprise, les prévisions et l'évaluation de scénarios financiers.
Ce qui est inclus
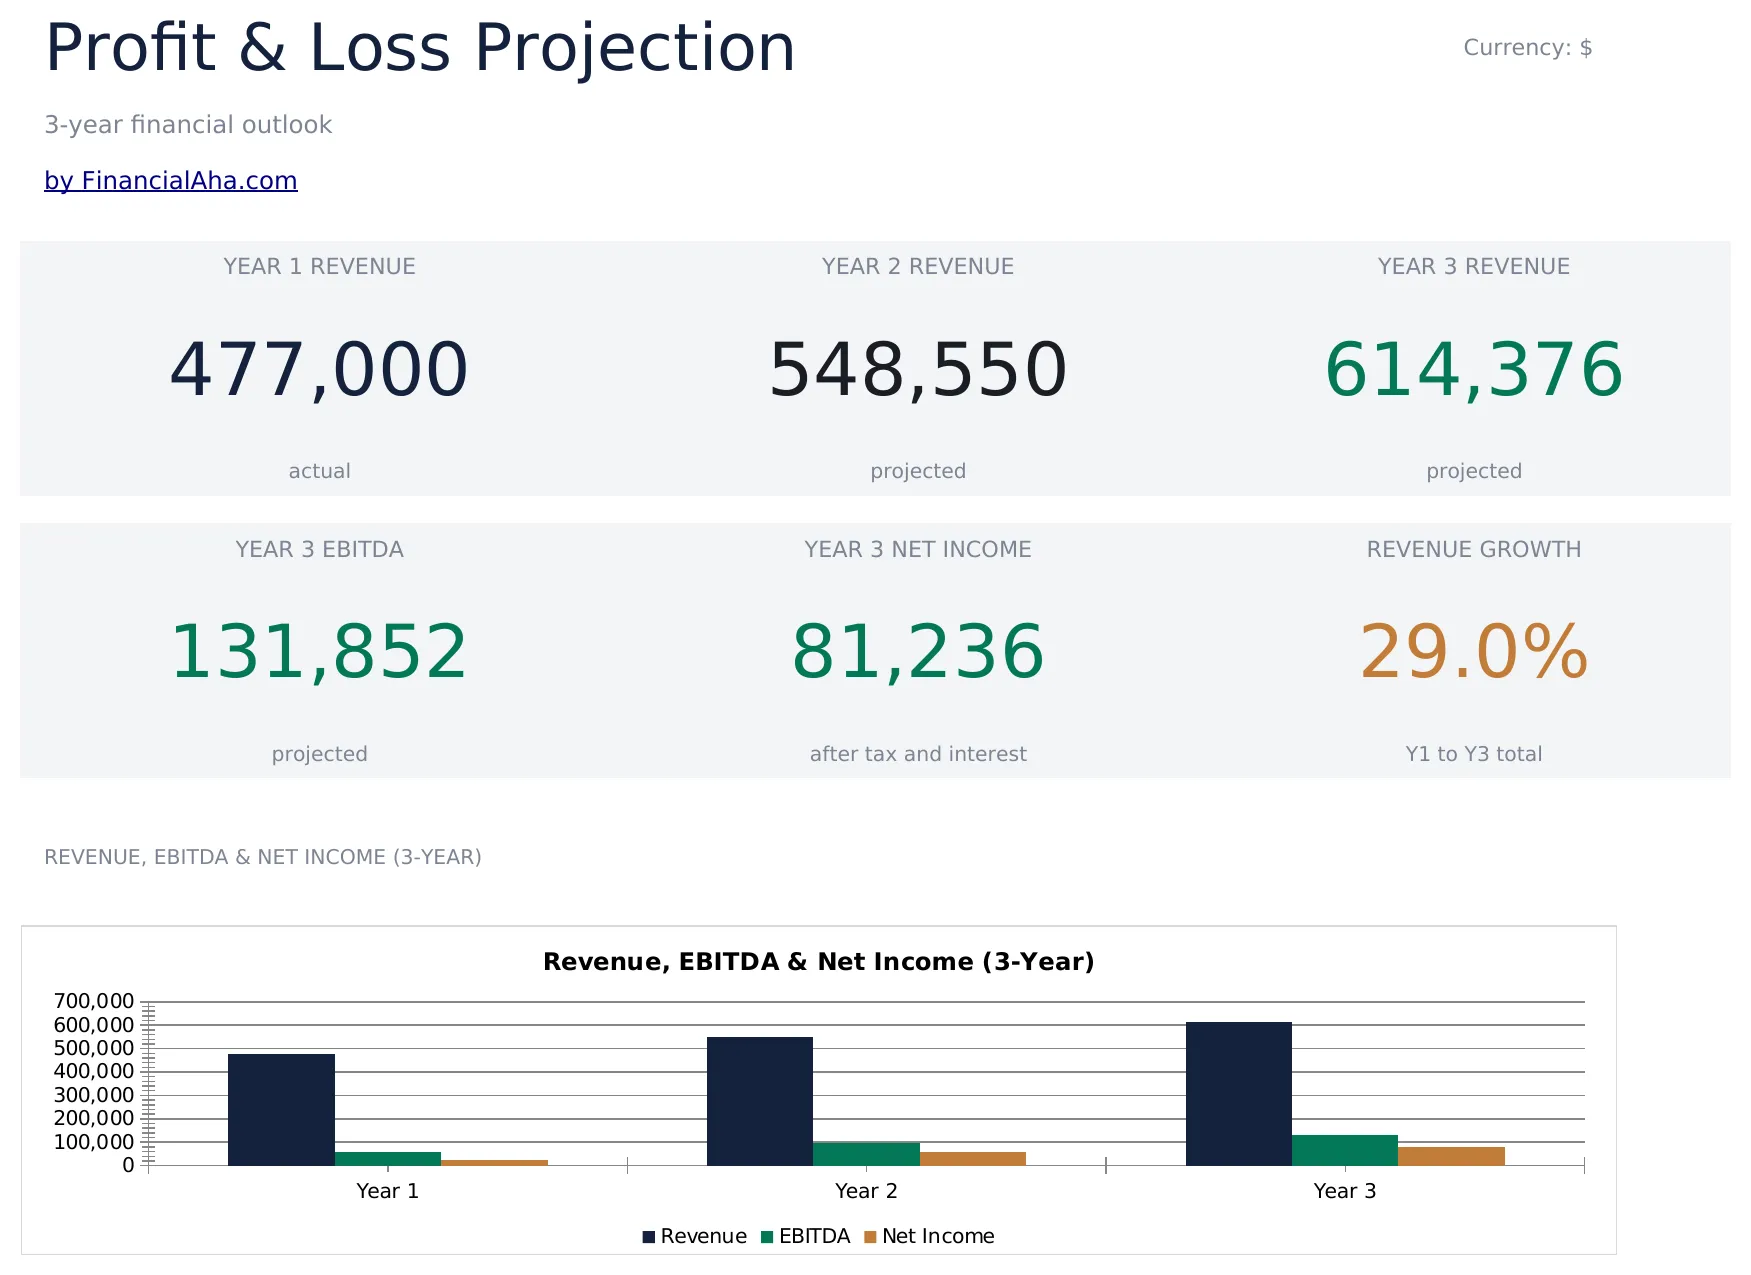
- Tableau de bord avec aperçu du compte de résultat affichant le chiffre d'affaires total, le coût des ventes, la marge brute et le bénéfice net
- Compte de résultat avec lignes de revenus, coûts directs, charges d'exploitation et résultat net avec sous-totaux automatiques
- Calculs de la marge brute et du bénéfice net avec pourcentages de marge automatiques affichés à côté des montants
- Colonnes de projection mensuelle ou trimestrielle sur jusqu'à 12 mois avec totaux annuels automatiques à la fin
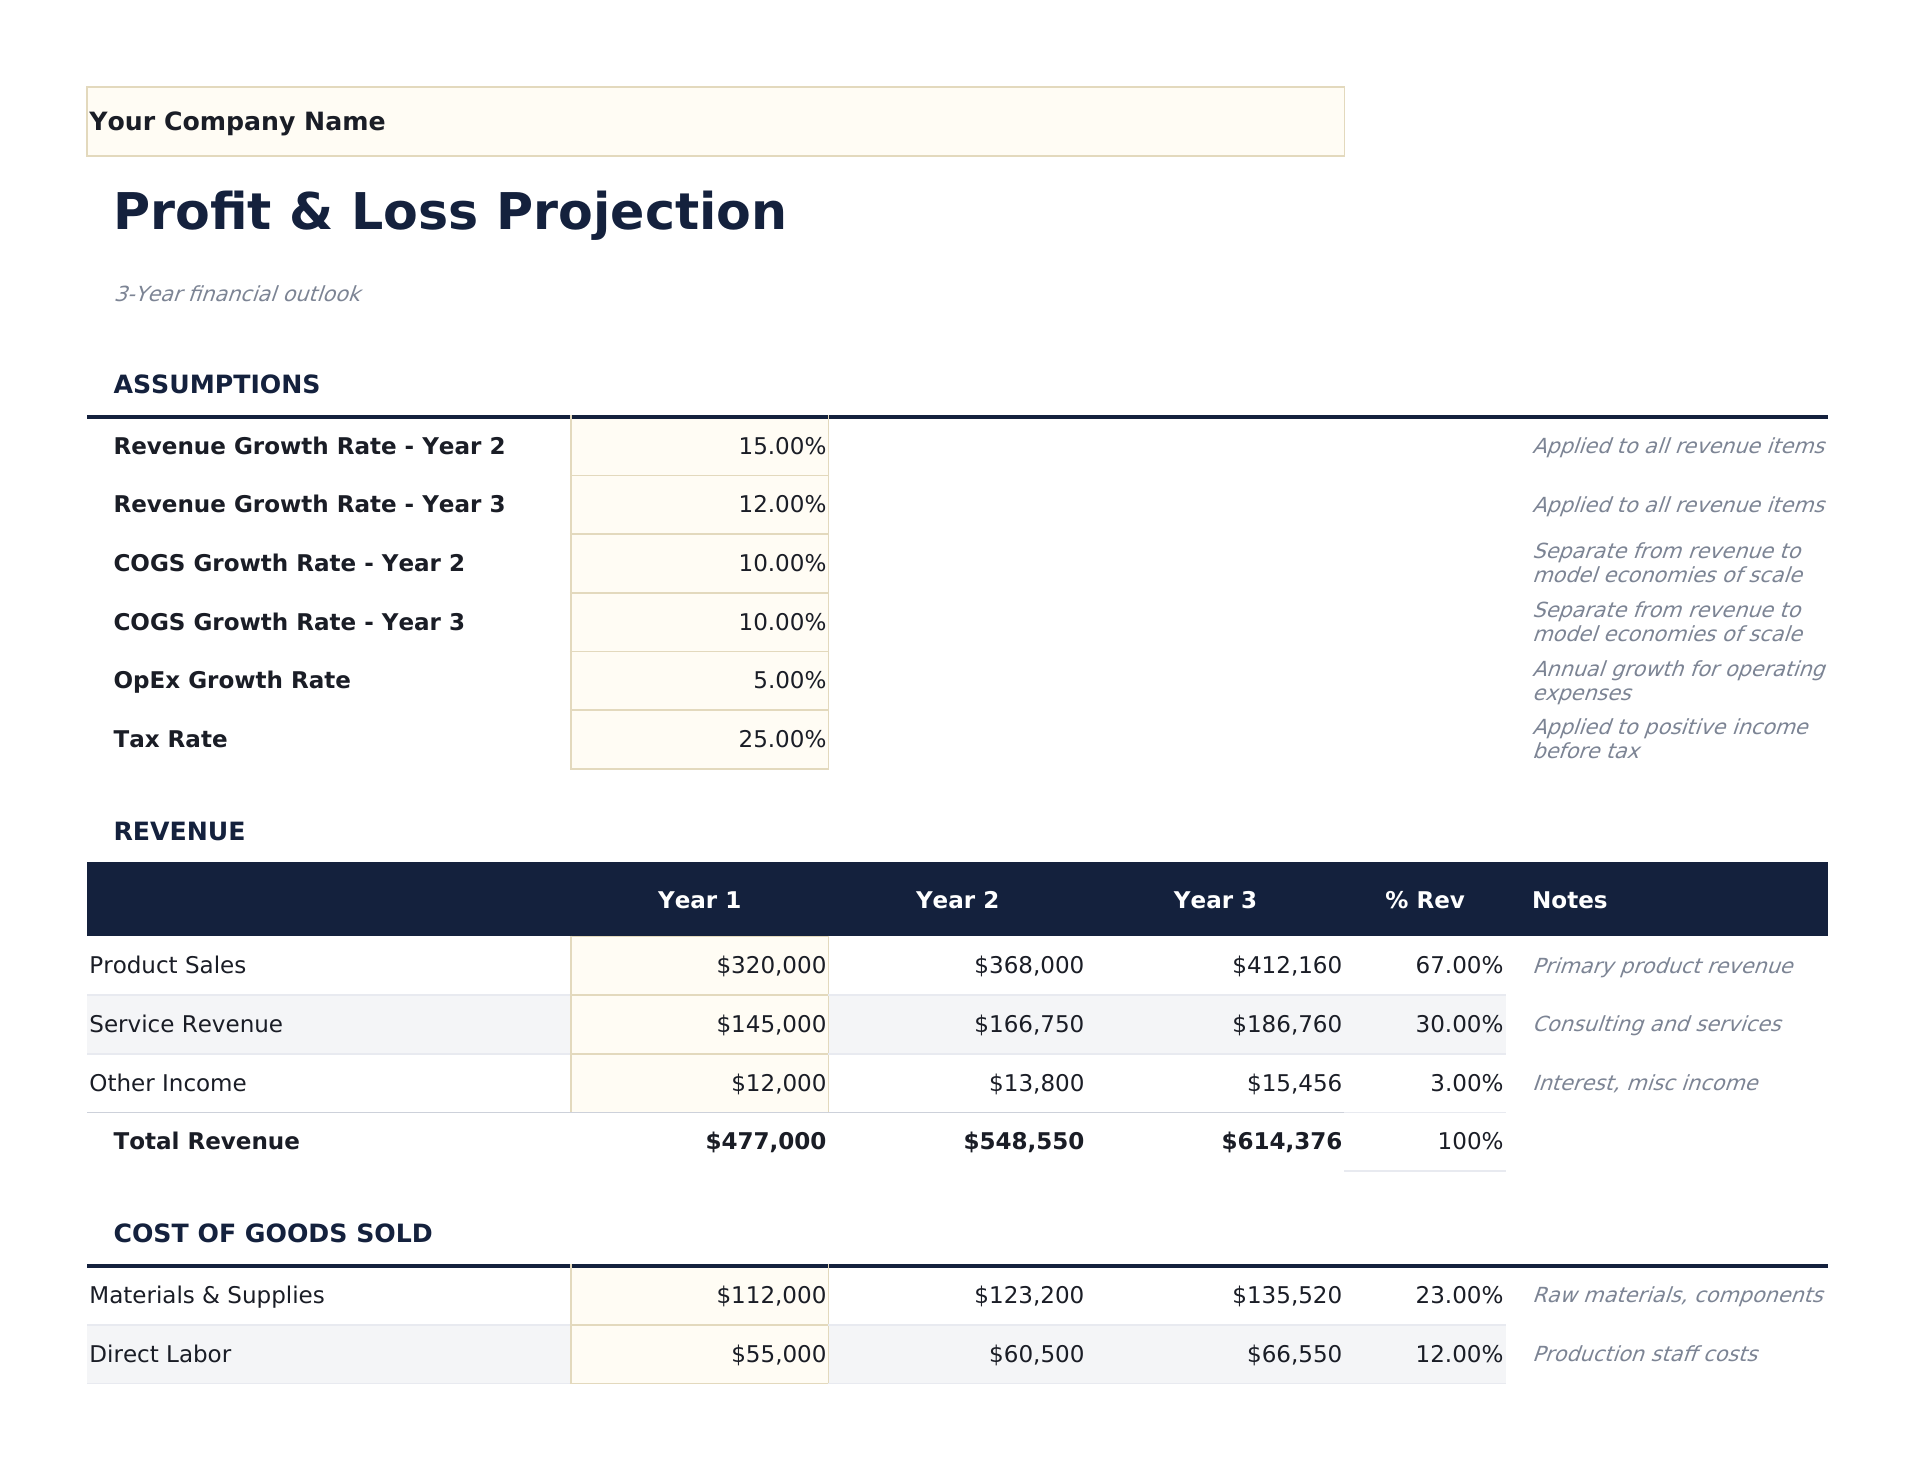
- Affichage des pourcentages de marge avec cellules de saisie colorées (jaune) et projections calculées par formules (bleu)
- Fonctionne dans Microsoft Excel, Google Sheets et LibreOffice Calc sans aucune configuration requise
Need more from this template?
The Essentials version covers everyday tracking. Ultimate goes further with multi-entity support, scenario analysis, and ultimate-grade reporting.
- Tableau de bord avec aperçu du compte de résultat affichant le chiffre d'affaires total, le coût des ventes, la marge brute et le bénéfice net
- Compte de résultat avec lignes de revenus, coûts directs, charges d'exploitation et résultat net avec sous-totaux automatiques
- Calculs de la marge brute et du bénéfice net avec pourcentages de marge automatiques affichés à côté des montants
- Colonnes de projection mensuelle ou trimestrielle sur jusqu'à 12 mois avec totaux annuels automatiques à la fin
- Feuille Prévisions de revenus avec jusqu'à 10 lignes de produits ou services, projections mensuelles et totaux annuels avec suivi du taux de croissance
- Feuille Coût des marchandises vendues détaillant les coûts de matières premières, de main-d'oeuvre directe et de frais généraux par ligne de revenus avec calculs de marge brute
- Feuille Charges d'exploitation avec 12 catégories de dépenses sur 12 colonnes mensuelles et suivi annuel budget vs réel
- État des résultats consolidé alimenté par toutes les feuilles d'entrée : revenus, coût des marchandises vendues, bénéfice brut, charges d'exploitation, résultat d'exploitation et résultat net
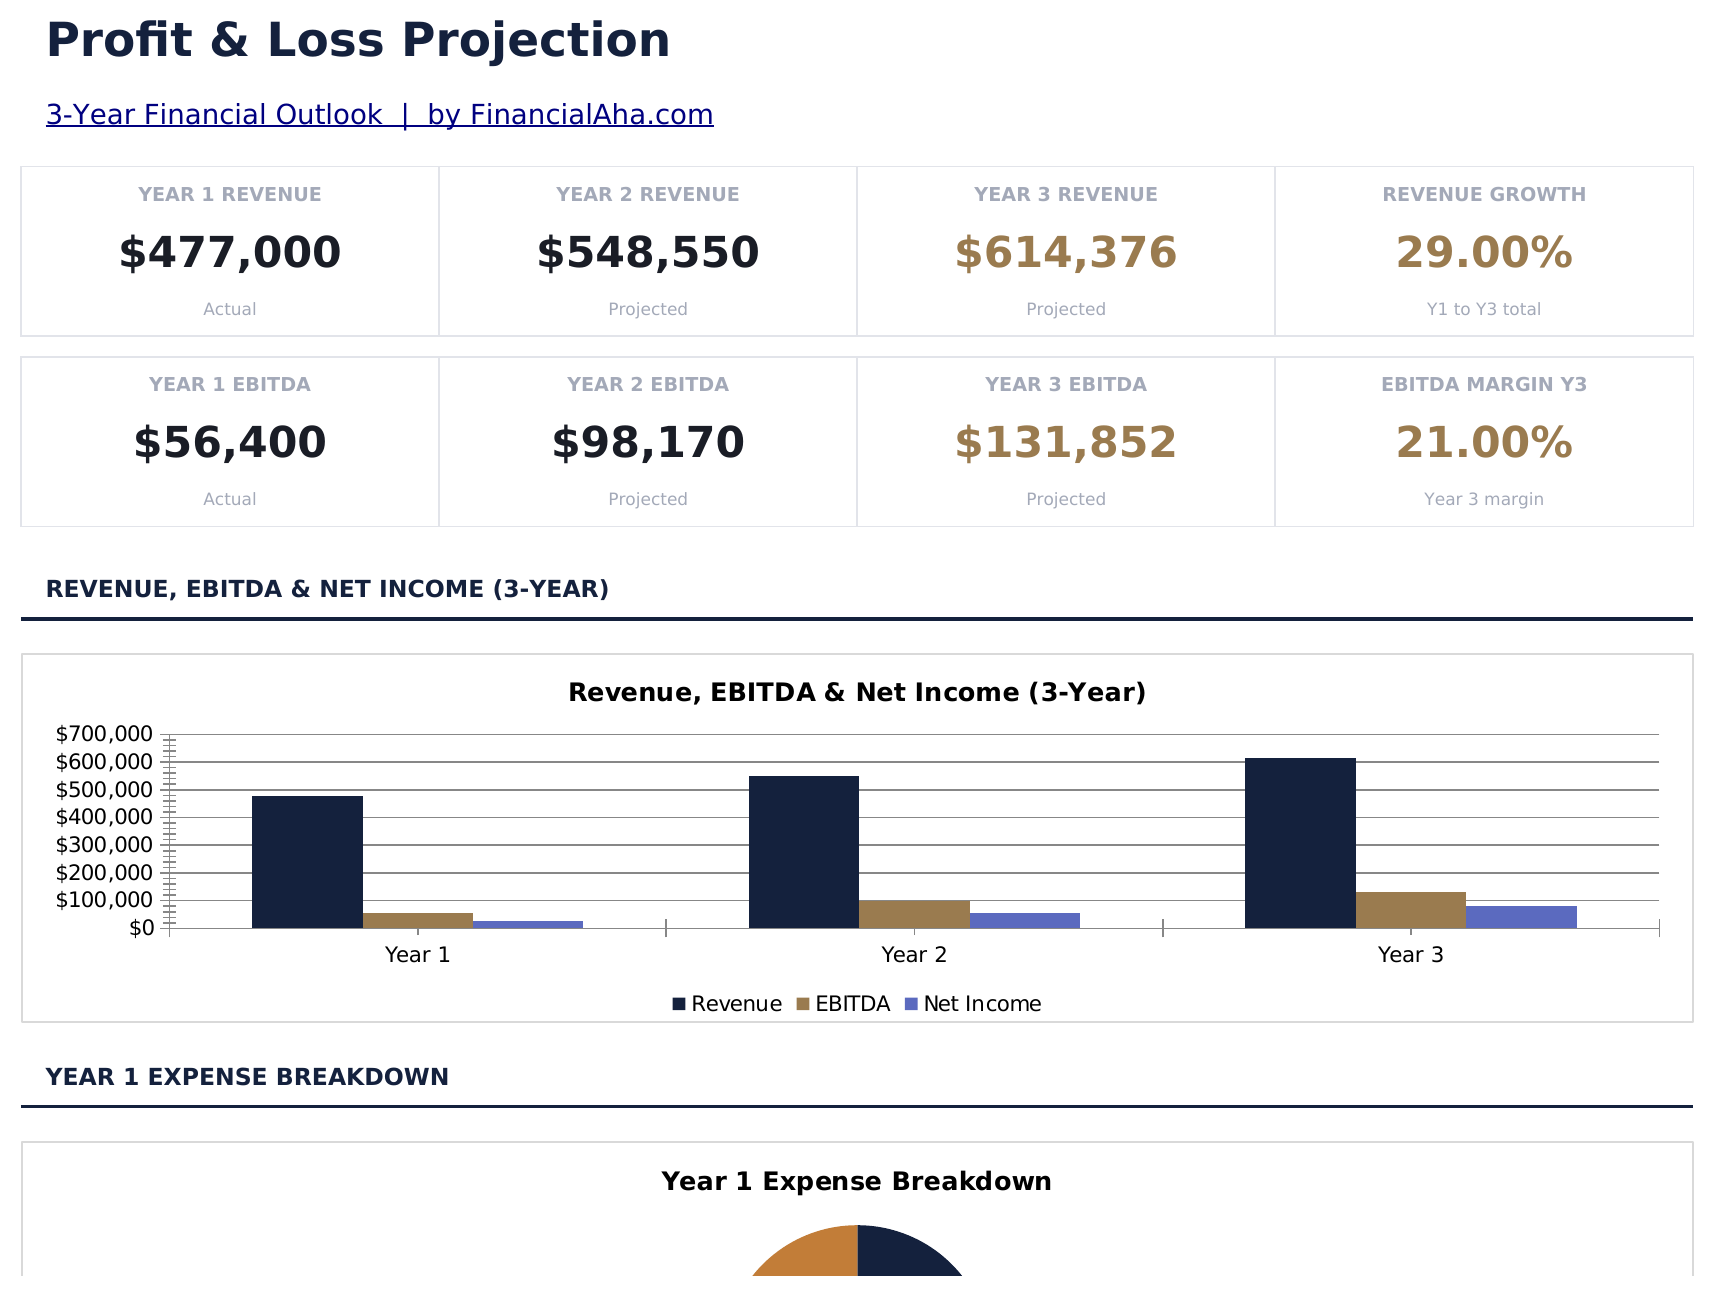
- Tableau de bord avec 6 indicateurs clés : revenus annuels, coût annuel des marchandises vendues, marge brute en %, résultat d'exploitation, résultat net et mois de rentabilité
Aperçu
Découvrez le contenu de ce modèle
Comment utiliser ce modèle Projection du compte de résultat
Saisissez les projections de revenus
Listez chaque source de revenus avec les montants mensuels ou trimestriels projetés sur la période de projection.
Ajoutez le coût des ventes
Saisissez les coûts directs associés à la livraison de votre produit ou service. La marge brute se calcule automatiquement.
Remplissez les charges d'exploitation
Ajoutez les estimations mensuelles pour la masse salariale, le loyer, le marketing, les services publics, les assurances et autres charges d'exploitation.
Vérifiez le bénéfice net
Le tableau de bord affiche le chiffre d'affaires projeté, la marge brute, les charges d'exploitation et le bénéfice net avec les pourcentages de marge.
Customer Reviews
What Our Customers Say
"If I get half as good at handling my finances as you are at customer service, this'll be the best $26 I've spent lately."
"Great tool! Simplifies financial planning without the hassle of complex spreadsheets."
"I recently purchased your super convenient spreadsheet, it really helps me!"
"They're great and super intuitive. Thank you!"
Créés par Claude AI. Perfectionnés par nos soins.
Nous utilisons Claude AI pour rédiger chaque modèle, après une recherche approfondie. Puis notre équipe prend le relais. Nous affinons la mise en page, testons chaque formule en conditions réelles, corrigeons les cas limites et peaufinons le design jusqu'à obtenir un résultat que nous utiliserions nous-mêmes. L'IA nous amène à 80 %. Les 20 % restants, c'est du jugement humain.
Questions fréquentes
Sur combien de mois puis-je projeter ?
Le modèle prend en charge jusqu'à 12 colonnes mensuelles avec un total annuel. Ajustez les en-têtes de dates pour votre période de projection.
Quelle différence entre marge brute et bénéfice net ?
La marge brute est le chiffre d'affaires moins les coûts directs (coût des ventes). Le bénéfice net soustrait toutes les charges d'exploitation de la marge brute. Les deux sont affichés avec des pourcentages de marge.
Puis-je utiliser des trimestres au lieu des mois ?
Oui. Changez les en-têtes de colonnes de mois en trimestres et saisissez les chiffres trimestriels. Le total annuel additionne toujours toutes les colonnes.
Est-ce adapté à la planification d'une startup ?
Oui. Les projections de compte de résultat sont un élément essentiel des business plans. Combinez ce modèle avec le modèle Coûts de démarrage pour une vision financière complète.
Comment ouvrir ce fichier dans Google Sheets ?
Importez le fichier .xlsx dans Google Drive, puis ouvrez-le avec Google Sheets. Toutes les formules et la mise en forme seront conservées.
Plus de modèles Essentials Finance d'entreprise
Points Clés :
Vous recherchez des modèles de tableurs premium ?
Nos modèles payants incluent des tableaux de bord multi-feuilles avancés, des graphiques Excel natifs et des mises à jour régulières.
Privé et sécurisé
Vos données financières restent sur votre appareil. Nous ne les voyons jamais.
En savoir plus →Obtenez plutôt tous les modèles Ultimate
Les 58 modèles Ultimate en un seul achat pour $299 - valeur de $1,102, vous économisez $803.