Gewinn- und Verlustprognose Essentials-Vorlage
Prognostizieren Sie Umsatz, Kosten und Gewinn ueber einen bestimmten Zeitraum. Nuetzlich fuer Geschaeftsplanung, Prognosen und die Bewertung finanzieller Szenarien.
Was enthalten ist
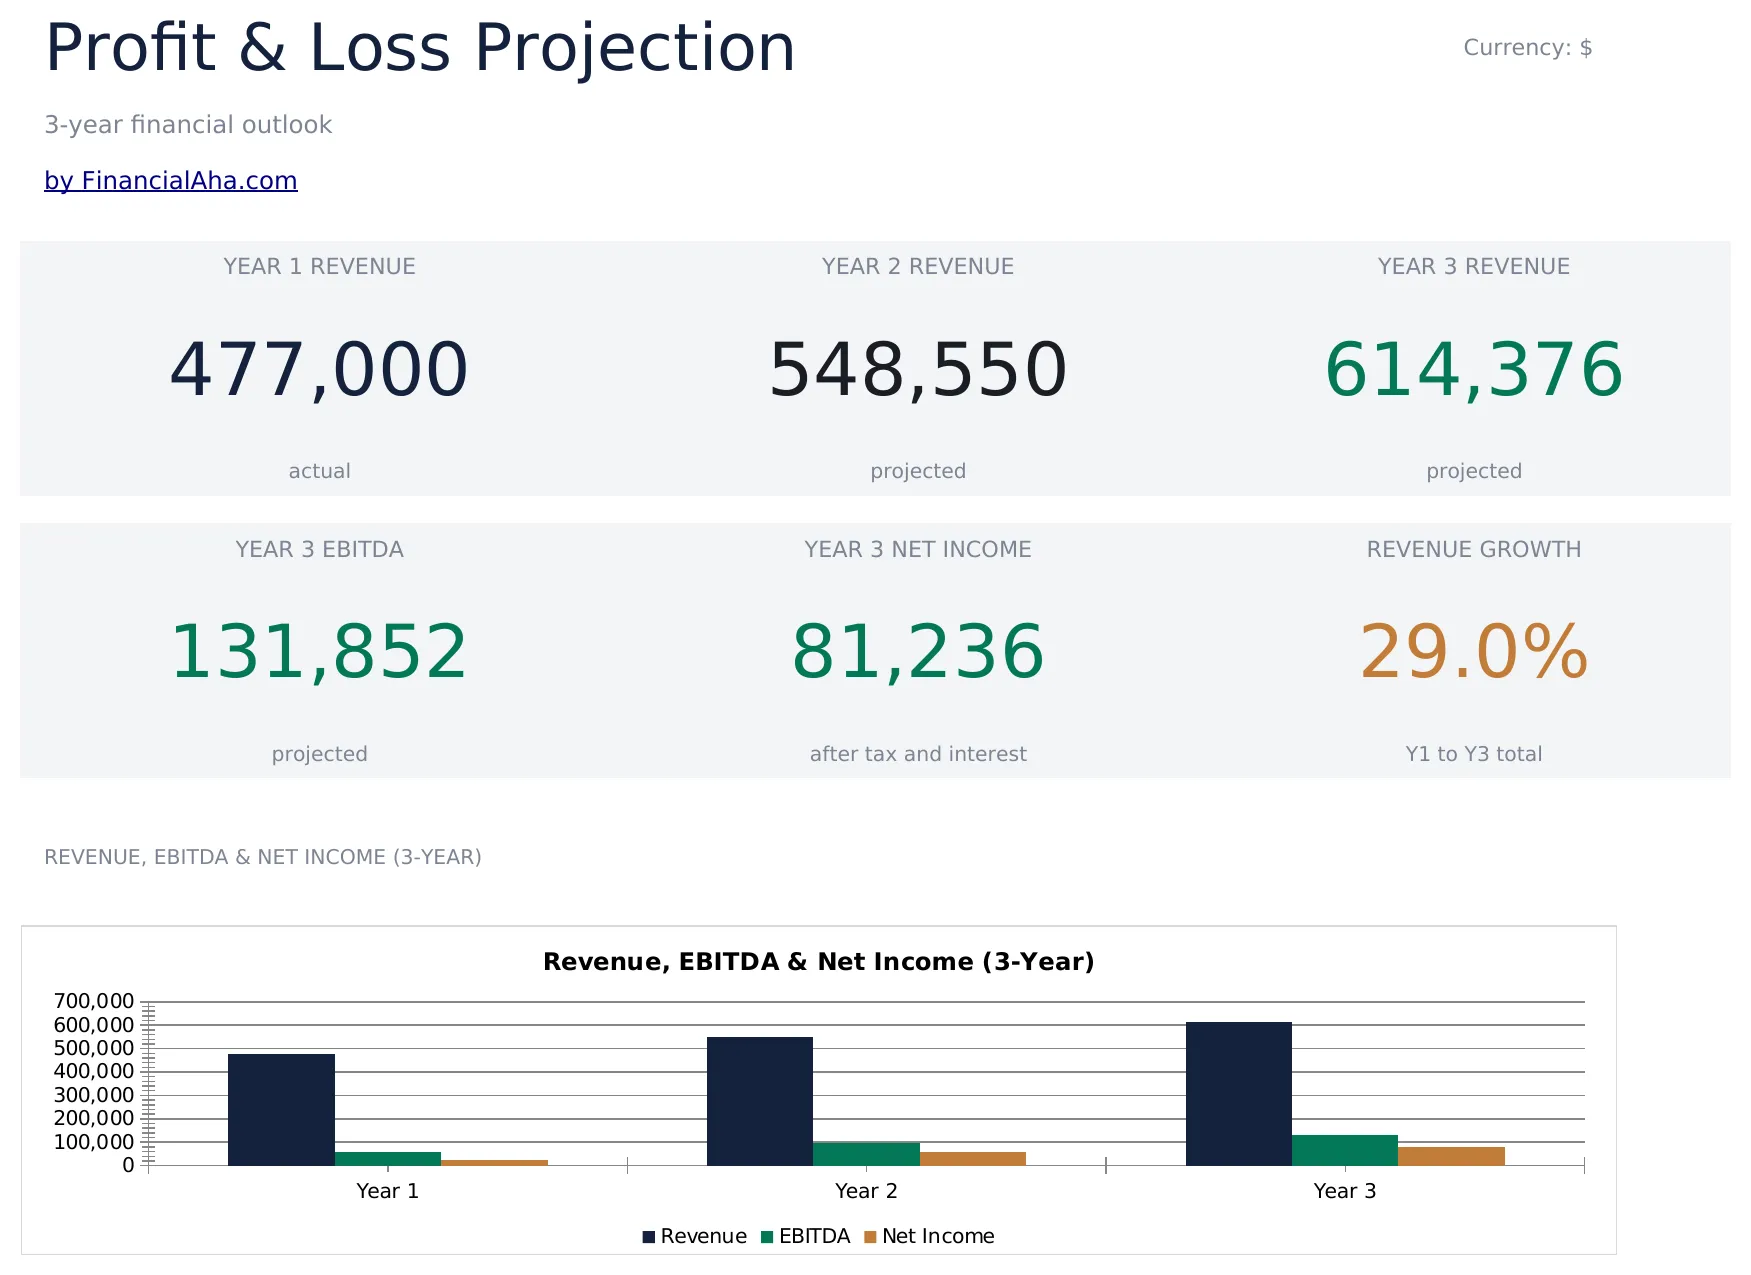
- Dashboard mit GuV-Uebersicht, das Gesamtumsatz, Herstellungskosten, Bruttogewinn und Nettogewinn anzeigt
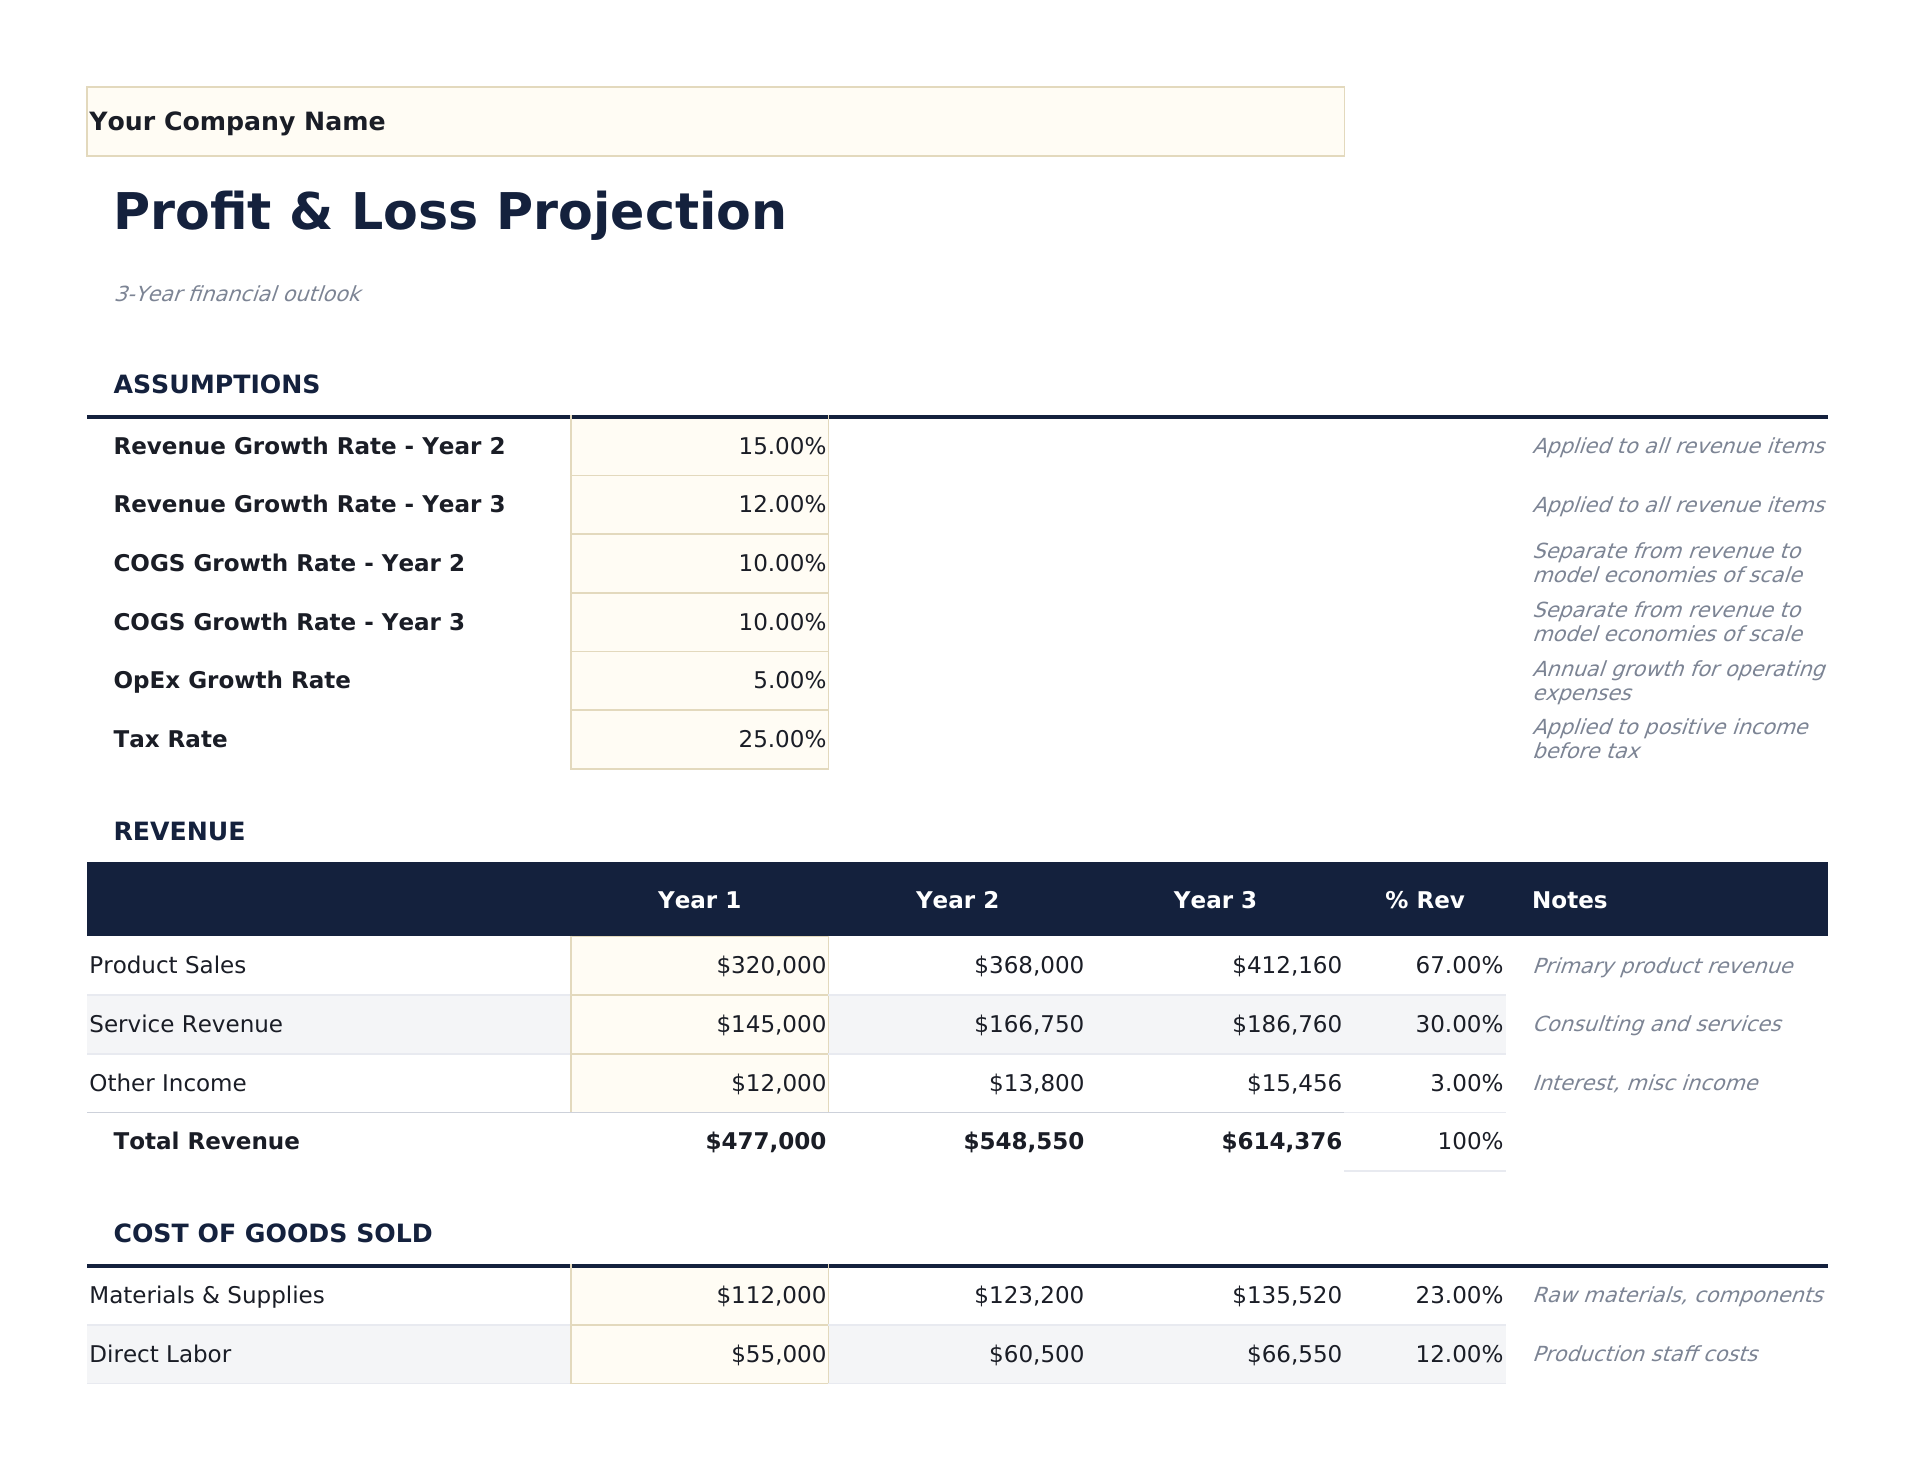
- GuV-Rechnung mit Umsatzpositionen, direkten Kosten, Betriebsausgaben und Nettogewinn mit automatischen Zwischensummen
- Brutto- und Nettogewinnberechnungen mit automatischen Margenprozentsaetzen neben den Eurobetraegen
- Monatliche oder quartalsweise Prognosespalten ueber bis zu 12 Monate mit automatischen Jahressummen am Ende
- Margenprozentzanzeige mit farbcodierten Eingabefeldern (gelb) und formelgesteuerten Prognosen (blau)
- Funktioniert in Microsoft Excel, Google Sheets und LibreOffice Calc ohne Einrichtung
Need more from this template?
The Essentials version covers everyday tracking. Ultimate goes further with multi-entity support, scenario analysis, and ultimate-grade reporting.
- Dashboard mit GuV-Uebersicht, das Gesamtumsatz, Herstellungskosten, Bruttogewinn und Nettogewinn anzeigt
- GuV-Rechnung mit Umsatzpositionen, direkten Kosten, Betriebsausgaben und Nettogewinn mit automatischen Zwischensummen
- Brutto- und Nettogewinnberechnungen mit automatischen Margenprozentsaetzen neben den Eurobetraegen
- Monatliche oder quartalsweise Prognosespalten ueber bis zu 12 Monate mit automatischen Jahressummen am Ende
- Umsatzprognoseblatt mit bis zu 10 Produkt- oder Dienstleistungslinien, monatlichen Prognosen und Jahressummen mit Wachstumsratenverfolgung
- Herstellungskostenblatt mit Aufschlüsselung der direkten Material-, Personal- und Gemeinkosten pro Umsatzlinie mit Bruttomargenberechnung
- Betriebsausgabenblatt mit 12 Ausgabenkategorien über 12 Monatsspalten und jährlicher Budget-vs-Ist-Verfolgung
- Konsolidierte GuV-Rechnung zieht aus allen Eingabeblättern: Umsatz, Herstellungskosten, Bruttogewinn, Betriebsausgaben, Betriebsergebnis und Nettoergebnis
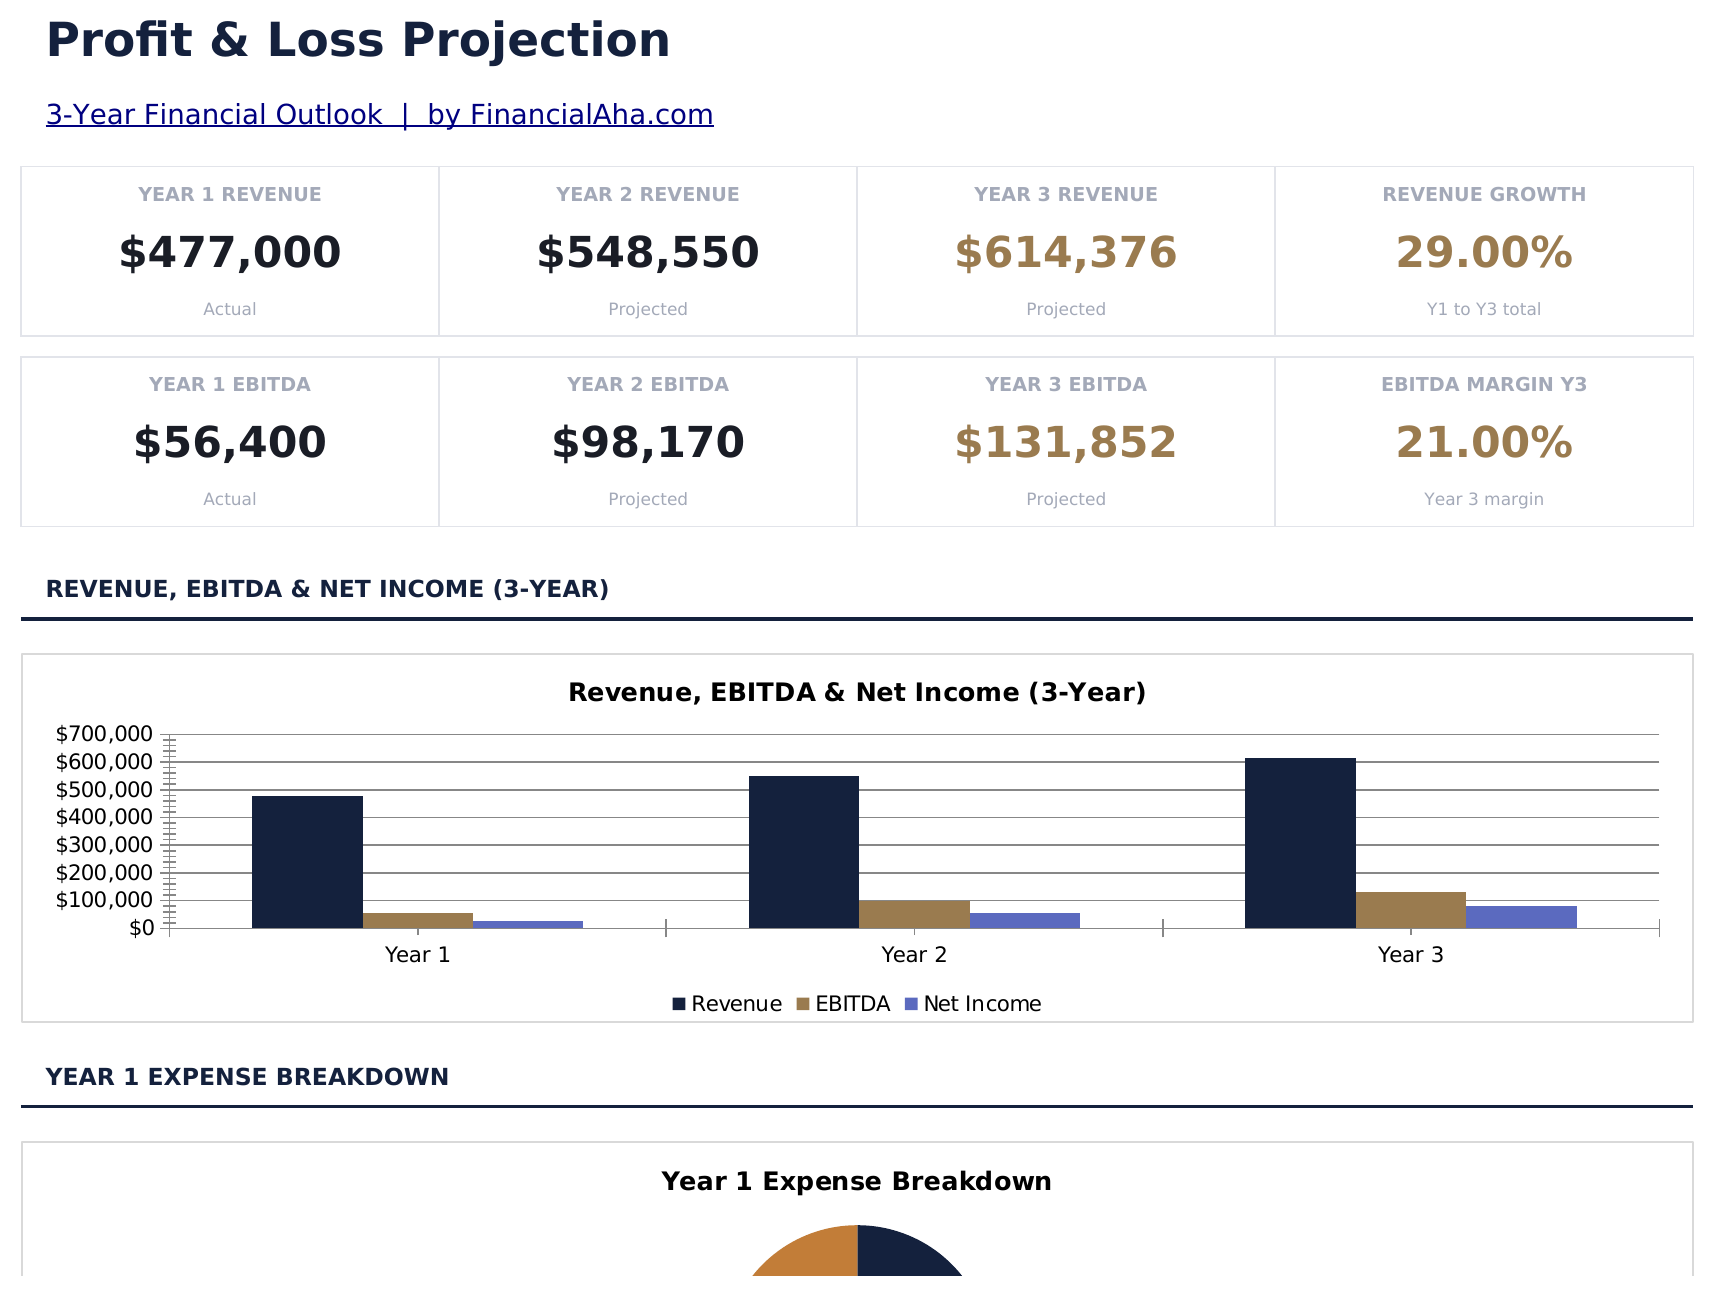
- Dashboard mit 6 KPI-Karten: Jahresumsatz, jährliche Herstellungskosten, Bruttomarge %, Betriebsergebnis, Nettoergebnis und Break-even-Monat
Vorschau
Sehen Sie, was in dieser Vorlage enthalten ist
So verwenden Sie diese Gewinn- und Verlustprognose-Vorlage
Umsatzprognosen eingeben
Listen Sie jede Umsatzquelle mit prognostizierten monatlichen oder quartalsweisen Betraegen ueber den Prognosezeitraum auf.
Herstellungskosten hinzufuegen
Geben Sie direkte Kosten ein, die mit der Lieferung Ihres Produkts oder Ihrer Dienstleistung verbunden sind. Der Bruttogewinn wird automatisch berechnet.
Betriebsausgaben eintragen
Fuegen Sie monatliche Schaetzungen fuer Personal, Miete, Marketing, Nebenkosten, Versicherung und weitere Betriebskosten hinzu.
Nettogewinn pruefen
Das Dashboard zeigt prognostizierten Umsatz, Bruttomarge, Betriebsausgaben und Nettogewinn mit Margenprozentsaetzen.
Customer Reviews
What Our Customers Say
"If I get half as good at handling my finances as you are at customer service, this'll be the best $26 I've spent lately."
"Great tool! Simplifies financial planning without the hassle of complex spreadsheets."
"I recently purchased your super convenient spreadsheet, it really helps me!"
"They're great and super intuitive. Thank you!"
Erstellt von Claude AI. Verfeinert von uns.
Wir verwenden Claude AI, um jede Vorlage nach gründlicher Recherche zu entwerfen. Dann greift unser Team ein. Wir verfeinern das Layout, testen jede Formel auf Herz und Nieren, beheben Grenzfälle und polieren das Design, bis es sich anfühlt wie etwas, das wir selbst verwenden würden. Die KI bringt uns 80 % ans Ziel. Die letzten 20 % sind rein menschliches Urteilsvermögen.
Häufig gestellte Fragen
Wie viele Monate kann ich prognostizieren?
Die Vorlage unterstuetzt bis zu 12 Monatsspalten mit einer Jahressumme. Passen Sie die Spaltenkoepfe an Ihren Prognosezeitraum an.
Was ist Bruttogewinn vs. Nettogewinn?
Bruttogewinn ist Umsatz minus direkte Kosten (Herstellungskosten). Nettogewinn zieht alle Betriebsausgaben vom Bruttogewinn ab. Beide werden mit Margenprozentsaetzen angezeigt.
Kann ich quartalsweise statt monatlich verwenden?
Ja. Aendern Sie die Spaltenkoepfe von Monaten auf Quartale und geben Sie Quartalszahlen ein. Die Jahressumme summiert weiterhin alle Spalten.
Eignet sich das fuer die Startup-Planung?
Ja. GuV-Prognosen sind ein zentraler Bestandteil von Geschaeftsplaenen. Kombinieren Sie diese mit der Vorlage fuer Gruendungskosten fuer ein vollstaendiges Finanzbild.
Wie öffne ich diese Vorlage in Google Sheets?
Laden Sie die .xlsx-Datei auf Google Drive hoch und öffnen Sie sie mit Google Sheets. Alle Formeln und Formatierungen bleiben erhalten.
Weitere Essentials-Vorlagen: Unternehmensfinanzen
Highlights:
Auf der Suche nach Premium-Tabellenvorlagen?
Unsere kostenpflichtigen Vorlagen umfassen erweiterte mehrseitige Dashboards, native Excel-Diagramme und laufende Aktualisierungen.
Holen Sie sich stattdessen jede Ultimate-Vorlage
Alle 58 Ultimate-Vorlagen in einem Kauf für $299 - $1,102 Wert, Sie behalten $803.