توقعات الأرباح والخسائر قالب Essentials
توقّع الإيرادات والتكاليف والأرباح خلال فترة محددة. مفيد لتخطيط الأعمال والتنبّؤ وتقييم السيناريوهات المالية.
ماذا يتضمن
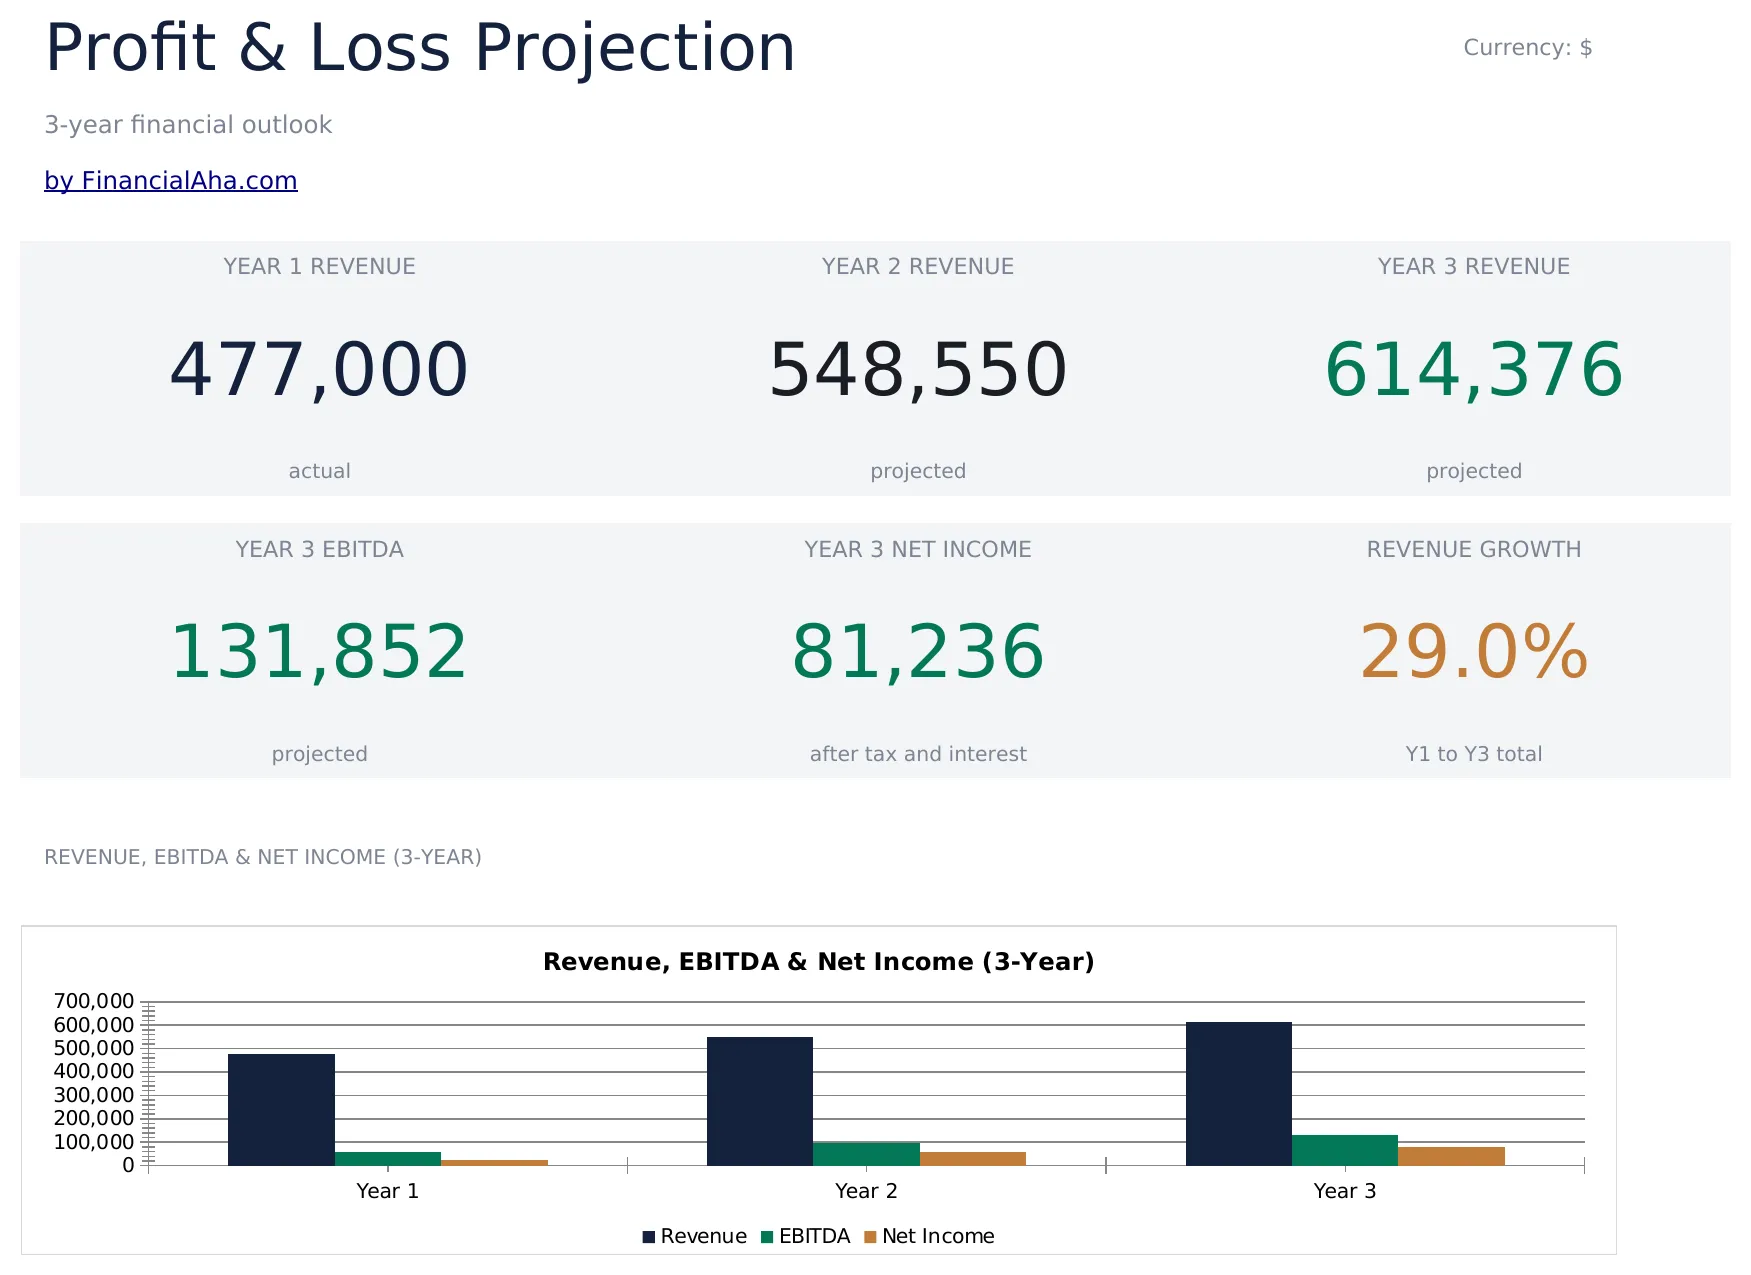
- لوحة متابعة بنظرة عامة على الأرباح والخسائر تعرض إجمالي الإيرادات وتكلفة البضاعة المباعة وإجمالي الربح وصافي الربح
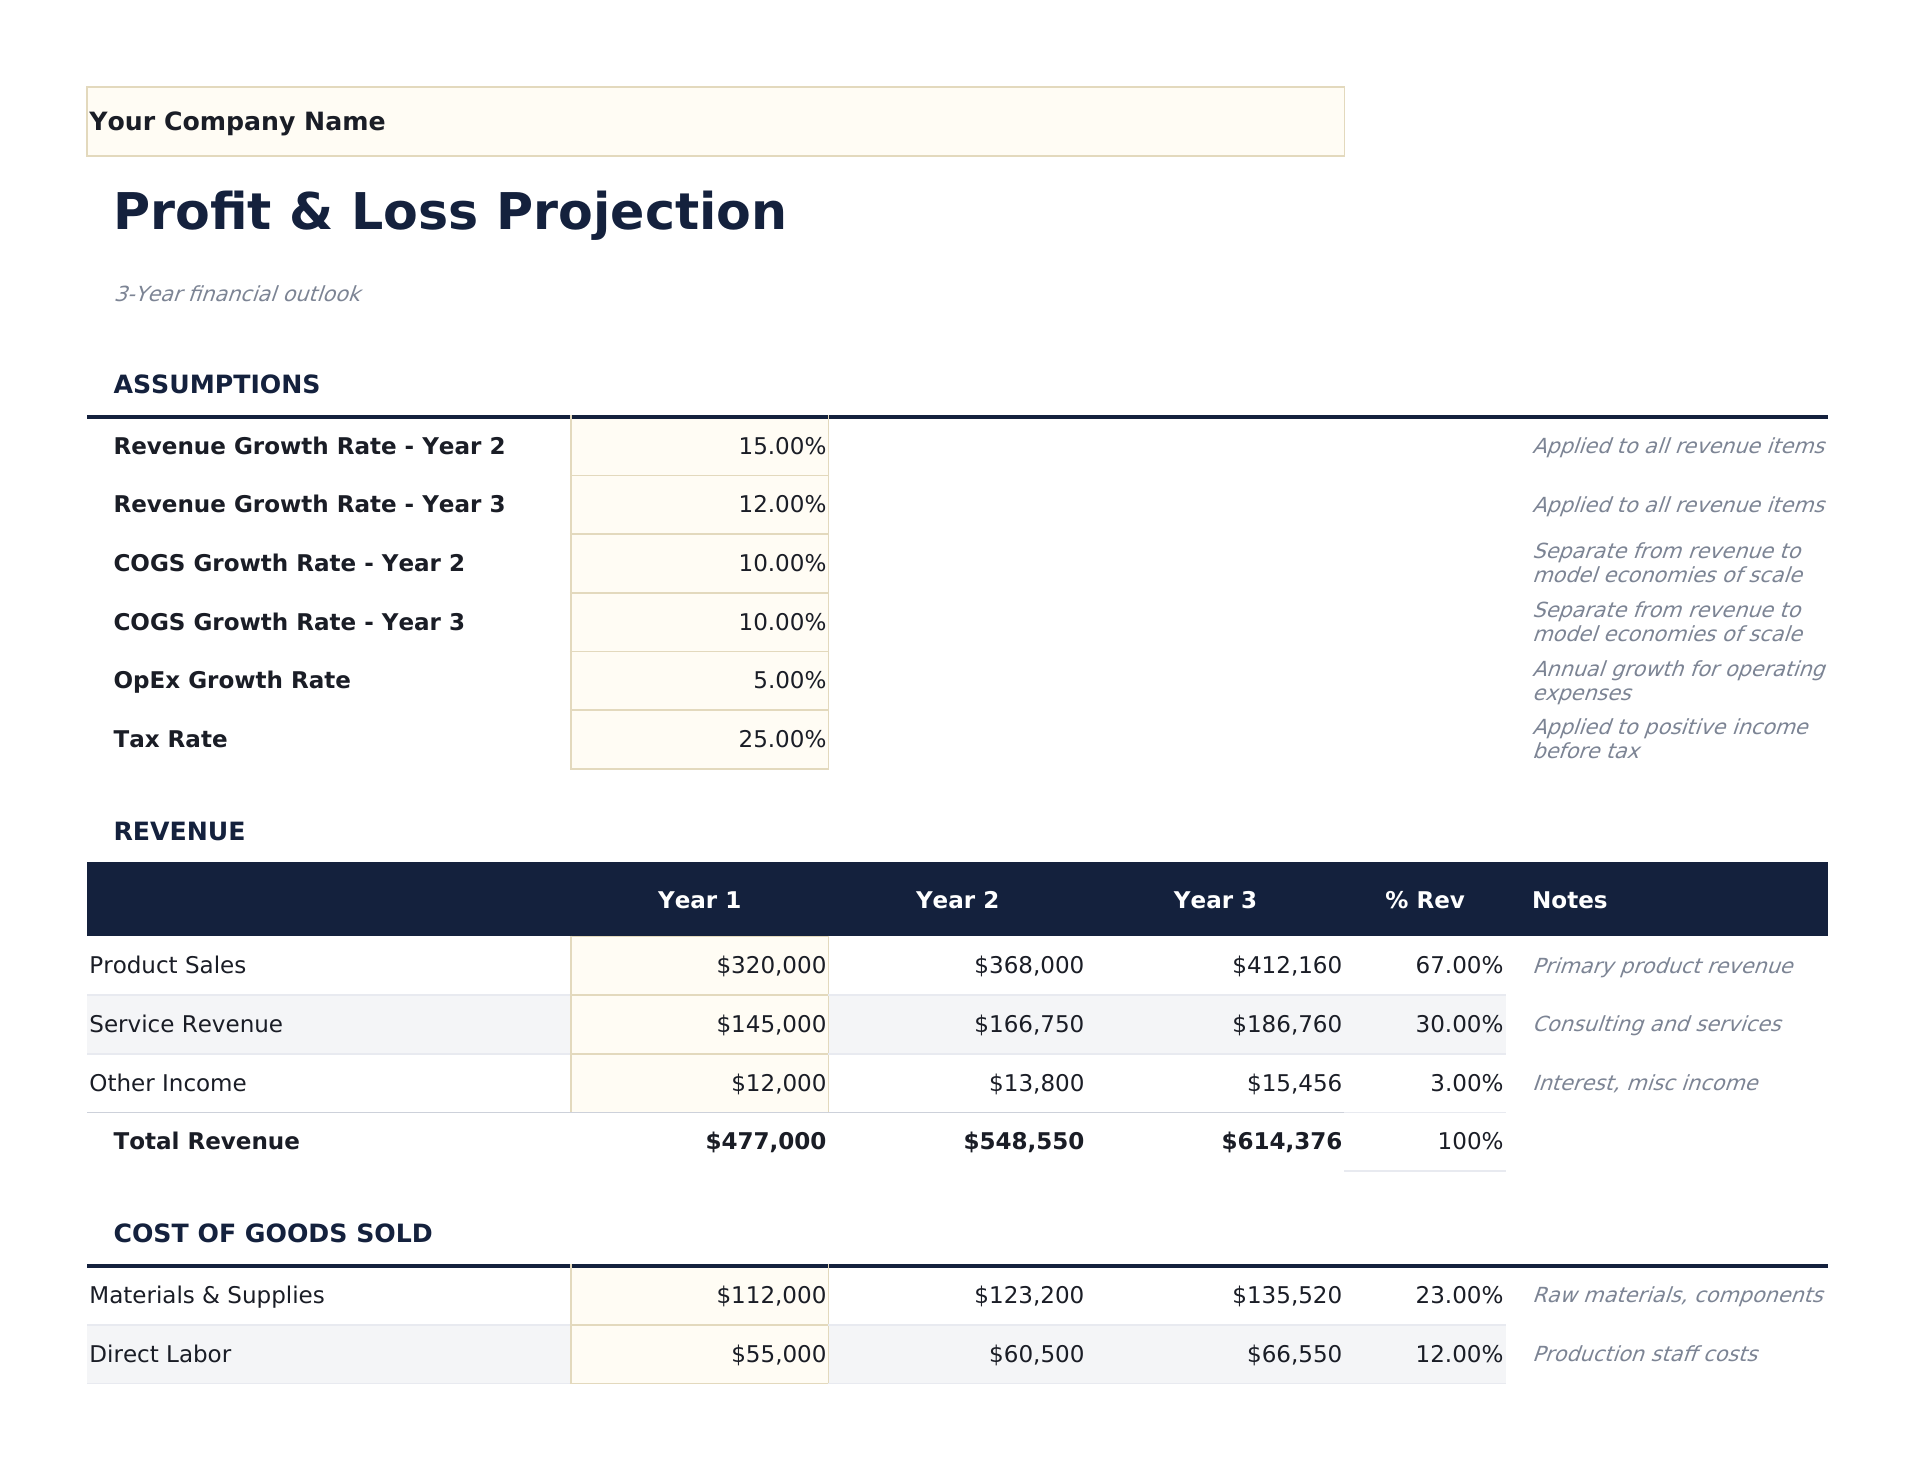
- قائمة أرباح وخسائر ببنود الإيرادات والتكاليف المباشرة والمصاريف التشغيلية وصافي الدخل بمجاميع فرعية تلقائية
- حسابات إجمالي الربح وصافي الربح بنسب هامش تلقائية معروضة بجانب المبالغ بالدولار
- أعمدة توقعات شهرية أو ربع سنوية تمتد حتى 12 شهراً بإجماليات سنوية تلقائية في النهاية
- عرض نسبة الهامش مع خلايا إدخال ملوّنة (صفراء) وتوقعات مدفوعة بالصيغ (زرقاء)
- يعمل في Microsoft Excel وGoogle Sheets وLibreOffice Calc دون الحاجة لأي إعداد
Need more from this template?
The Essentials version covers everyday tracking. Ultimate goes further with multi-entity support, scenario analysis, and ultimate-grade reporting.
- لوحة متابعة بنظرة عامة على الأرباح والخسائر تعرض إجمالي الإيرادات وتكلفة البضاعة المباعة وإجمالي الربح وصافي الربح
- قائمة أرباح وخسائر ببنود الإيرادات والتكاليف المباشرة والمصاريف التشغيلية وصافي الدخل بمجاميع فرعية تلقائية
- حسابات إجمالي الربح وصافي الربح بنسب هامش تلقائية معروضة بجانب المبالغ بالدولار
- أعمدة توقعات شهرية أو ربع سنوية تمتد حتى 12 شهراً بإجماليات سنوية تلقائية في النهاية
- ورقة تنبؤ بالإيرادات مع حتى 10 خطوط منتجات أو خدمات وتوقعات شهرية وإجماليات سنوية مع تتبع معدل النمو
- ورقة تكاليف الإنتاج مع تفصيل المواد المباشرة والعمالة المباشرة والتكاليف العامة لكل خط إيرادات مع حسابات هامش الربح الإجمالي
- ورقة المصروفات التشغيلية مع 12 فئة مصروفات عبر 12 عموداً شهرياً وتتبع الميزانية مقابل الفعلي السنوي
- قائمة أرباح وخسائر موحدة تسحب من جميع أوراق الإدخال: الإيرادات وتكاليف الإنتاج والربح الإجمالي والمصروفات التشغيلية والدخل التشغيلي وصافي الدخل
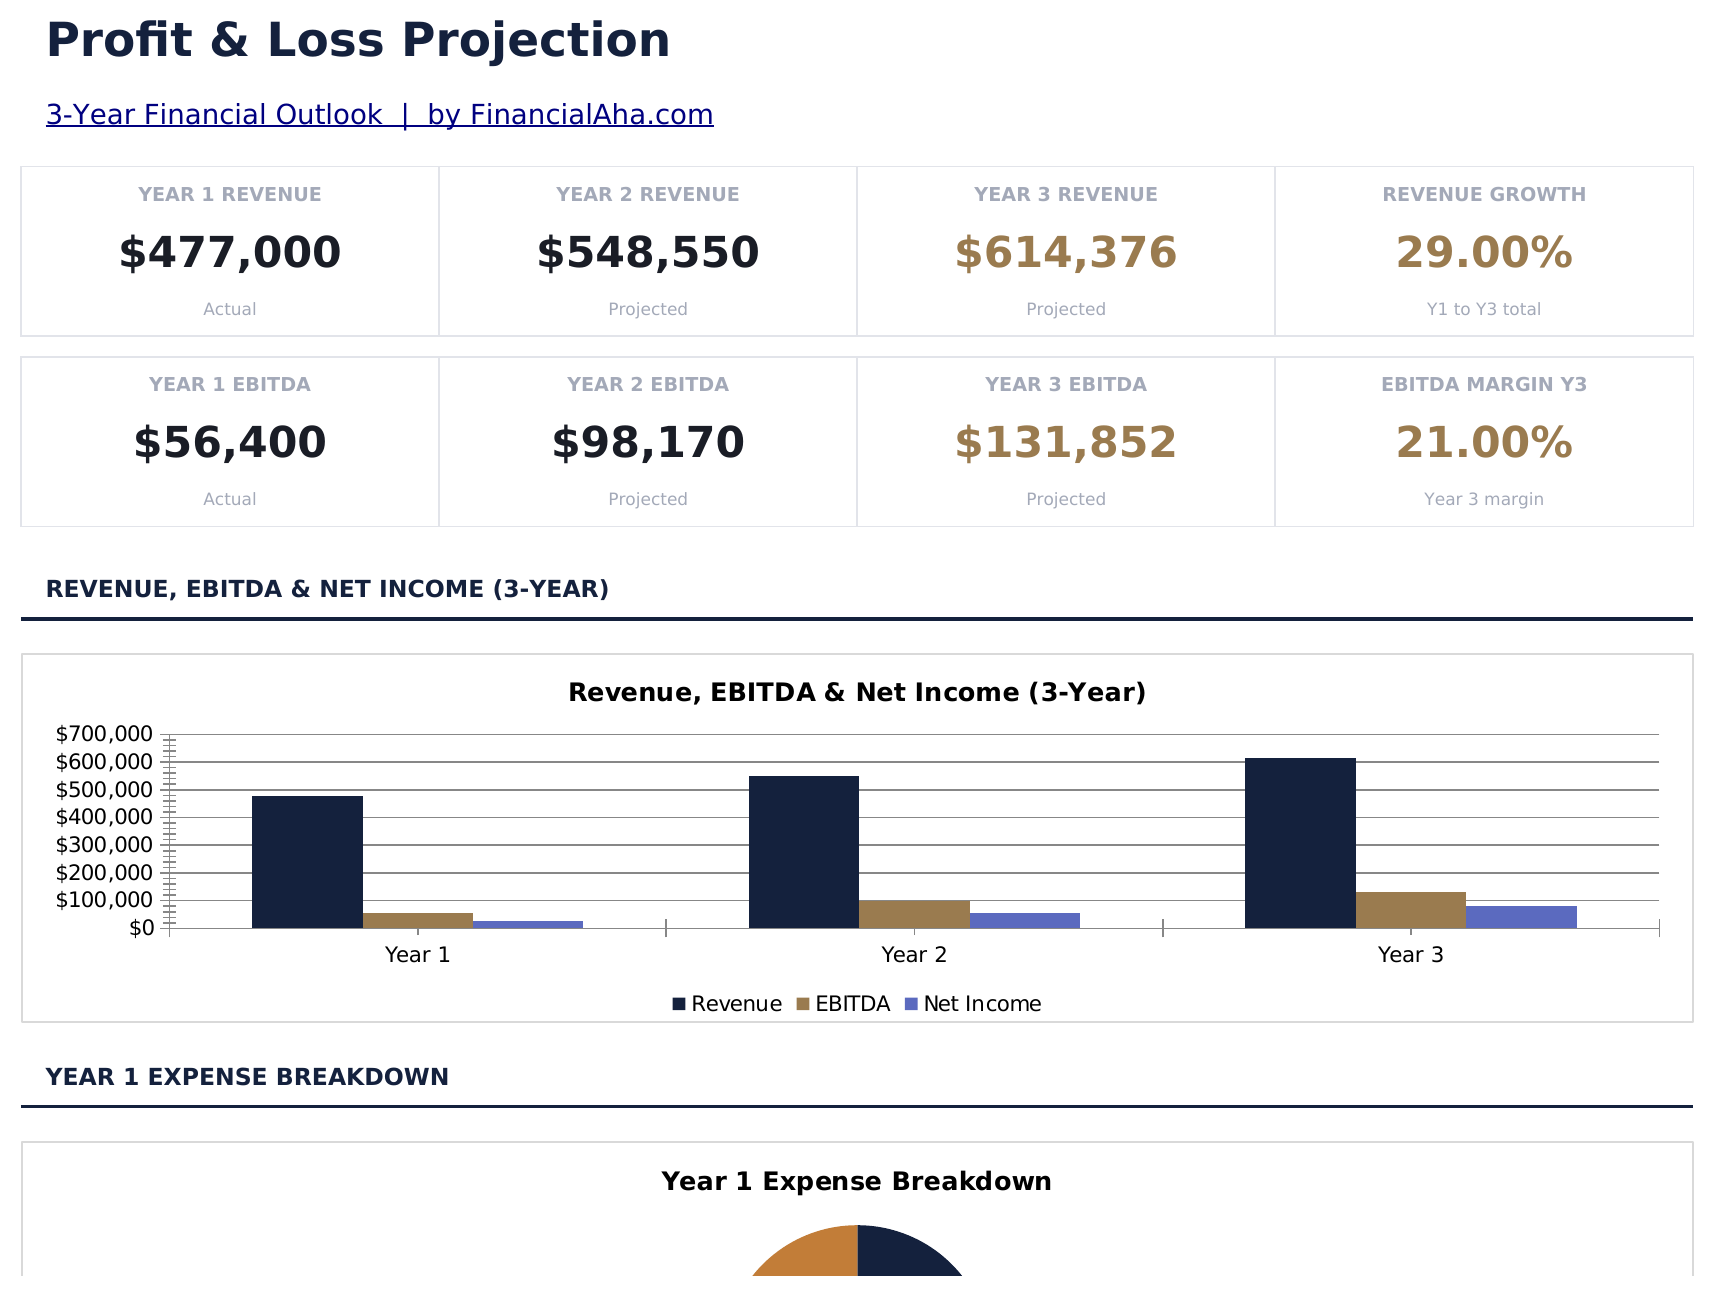
- لوحة معلومات مع 6 بطاقات KPI: الإيرادات السنوية وتكاليف الإنتاج السنوية وهامش الربح الإجمالي% والدخل التشغيلي وصافي الدخل وشهر نقطة التعادل
معاينة
اطلع على محتويات هذا القالب
كيفية استخدام قالب توقعات الأرباح والخسائر هذا
أدخل توقعات الإيرادات
اذكر كل مصدر إيرادات بمبالغ شهرية أو ربع سنوية متوقعة عبر فترة التوقع.
أضف تكلفة البضاعة المباعة
أدخل التكاليف المباشرة المرتبطة بتقديم منتجك أو خدمتك. يُحسب إجمالي الربح تلقائياً.
أكمل المصاريف التشغيلية
أضف تقديرات شهرية للرواتب والإيجار والتسويق والمرافق والتأمين وتكاليف التشغيل الأخرى.
راجع صافي الربح
تعرض لوحة المتابعة الإيرادات المتوقعة وهامش الربح الإجمالي والمصاريف التشغيلية وصافي الربح بنسب هامش.
Customer Reviews
What Our Customers Say
"If I get half as good at handling my finances as you are at customer service, this'll be the best $26 I've spent lately."
"Great tool! Simplifies financial planning without the hassle of complex spreadsheets."
"I recently purchased your super convenient spreadsheet, it really helps me!"
"They're great and super intuitive. Thank you!"
صُممت بواسطة Claude AI. أتقنّاها نحن.
نستخدم Claude AI لصياغة كل قالب بعد بحث معمّق. ثم يتدخل فريقنا. نحسّن التصميم، ونختبر كل صيغة، ونعالج الحالات الاستثنائية، وننقّح التصميم حتى يصبح شيئاً نستخدمه نحن فعلاً. الذكاء الاصطناعي يوصلنا إلى 80%. الـ 20% المتبقية هي حكم بشري بالكامل.
الأسئلة الشائعة
كم شهراً يمكنني التوقع؟
يدعم القالب حتى 12 عموداً شهرياً بإجمالي سنوي. عدّل عناوين التواريخ لفترة التوقع الخاصة بك.
ما الفرق بين إجمالي الربح وصافي الربح؟
إجمالي الربح هو الإيرادات ناقص التكاليف المباشرة (تكلفة البضاعة المباعة). صافي الربح يطرح جميع المصاريف التشغيلية من إجمالي الربح. كلاهما معروض بنسب هامش.
هل يمكنني استخدام ربع سنوي بدل شهري؟
نعم. غيّر عناوين الأعمدة من أشهر إلى أرباع وأدخل أرقاماً ربع سنوية. يظل الإجمالي السنوي يجمع جميع الأعمدة.
هل هذا جيد لتخطيط الشركات الناشئة؟
نعم. توقعات الأرباح والخسائر جزء أساسي من خطط الأعمال. ادمج هذا مع قالب تكاليف التأسيس لصورة مالية كاملة.
كيف أفتح هذا في Google Sheets؟
ارفع ملف .xlsx إلى Google Drive، ثم افتحه باستخدام Google Sheets. جميع الصيغ والتنسيقات ستبقى محفوظة.
المزيد من قوالب Essentials في التمويل التجاري
أبرز النقاط:
تبحث عن قوالب جداول بيانات احترافية؟
القوالب المدفوعة تشمل لوحات معلومات متعددة الأوراق متقدمة، ورسوم بيانية أصلية في Excel، وتحديثات مستمرة.
احصل على كل قالب Ultimate بدلاً من ذلك
جميع الـ 58 قالب Ultimate في عملية شراء واحدة مقابل $299 - بقيمة $1,102، توفر $803.