Budget Aziendale Modello Essentials
Pianifica e monitora entrate e spese aziendali su base mensile. Copre i costi operativi, i ricavi e i budget per reparto.
Cosa include
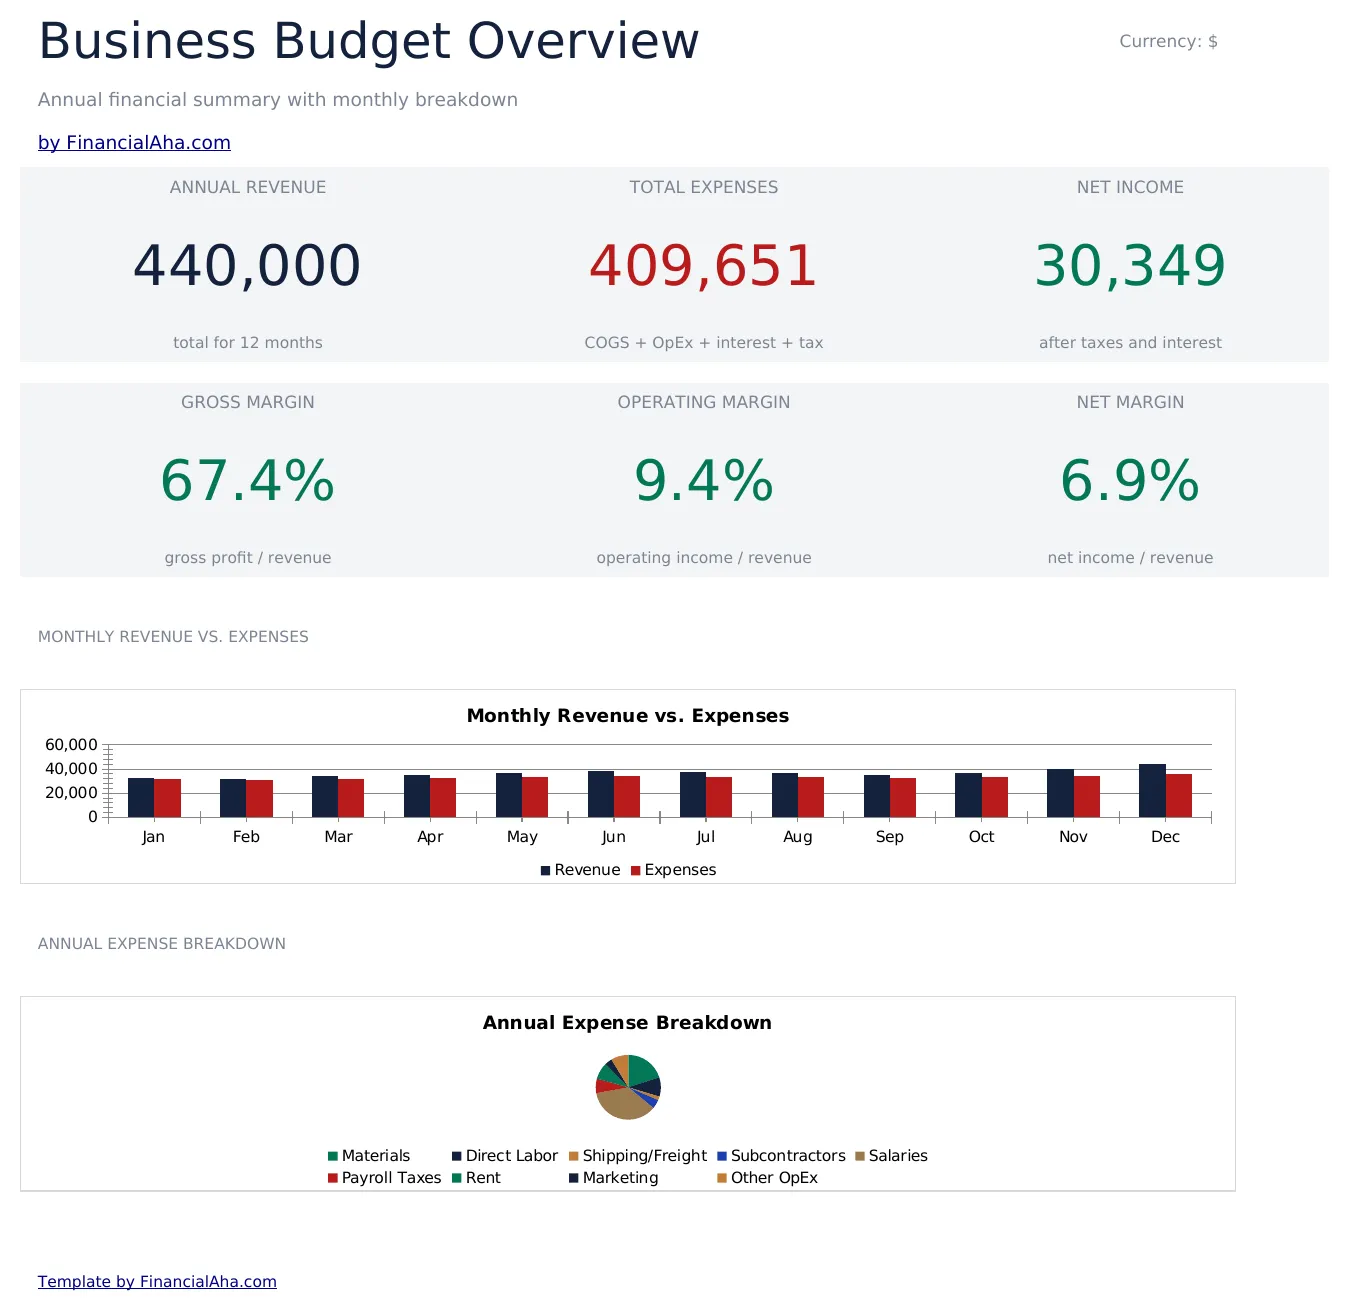
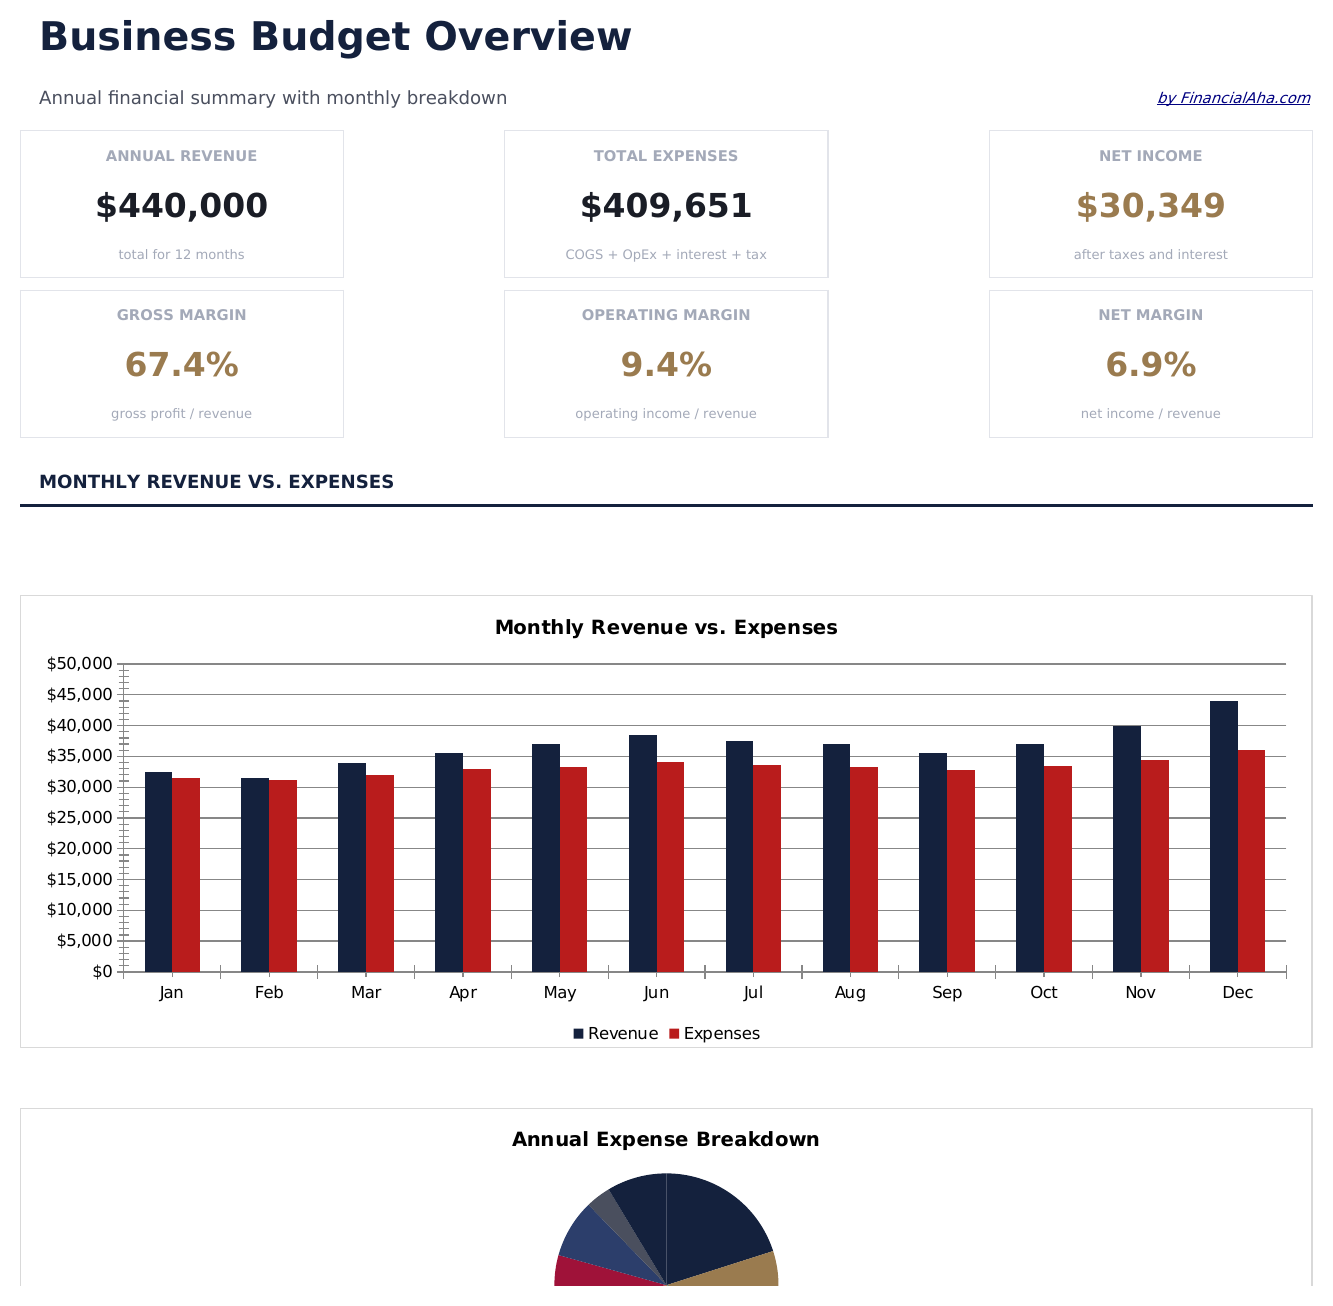
- Dashboard con panoramica del budget aziendale che mostra ricavi totali, spese totali, reddito netto e utilizzo del budget
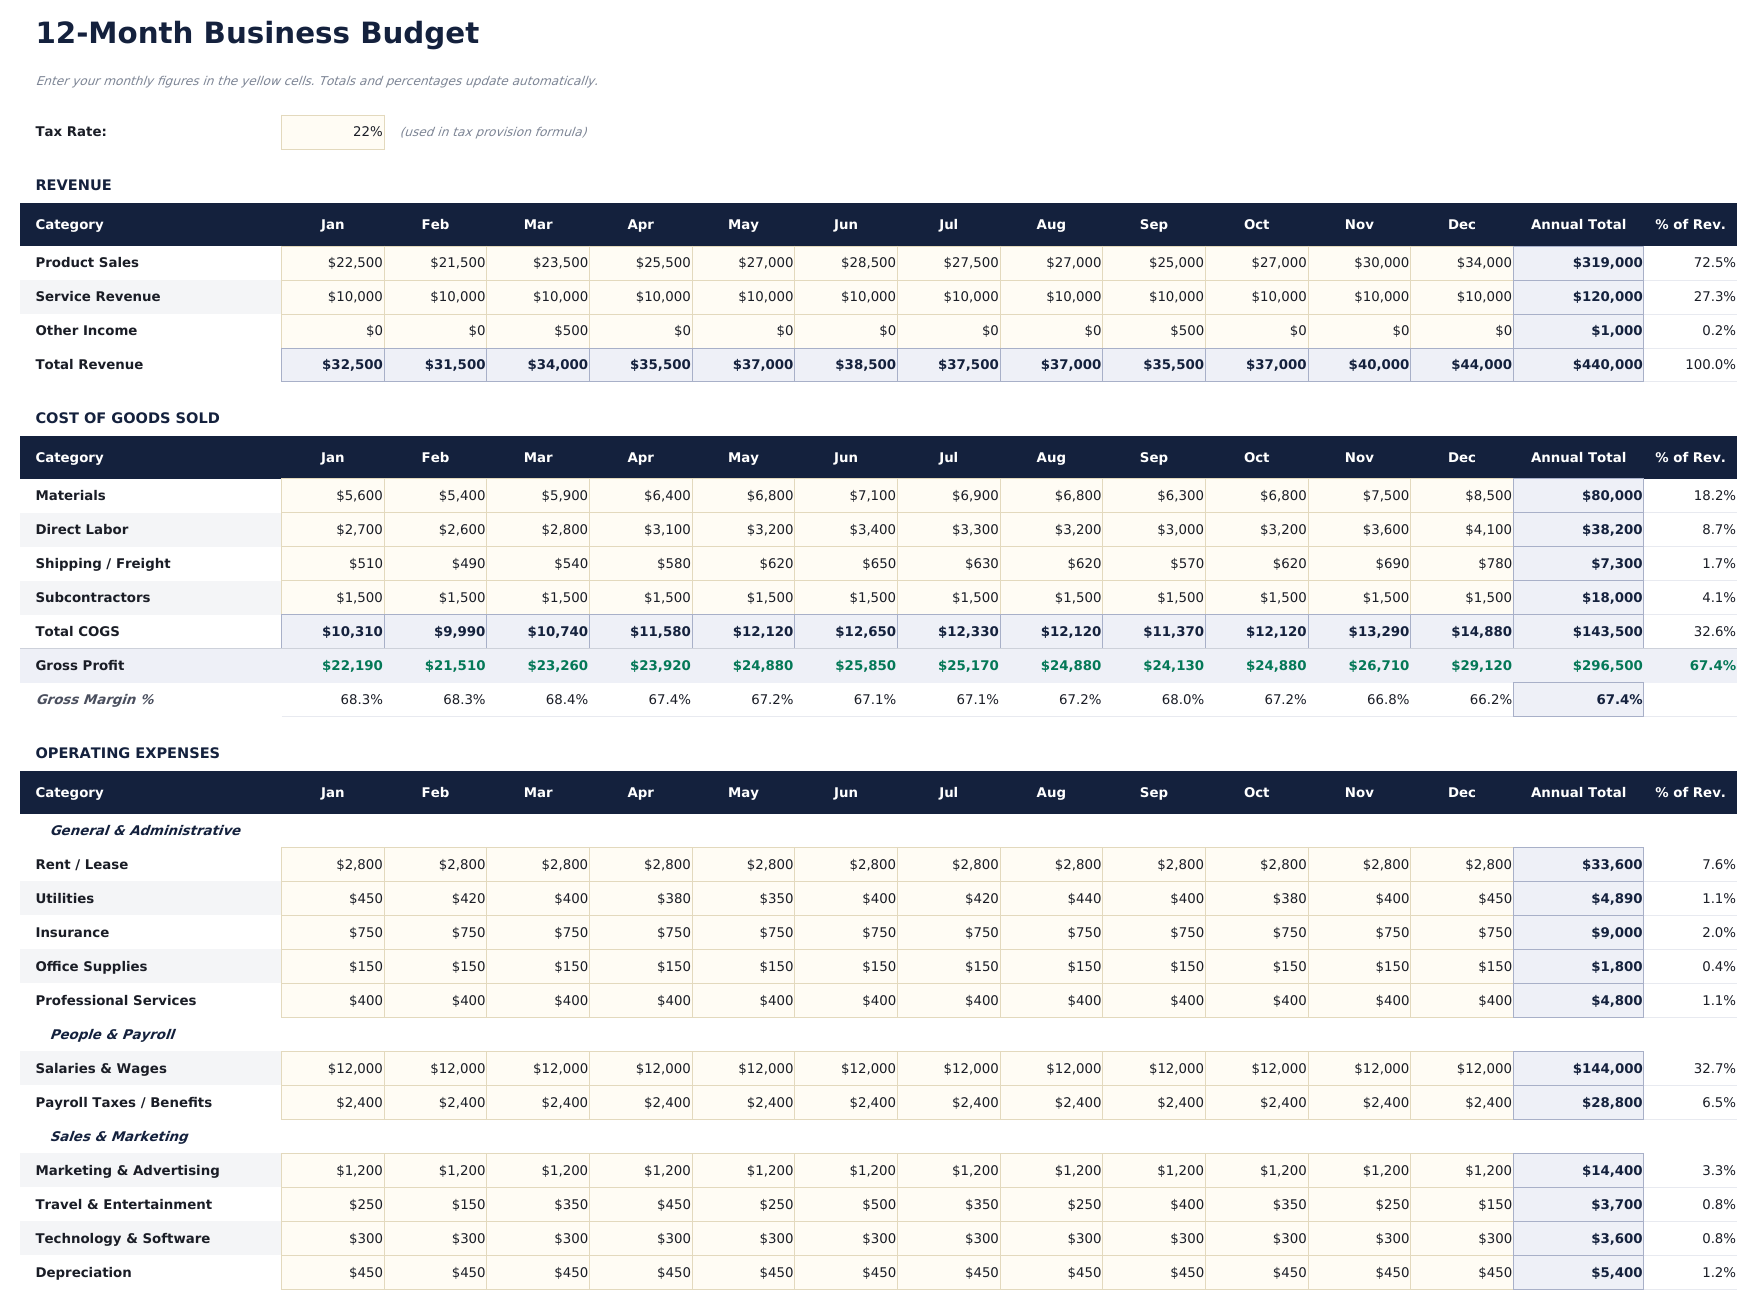
- Budget mensile con categorie di ricavo e voci di spesa per retribuzioni, affitto, marketing, utenze e forniture
- Suddivisioni per reparto o categoria che consentono il monitoraggio separato del budget per vendite, operazioni, amministrazione e altri team
- Colonne di confronto budget vs. effettivo con calcoli automatici degli scostamenti per ogni voce di ricavo e spesa
- Indicatori di scostamento con codice colore che evidenziano gli scostamenti favorevoli e sfavorevoli con percentuali calcolate automaticamente
- Funziona con Microsoft Excel, Google Sheets e LibreOffice Calc senza alcuna configurazione iniziale
Need more from this template?
The Essentials version covers everyday tracking. Ultimate goes further with multi-entity support, scenario analysis, and ultimate-grade reporting.
- Dashboard con panoramica del budget aziendale che mostra ricavi totali, spese totali, reddito netto e utilizzo del budget
- Budget mensile con categorie di ricavo e voci di spesa per retribuzioni, affitto, marketing, utenze e forniture
- Suddivisioni per reparto o categoria che consentono il monitoraggio separato del budget per vendite, operazioni, amministrazione e altri team
- Colonne di confronto budget vs. effettivo con calcoli automatici degli scostamenti per ogni voce di ricavo e spesa
- Foglio Budget Ricavi con fino a 10 flussi di ricavo, obiettivi mensili e totali annuali con ipotesi di crescita editabili
- Foglio Budget Spese con fino a 15 categorie di spesa su 12 mesi con totali mensili e annuali
- Foglio Budget per Reparto che alloca il budget su fino a 6 reparti con organico, stipendi e dettaglio spese operative
- Dashboard con 6 schede KPI: ricavi a budget, spese a budget, budget netto, maggiore categoria di spesa, tasso di crescita ricavi e margine operativo
- Foglio Revisione Trimestrale che confronta budget vs consuntivo per ricavi, spese e utile netto da Q1 a Q4 con analisi degli scostamenti
Anteprima
Scopri cosa contiene questo modello
Come usare questo modello Budget Aziendale
Inserisci le categorie di ricavo
Elenca ogni fonte di ricavo con gli importi mensili previsti - vendita di prodotti, tariffe per servizi, abbonamenti o altri flussi di entrata.
Aggiungi le voci di spesa
Compila le spese operative per categoria - retribuzioni, affitto, marketing, utenze, forniture e assicurazioni con i budget mensili.
Inserisci gli importi effettivi
Con il progredire del mese, registra i ricavi e le spese effettivi. Le colonne degli scostamenti mostrano dove sei sopra o sotto budget.
Esamina la dashboard
La dashboard riepiloga i ricavi totali, le spese totali, il reddito netto e l'utilizzo complessivo del budget con i relativi scostamenti.
Customer Reviews
What Our Customers Say
"If I get half as good at handling my finances as you are at customer service, this'll be the best $26 I've spent lately."
"Great tool! Simplifies financial planning without the hassle of complex spreadsheets."
"I recently purchased your super convenient spreadsheet, it really helps me!"
"They're great and super intuitive. Thank you!"
Creati da Claude AI. Perfezionati da noi.
Utilizziamo Claude AI per creare ogni modello, dopo una ricerca approfondita. Poi interviene il nostro team. Miglioriamo il layout, testiamo ogni formula, correggiamo i casi limite e rifiniamo il design fino a ottenere qualcosa che useremmo noi stessi. L'AI ci porta all'80%. L'ultimo 20% è tutto giudizio umano.
Domande frequenti
Posso suddividere il budget per reparto?
Sì. Organizza le categorie di spesa per reparto - vendite, marketing, operazioni, amministrazione. Aggiungi subtotali per reparto per il monitoraggio del budget dipartimentale.
Come funziona il monitoraggio degli scostamenti?
Il modello calcola la differenza tra gli importi preventivati e quelli effettivi per ogni voce. Gli scostamenti favorevoli (sotto budget) e quelli sfavorevoli (sopra budget) sono evidenziati con colori diversi.
Posso estenderlo a un anno intero?
Sì. Aggiungi colonne per ogni mese fino a 12 mesi. Il formato del modello supporta il monitoraggio mensile per tutto l'anno fiscale.
È adatto a piccole o grandi imprese?
Funziona per qualsiasi dimensione. Le piccole imprese usano meno categorie, mentre quelle più grandi aggiungono più voci e suddivisioni per reparto.
Come posso aprirlo in Google Sheets?
Carica il file .xlsx su Google Drive, poi aprilo con Google Sheets. Tutte le formule e la formattazione saranno conservate.
Altri modelli Essentials Finanza Aziendale
Punti Chiave:
Cerchi modelli di fogli di calcolo premium?
I nostri modelli a pagamento includono dashboard multi-foglio avanzate, grafici nativi Excel e aggiornamenti continui.
Privato e sicuro
I tuoi dati finanziari restano sul tuo dispositivo. Non li vediamo mai.
Scopri di piu →Ottieni invece ogni modello Ultimate
Tutti i 58 modelli Ultimate in un unico acquisto per $299 - valore di $1,102, risparmi $803.