Break-Even-Analyse Essentials-Vorlage
Berechnen Sie den Break-Even-Punkt, an dem der Umsatz alle Kosten deckt. Geben Sie Fixkosten, variable Kosten und Preise ein, um das erforderliche Absatzvolumen zu sehen.
Was enthalten ist
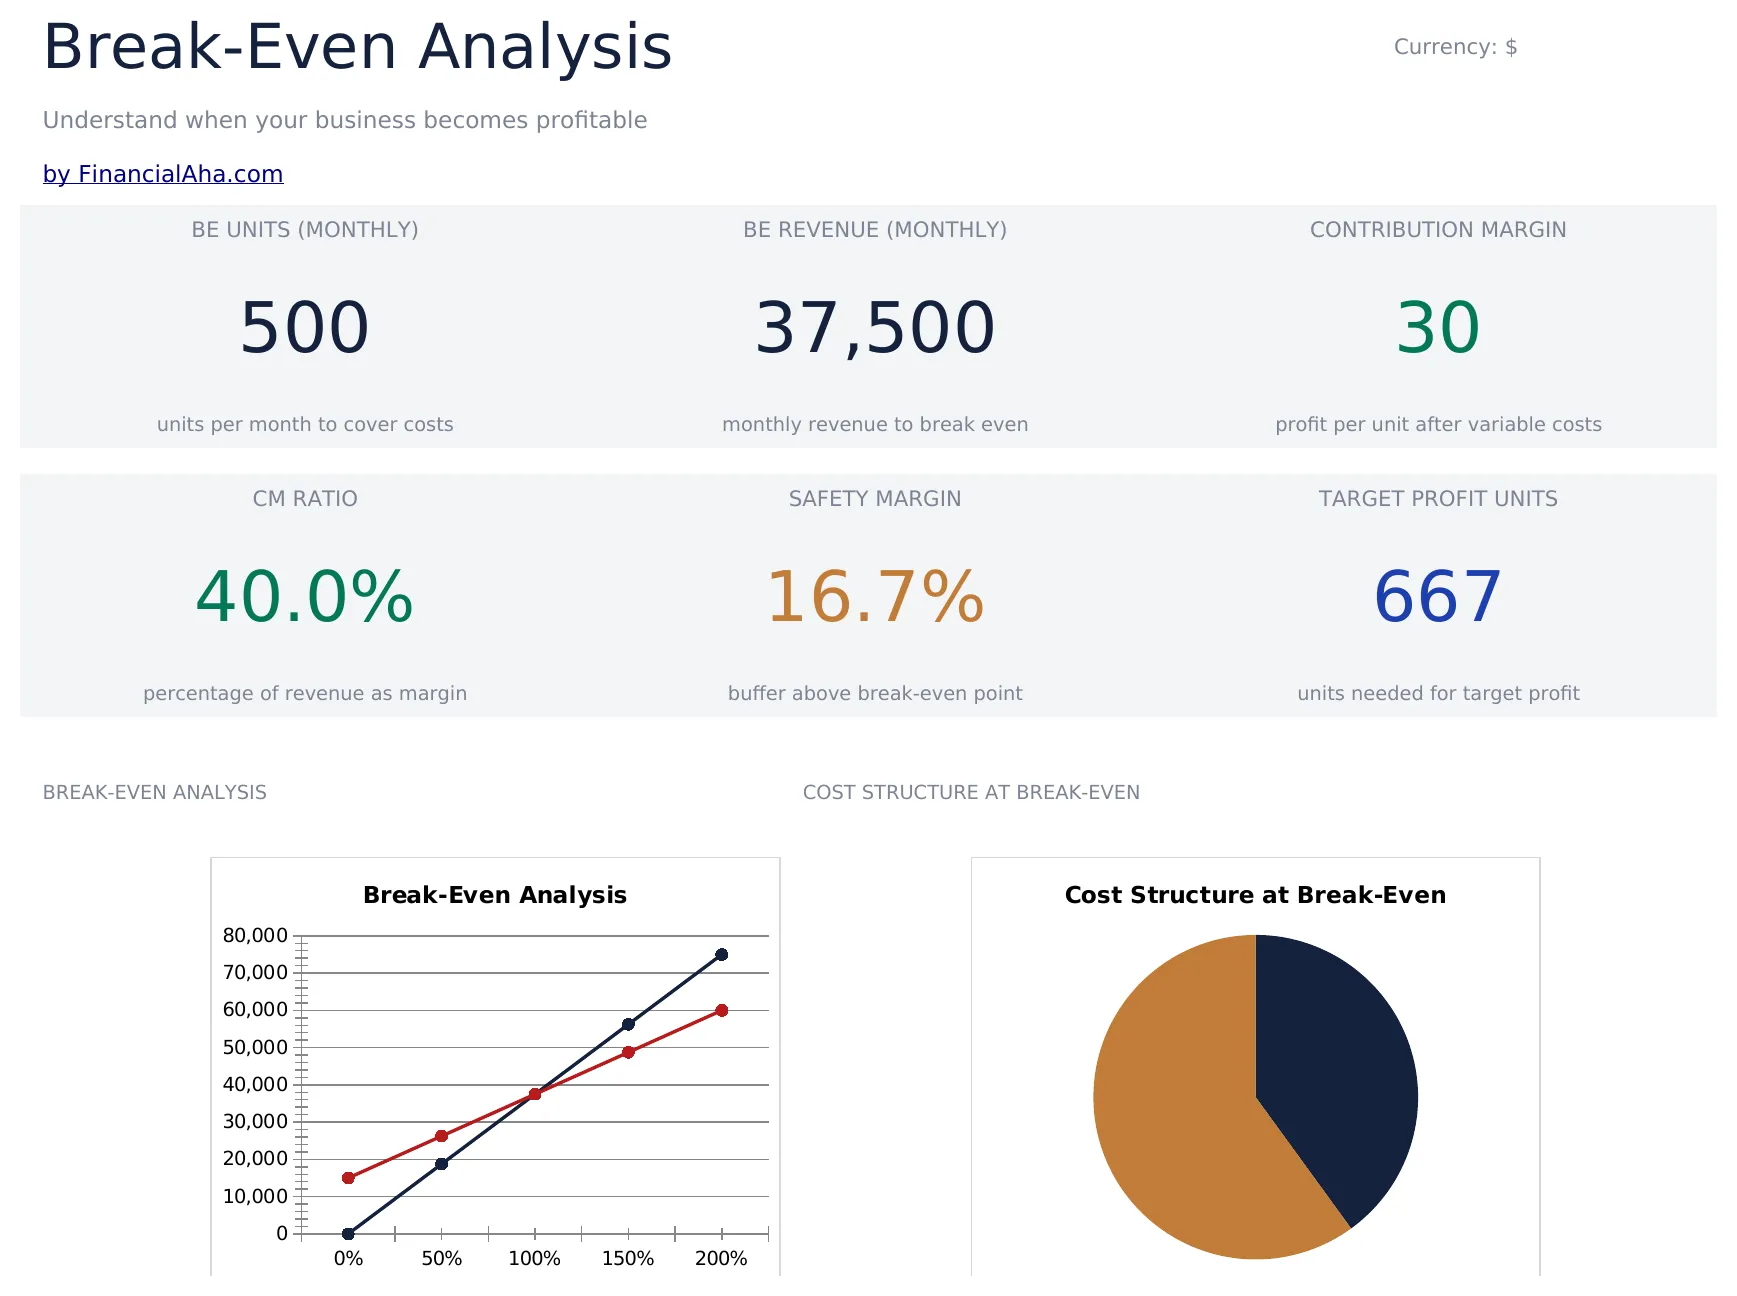
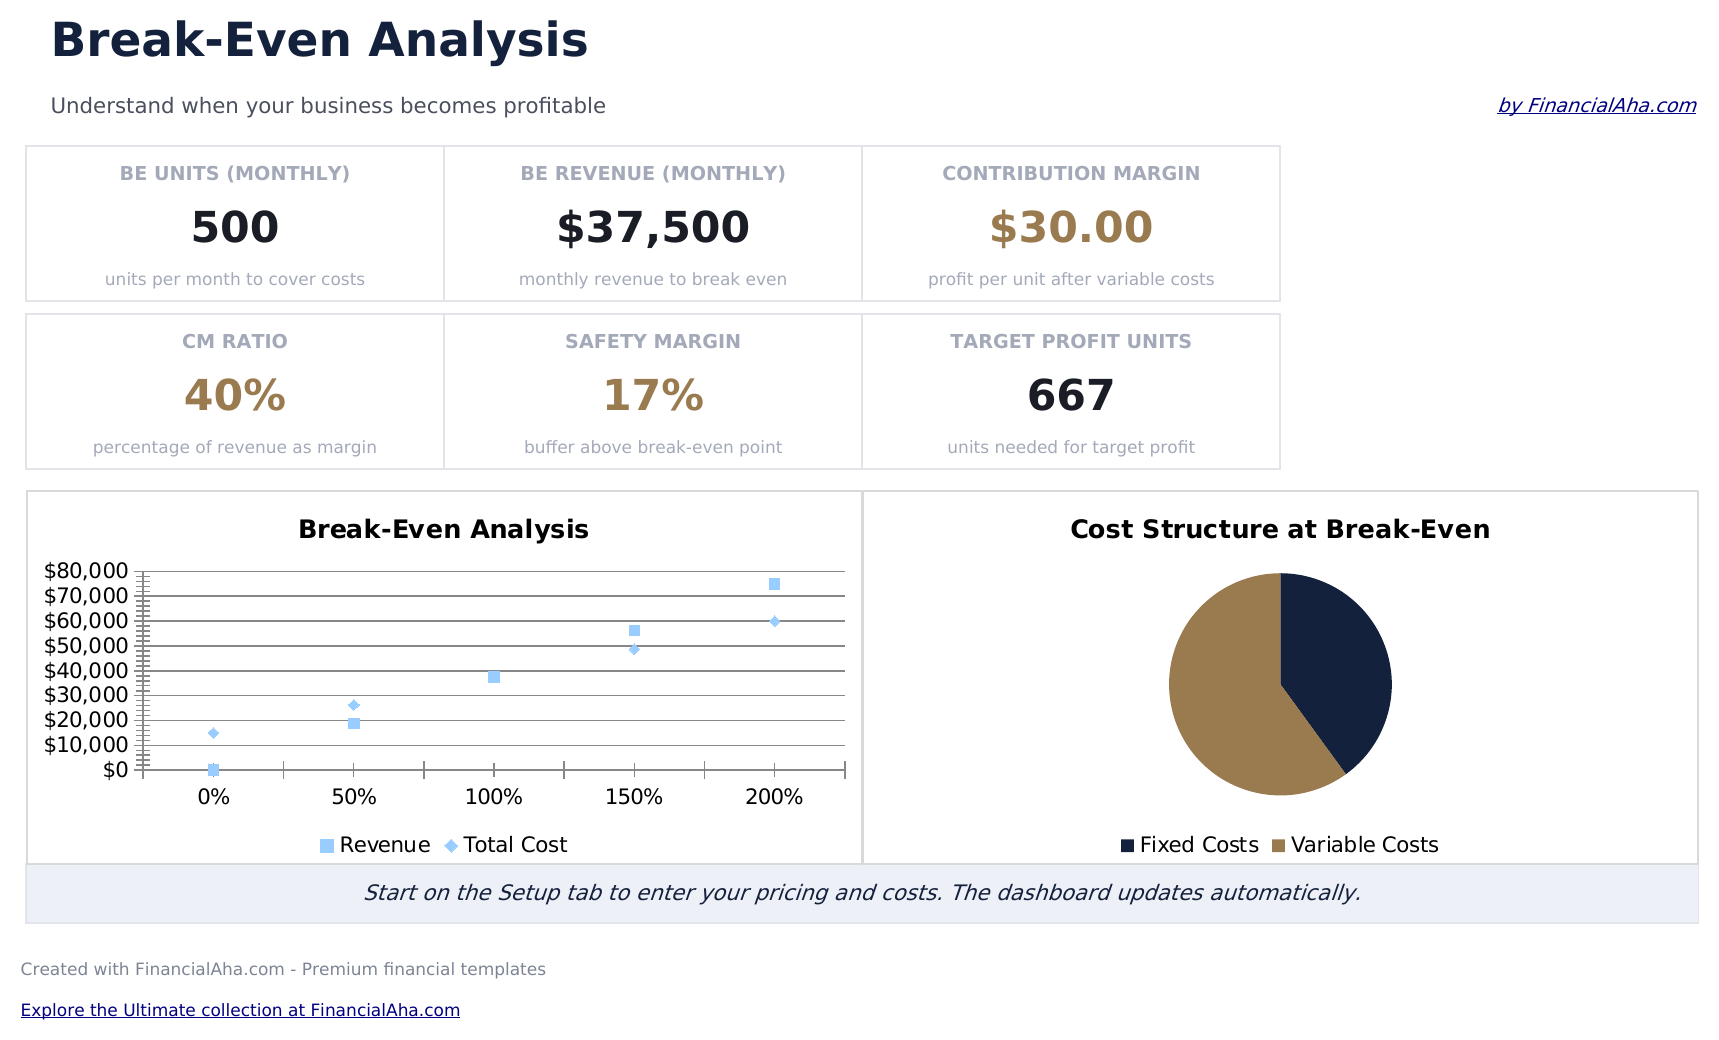
- Dashboard mit Break-Even-Punkt-Anzeige, die die genaue Stueckzahl und den Umsatzbetrag zeigt, die zur Deckung aller Kosten erforderlich sind
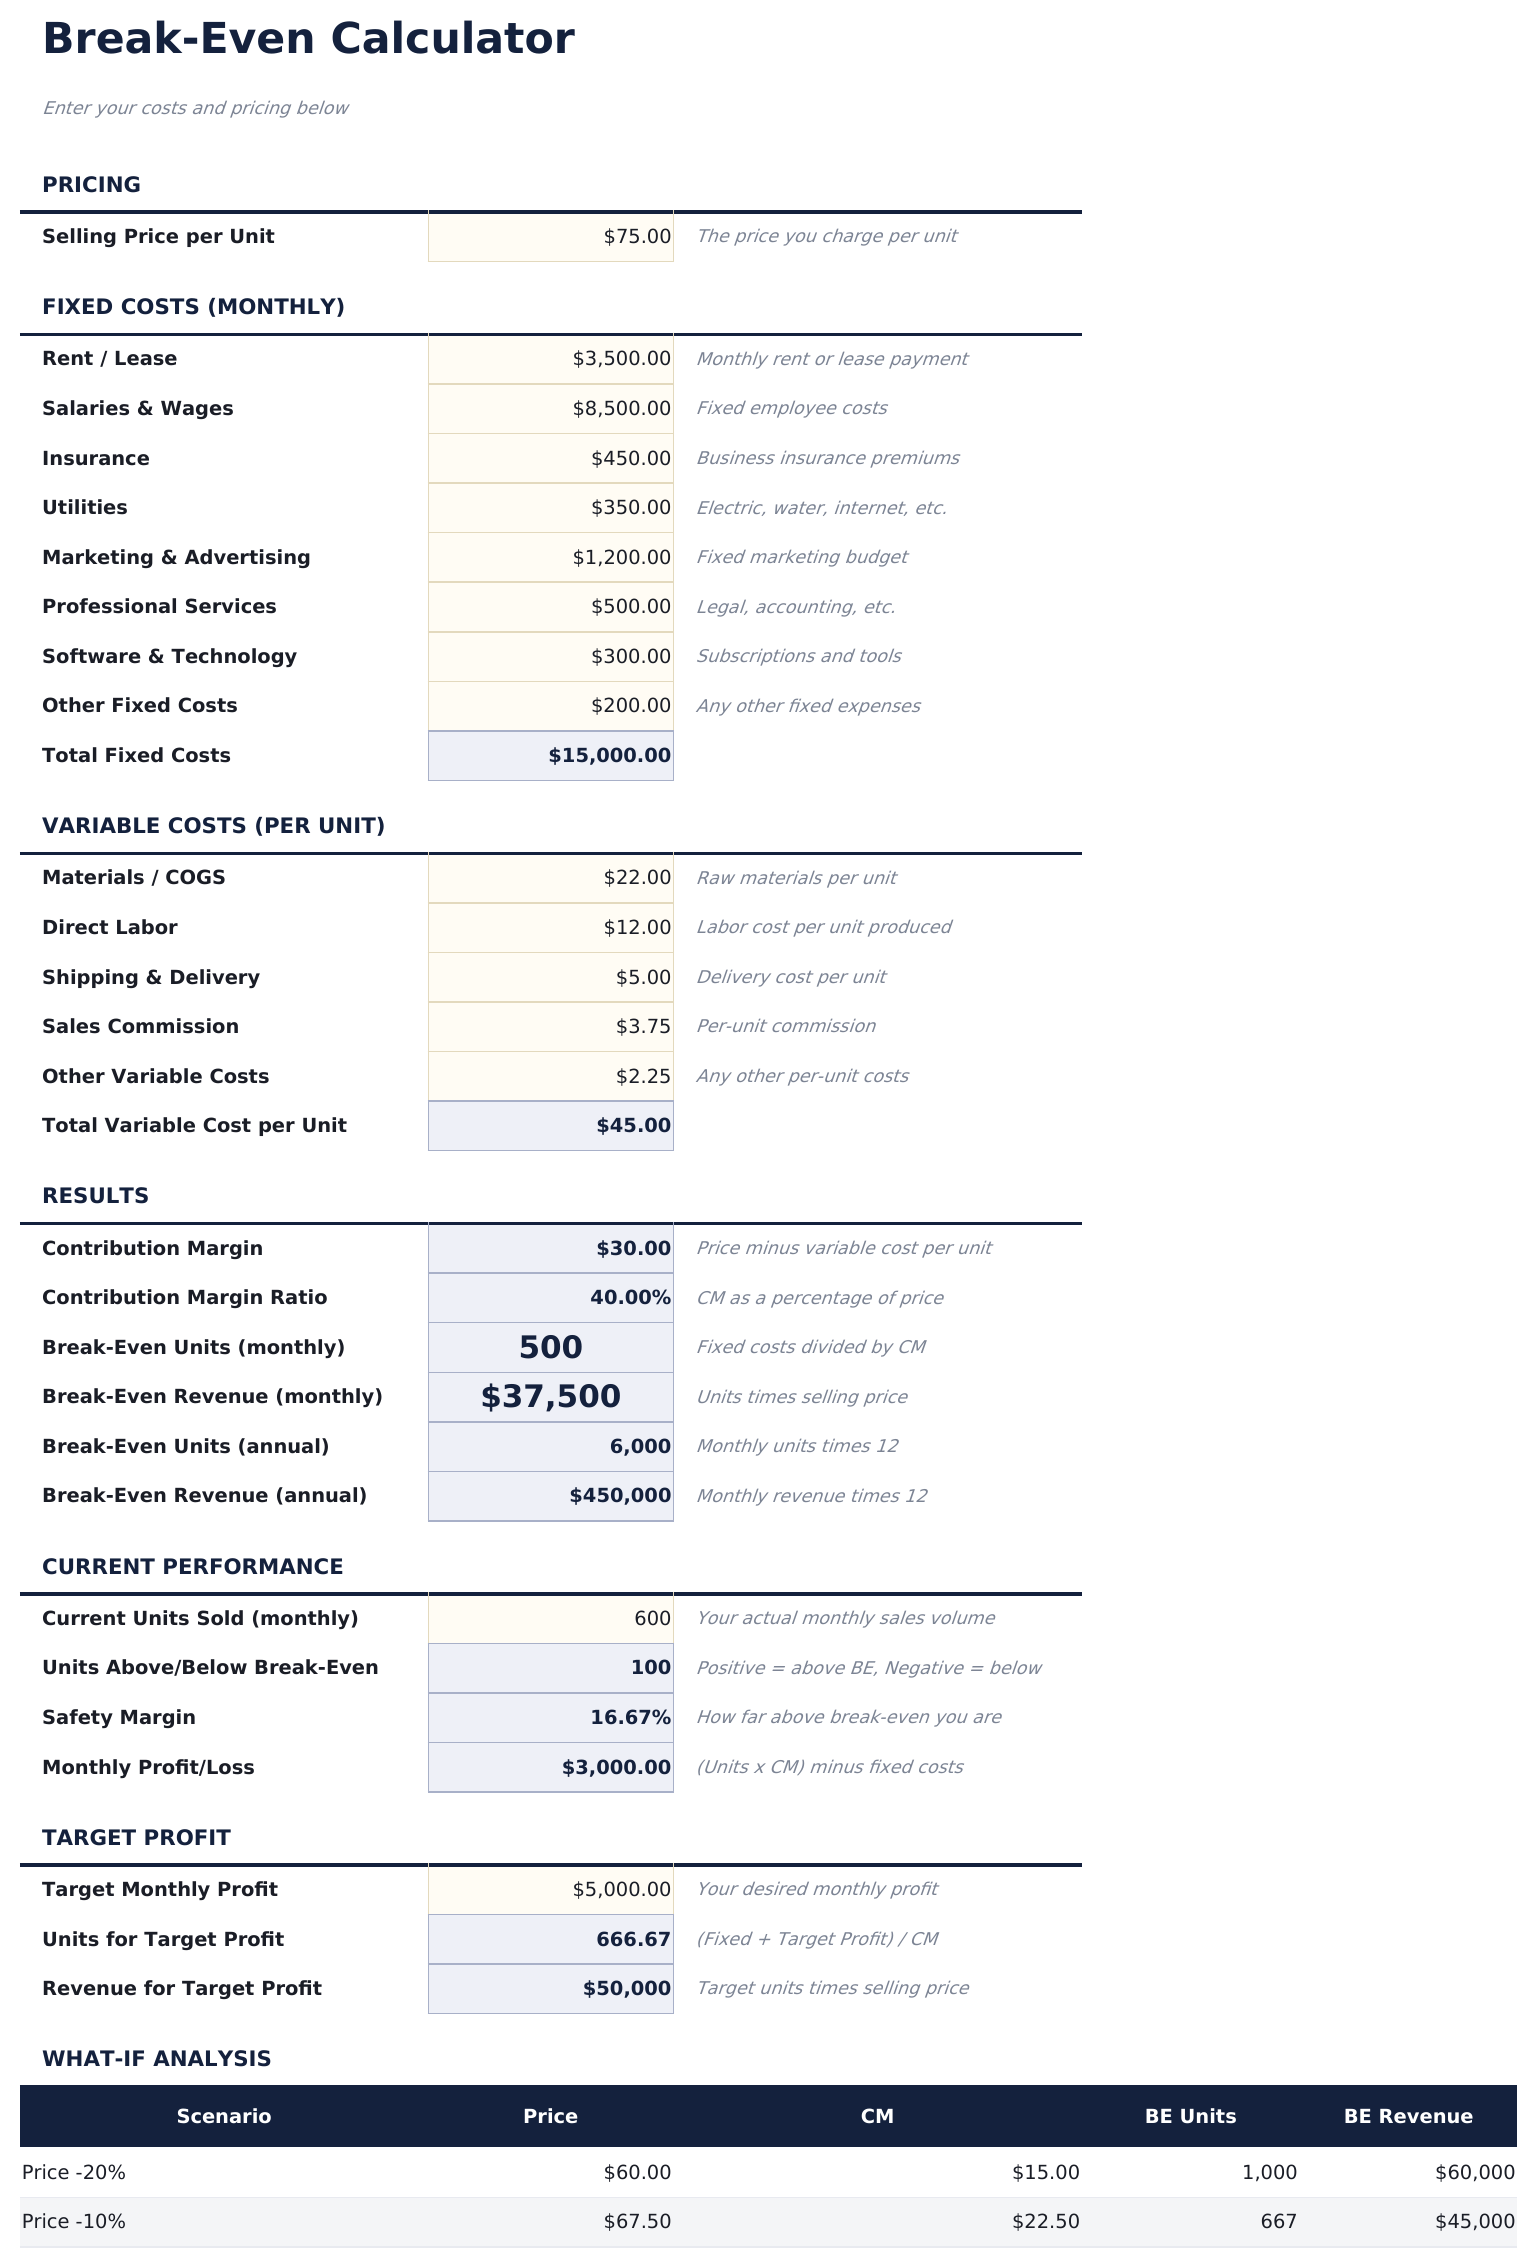
- Einrichtungsblatt mit Eingaben fuer gesamte Fixkosten, variable Kosten pro Stueck und Verkaufspreis pro Stueck
- Break-Even-Berechnungen fuer Stueckzahl und Umsatz, die sich automatisch aktualisieren, wenn Sie Kosten- oder Preiseingaben aendern
- Deckungsbeitragsanalyse, die den Deckungsbeitrag pro Stueck zeigt und wie jeder Verkauf zur Deckung der Fixkosten beitraegt
- Sensitivitaetsanalyse fuer Preisaenderungen mit farbcodierten Eingabefeldern, die den Break-Even bei verschiedenen Preispunkten zeigen
- Funktioniert in Microsoft Excel, Google Sheets und LibreOffice Calc ohne Einrichtung
Vorschau
Sehen Sie, was in dieser Vorlage enthalten ist
So verwenden Sie diese Break-Even-Analyse-Vorlage
Fixkosten eingeben
Geben Sie die gesamten Fixkosten ein - Miete, Gehaelter, Versicherung und andere Ausgaben, die sich nicht mit dem Absatzvolumen aendern.
Variable Kosten eingeben
Fuegen Sie die variablen Kosten pro Stueck hinzu - Material, Arbeit und andere Kosten, die mit jedem verkauften Stueck steigen.
Verkaufspreis festlegen
Geben Sie den Verkaufspreis pro Stueck ein. Der Deckungsbeitrag (Preis minus variable Kosten) wird automatisch berechnet.
Break-Even-Punkt ablesen
Das Dashboard zeigt den Break-Even in Stueck und Euro - das genaue Absatzvolumen, das zur Deckung aller Fix- und variablen Kosten erforderlich ist.
Customer Reviews
What Our Customers Say
"If I get half as good at handling my finances as you are at customer service, this'll be the best $26 I've spent lately."
"Great tool! Simplifies financial planning without the hassle of complex spreadsheets."
"I recently purchased your super convenient spreadsheet, it really helps me!"
"They're great and super intuitive. Thank you!"
Erstellt von Claude AI. Verfeinert von uns.
Wir verwenden Claude AI, um jede Vorlage nach gründlicher Recherche zu entwerfen. Dann greift unser Team ein. Wir verfeinern das Layout, testen jede Formel auf Herz und Nieren, beheben Grenzfälle und polieren das Design, bis es sich anfühlt wie etwas, das wir selbst verwenden würden. Die KI bringt uns 80 % ans Ziel. Die letzten 20 % sind rein menschliches Urteilsvermögen.
Häufig gestellte Fragen
Was ist der Deckungsbeitrag?
Der Deckungsbeitrag ist der Verkaufspreis minus variable Kosten pro Stueck. Er zeigt, wie viel jeder Verkauf zur Deckung der Fixkosten beitraegt.
Was, wenn ich mehrere Produkte verkaufe?
Verwenden Sie einen gewichteten Durchschnitt von Verkaufspreis und variablen Kosten ueber Ihren Produktmix. Der Break-Even-Punkt gilt fuer das gemischte Produkt.
Wie nutze ich die Sensitivitaetsanalyse?
Aendern Sie die Verkaufspreiseingabe, um zu sehen, wie sich der Break-Even-Punkt bei verschiedenen Preisniveaus verschiebt. Niedrigere Preise erfordern mehr Einheiten zum Break-Even.
Werden Steuern beruecksichtigt?
Nein. Die Break-Even-Analyse deckt nur Kosten ab. Der Break-Even-Punkt ist dort, wo der Umsatz die Gesamtkosten vor jeglicher Steuerberuecksichtigung erreicht.
Wie öffne ich diese Vorlage in Google Sheets?
Laden Sie die .xlsx-Datei auf Google Drive hoch und öffnen Sie sie mit Google Sheets. Alle Formeln und Formatierungen bleiben erhalten.
Weitere Essentials-Vorlagen: Unternehmensfinanzen
Highlights:
Auf der Suche nach Premium-Tabellenvorlagen?
Unsere kostenpflichtigen Vorlagen umfassen erweiterte mehrseitige Dashboards, native Excel-Diagramme und laufende Aktualisierungen.
Holen Sie sich stattdessen jede Ultimate-Vorlage
Alle 58 Ultimate-Vorlagen in einem Kauf für $299 - $1,102 Wert, Sie behalten $803.