Analyse du seuil de rentabilité Modèle Essentials
Calculez le seuil de rentabilité où le chiffre d'affaires couvre tous les coûts. Saisissez les coûts fixes, les coûts variables et les prix pour connaître le volume de ventes requis.
Ce qui est inclus
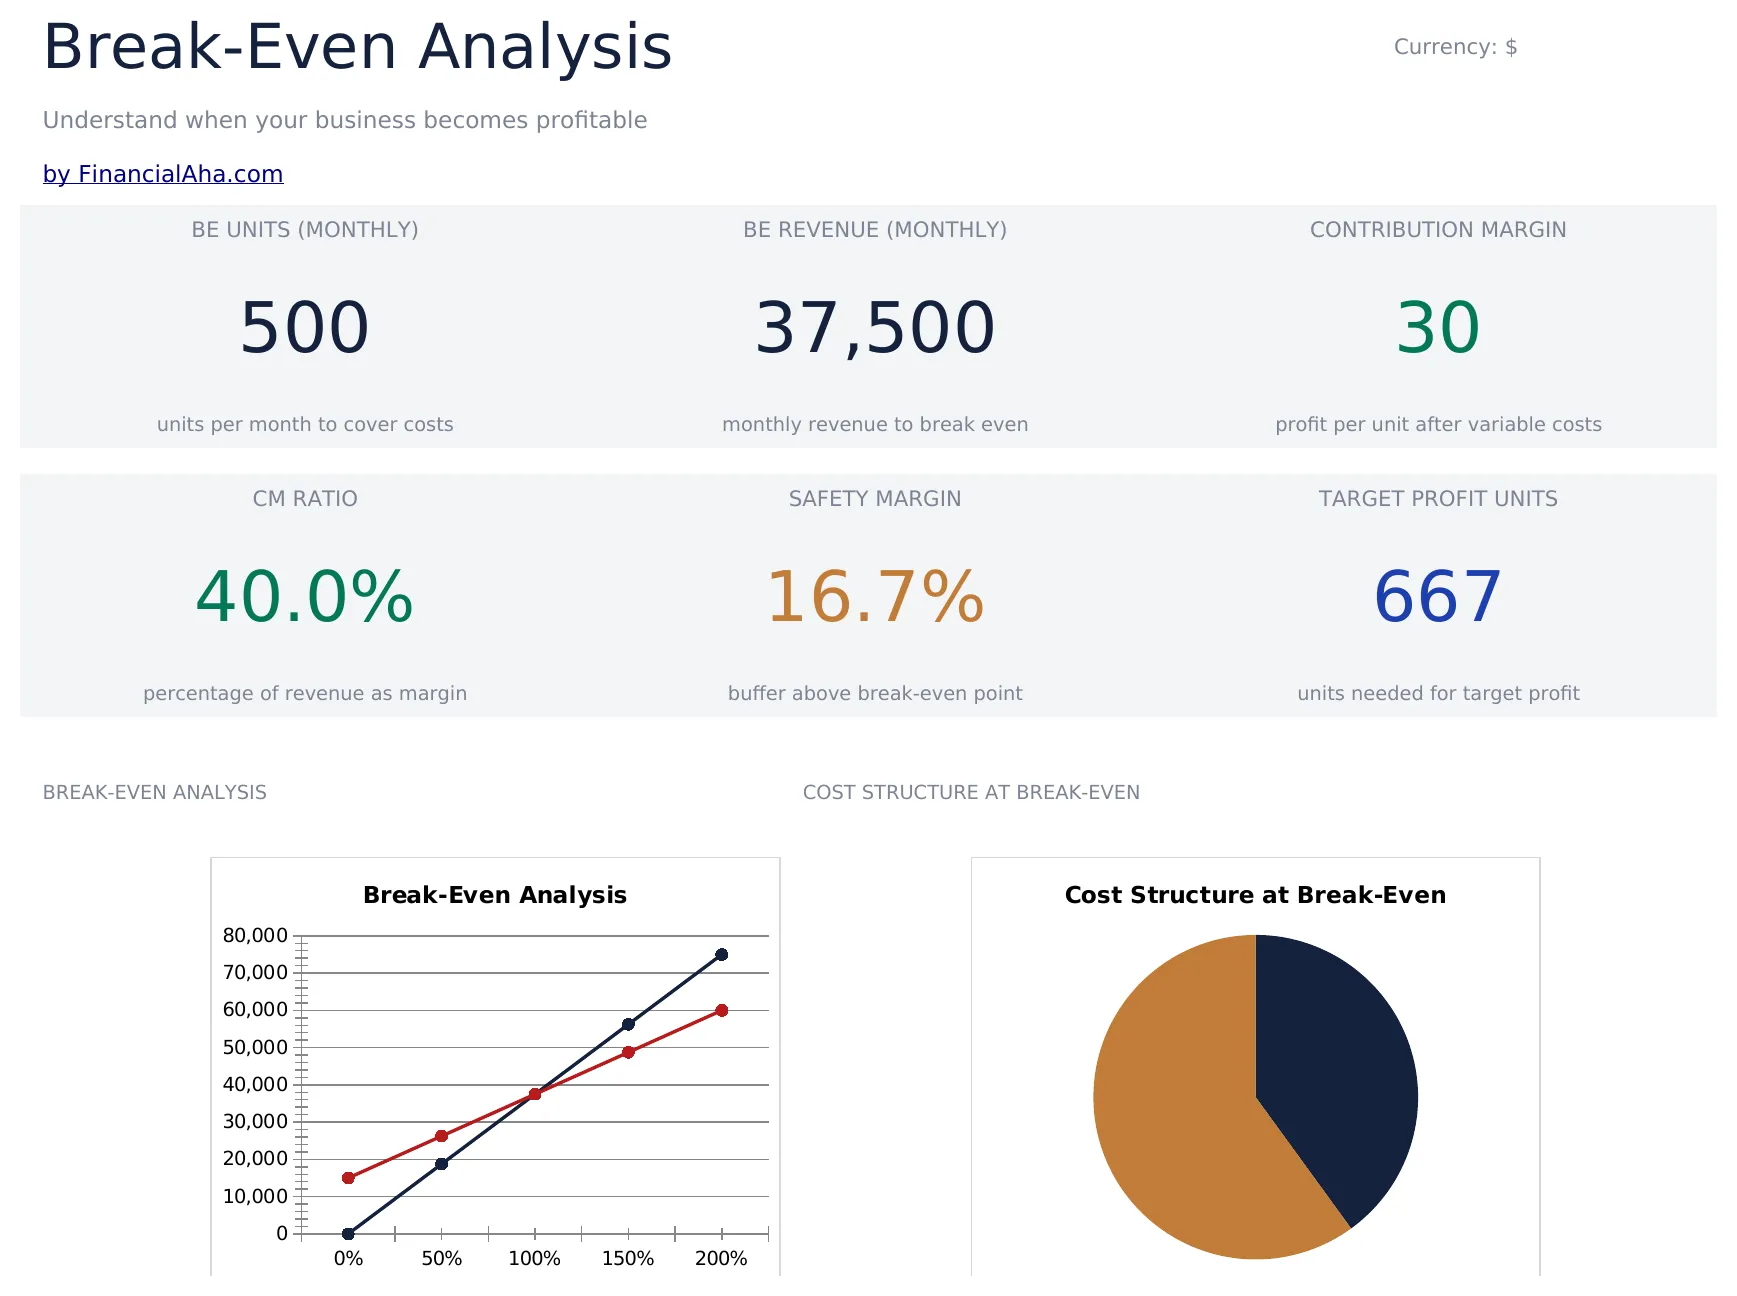
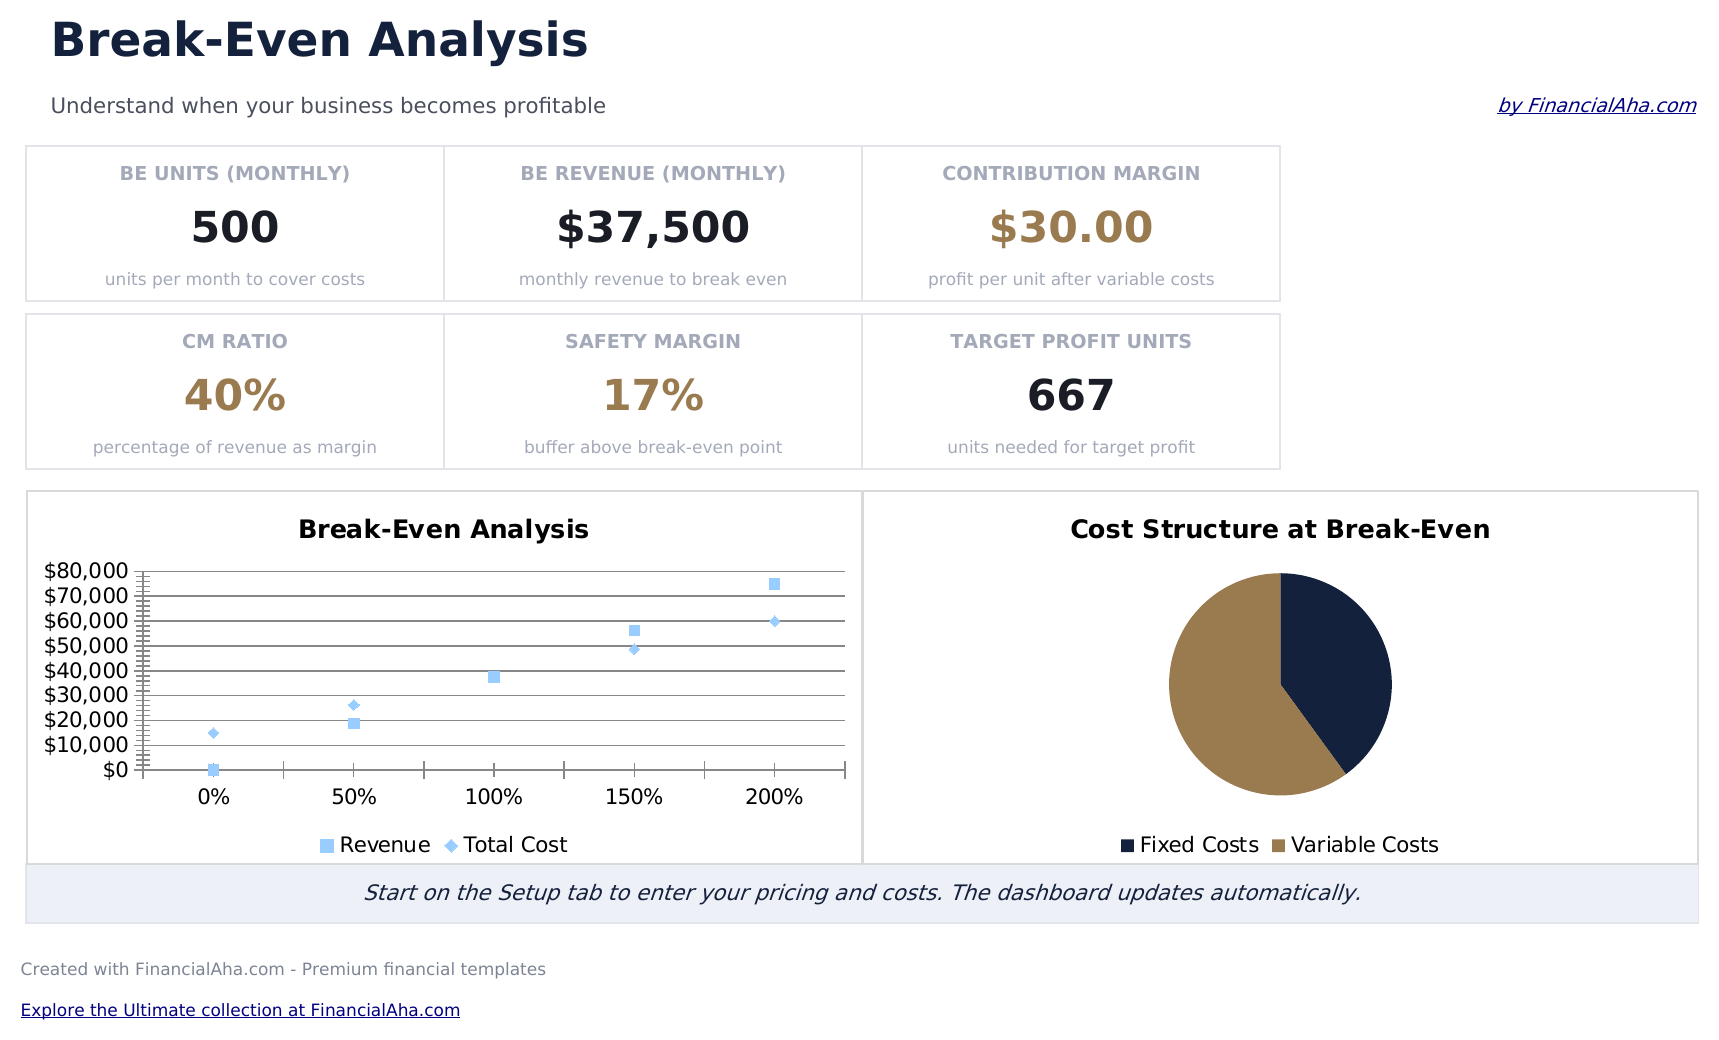
- Tableau de bord affichant le seuil de rentabilité avec le nombre exact d'unités et le montant nécessaires pour couvrir tous les coûts
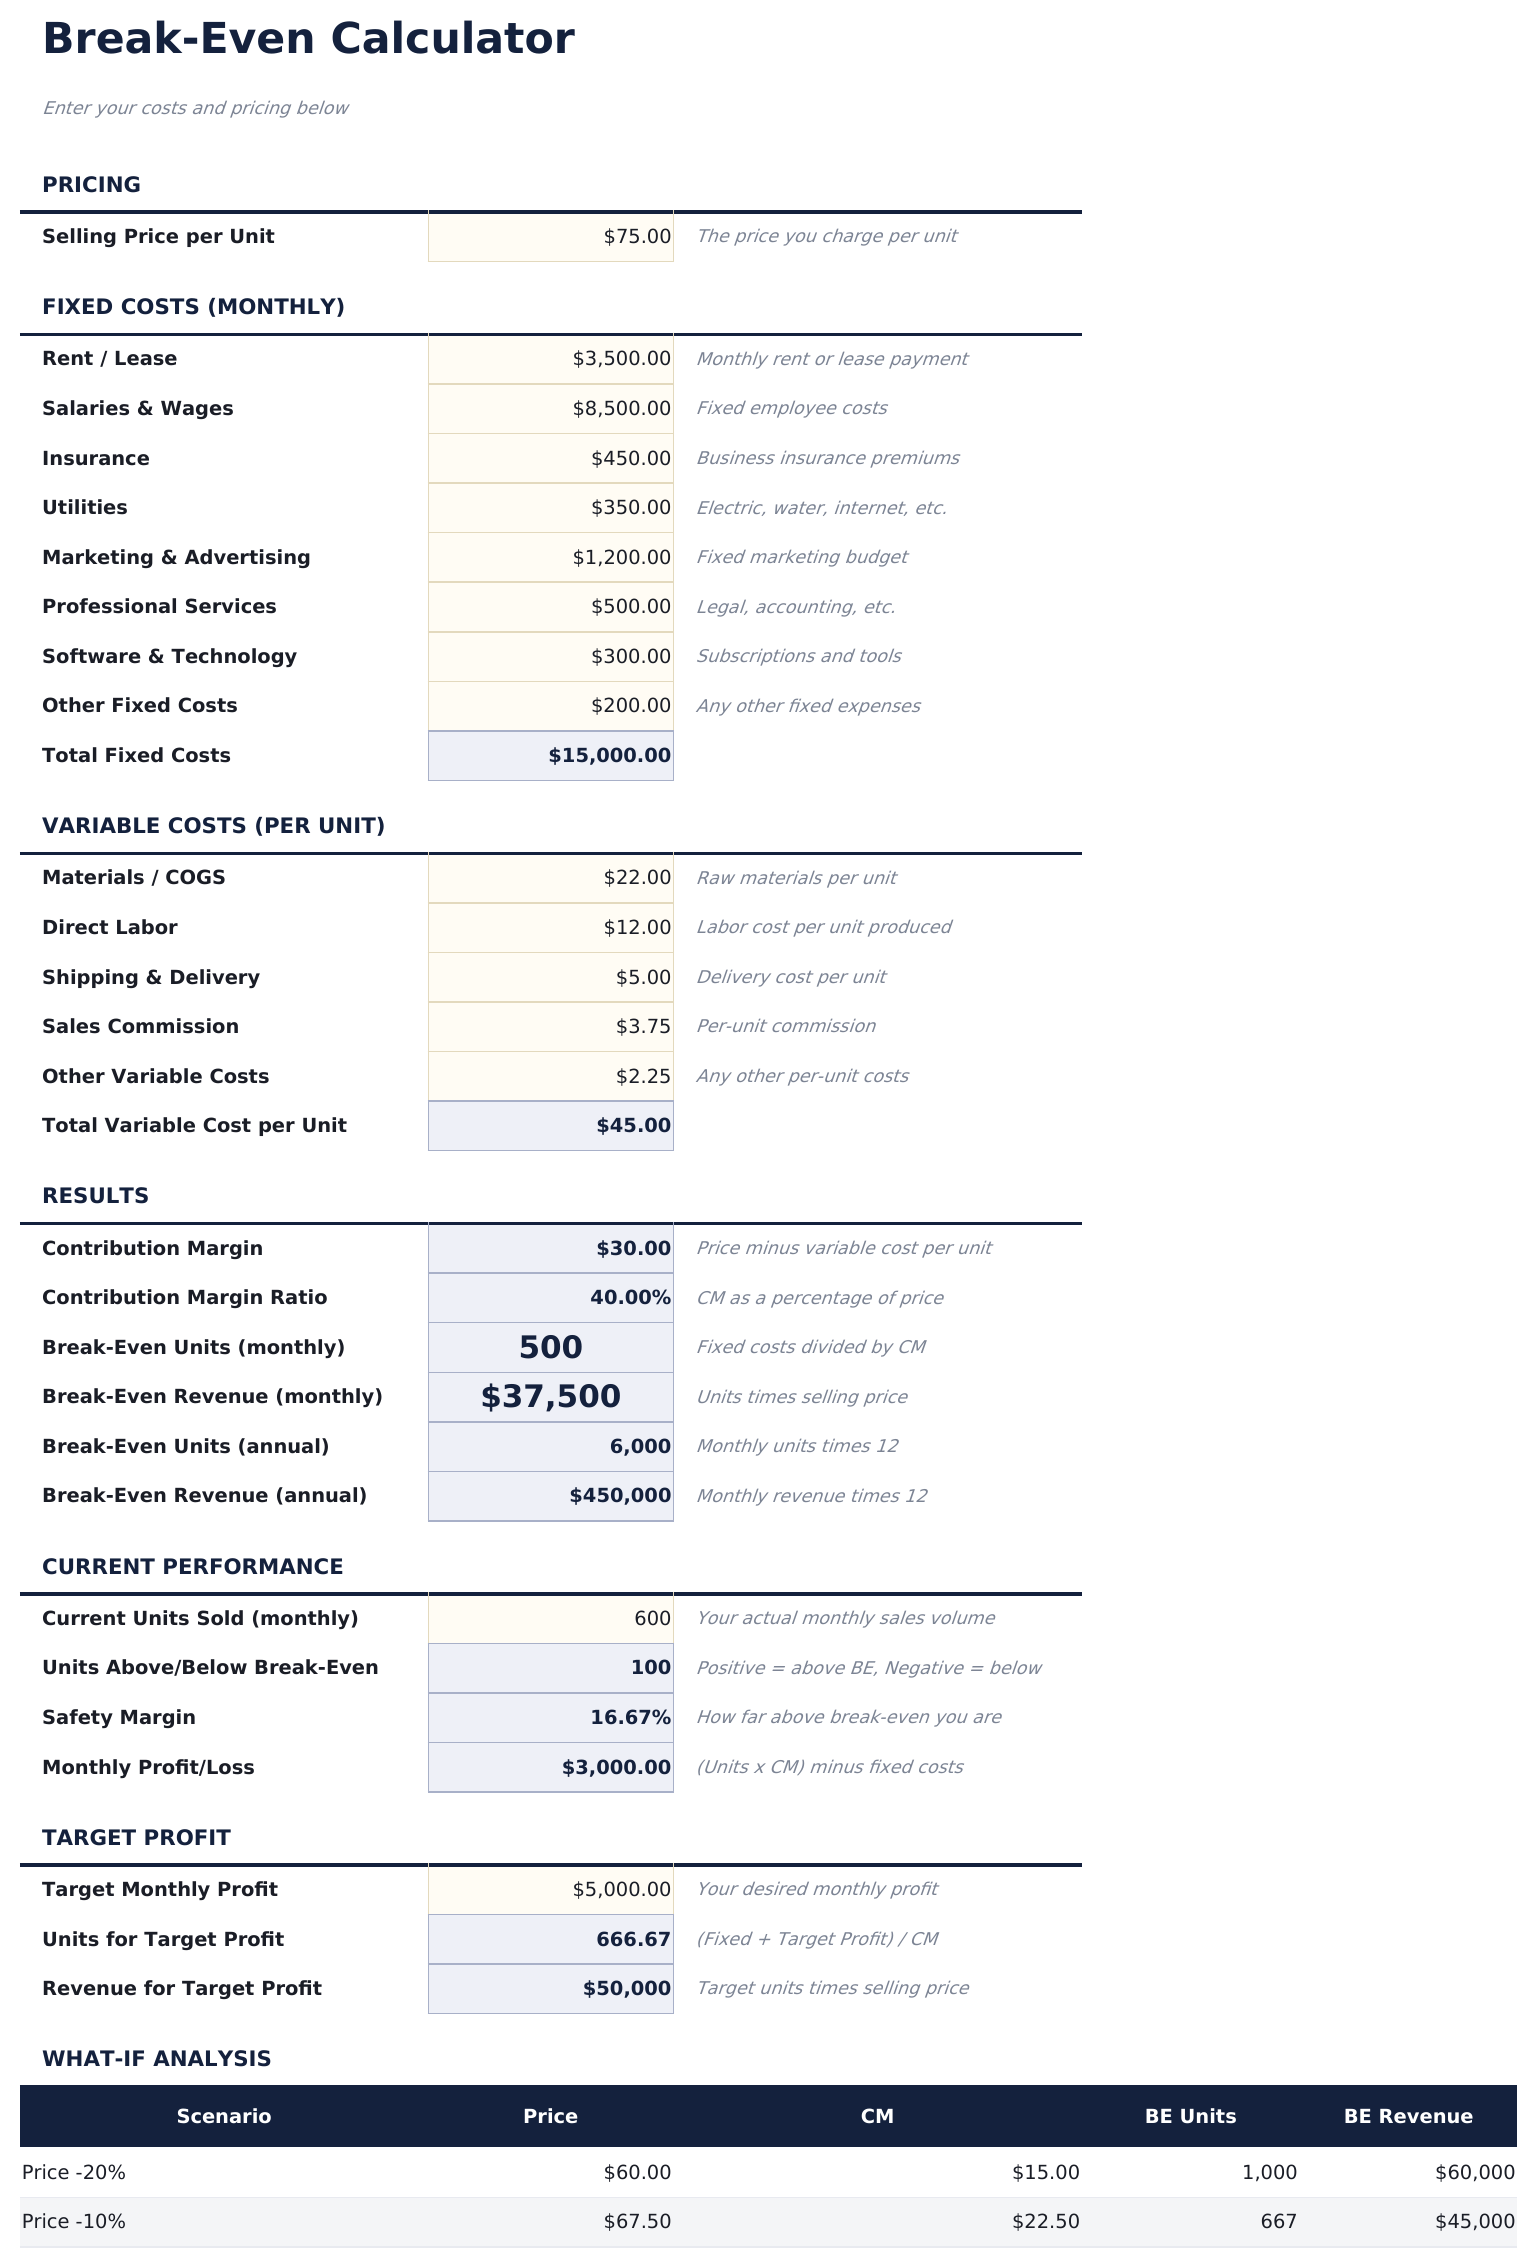
- Feuille de configuration avec saisie des coûts fixes totaux, du coût variable unitaire et du prix de vente unitaire
- Calculs du seuil de rentabilité en unités et en chiffre d'affaires qui se mettent à jour automatiquement lorsque vous modifiez les coûts ou les prix
- Analyse de la marge de contribution montrant la marge unitaire et comment chaque vente contribue à couvrir les coûts fixes
- Analyse de sensibilité aux variations de prix avec cellules de saisie colorées montrant le seuil de rentabilité à différents niveaux de prix
- Fonctionne dans Microsoft Excel, Google Sheets et LibreOffice Calc sans aucune configuration requise
Aperçu
Découvrez le contenu de ce modèle
Comment utiliser ce modèle Analyse du seuil de rentabilité
Saisissez les coûts fixes
Entrez les coûts fixes totaux - loyer, salaires, assurance et autres dépenses qui ne varient pas avec le volume de ventes.
Saisissez les coûts variables
Ajoutez le coût variable unitaire - matériaux, main-d'œuvre et autres coûts qui augmentent avec chaque unité vendue.
Définissez le prix de vente
Saisissez le prix de vente unitaire. La marge de contribution (prix moins coût variable) se calcule automatiquement.
Lisez le seuil de rentabilité
Le tableau de bord affiche le seuil de rentabilité en unités et en montant - le volume de ventes exact nécessaire pour couvrir tous les coûts fixes et variables.
Customer Reviews
What Our Customers Say
"If I get half as good at handling my finances as you are at customer service, this'll be the best $26 I've spent lately."
"Great tool! Simplifies financial planning without the hassle of complex spreadsheets."
"I recently purchased your super convenient spreadsheet, it really helps me!"
"They're great and super intuitive. Thank you!"
Créés par Claude AI. Perfectionnés par nos soins.
Nous utilisons Claude AI pour rédiger chaque modèle, après une recherche approfondie. Puis notre équipe prend le relais. Nous affinons la mise en page, testons chaque formule en conditions réelles, corrigeons les cas limites et peaufinons le design jusqu'à obtenir un résultat que nous utiliserions nous-mêmes. L'IA nous amène à 80 %. Les 20 % restants, c'est du jugement humain.
Questions fréquentes
Qu'est-ce que la marge de contribution ?
La marge de contribution est le prix de vente moins le coût variable unitaire. Elle représente la part de chaque vente qui contribue à couvrir les coûts fixes.
Et si je vends plusieurs produits ?
Utilisez un prix de vente moyen pondéré et un coût variable moyen pondéré sur votre gamme de produits. Le seuil de rentabilité s'applique au produit combiné.
Comment utiliser l'analyse de sensibilité ?
Modifiez le prix de vente pour voir comment le seuil de rentabilité évolue à différents niveaux de prix. Des prix plus bas nécessitent plus d'unités pour atteindre le seuil de rentabilité.
Cela tient-il compte des impôts ?
Non. L'analyse du seuil de rentabilité ne couvre que les coûts. Le seuil de rentabilité est le point où le chiffre d'affaires égale les coûts totaux avant toute considération fiscale.
Comment ouvrir ce fichier dans Google Sheets ?
Importez le fichier .xlsx dans Google Drive, puis ouvrez-le avec Google Sheets. Toutes les formules et la mise en forme seront conservées.
Plus de modèles Essentials Finance d'entreprise
Points Clés :
Vous recherchez des modèles de tableurs premium ?
Nos modèles payants incluent des tableaux de bord multi-feuilles avancés, des graphiques Excel natifs et des mises à jour régulières.
Privé et sécurisé
Vos données financières restent sur votre appareil. Nous ne les voyons jamais.
En savoir plus →Obtenez plutôt tous les modèles Ultimate
Les 58 modèles Ultimate en un seul achat pour $299 - valeur de $1,102, vous économisez $803.