Modello di Confronto Costi Modello Essentials
Confronta i costi tra opzioni diverse - piani assicurativi, servizi, prodotti o fornitori. Presenta le caratteristiche e i prezzi fianco a fianco.
Cosa include
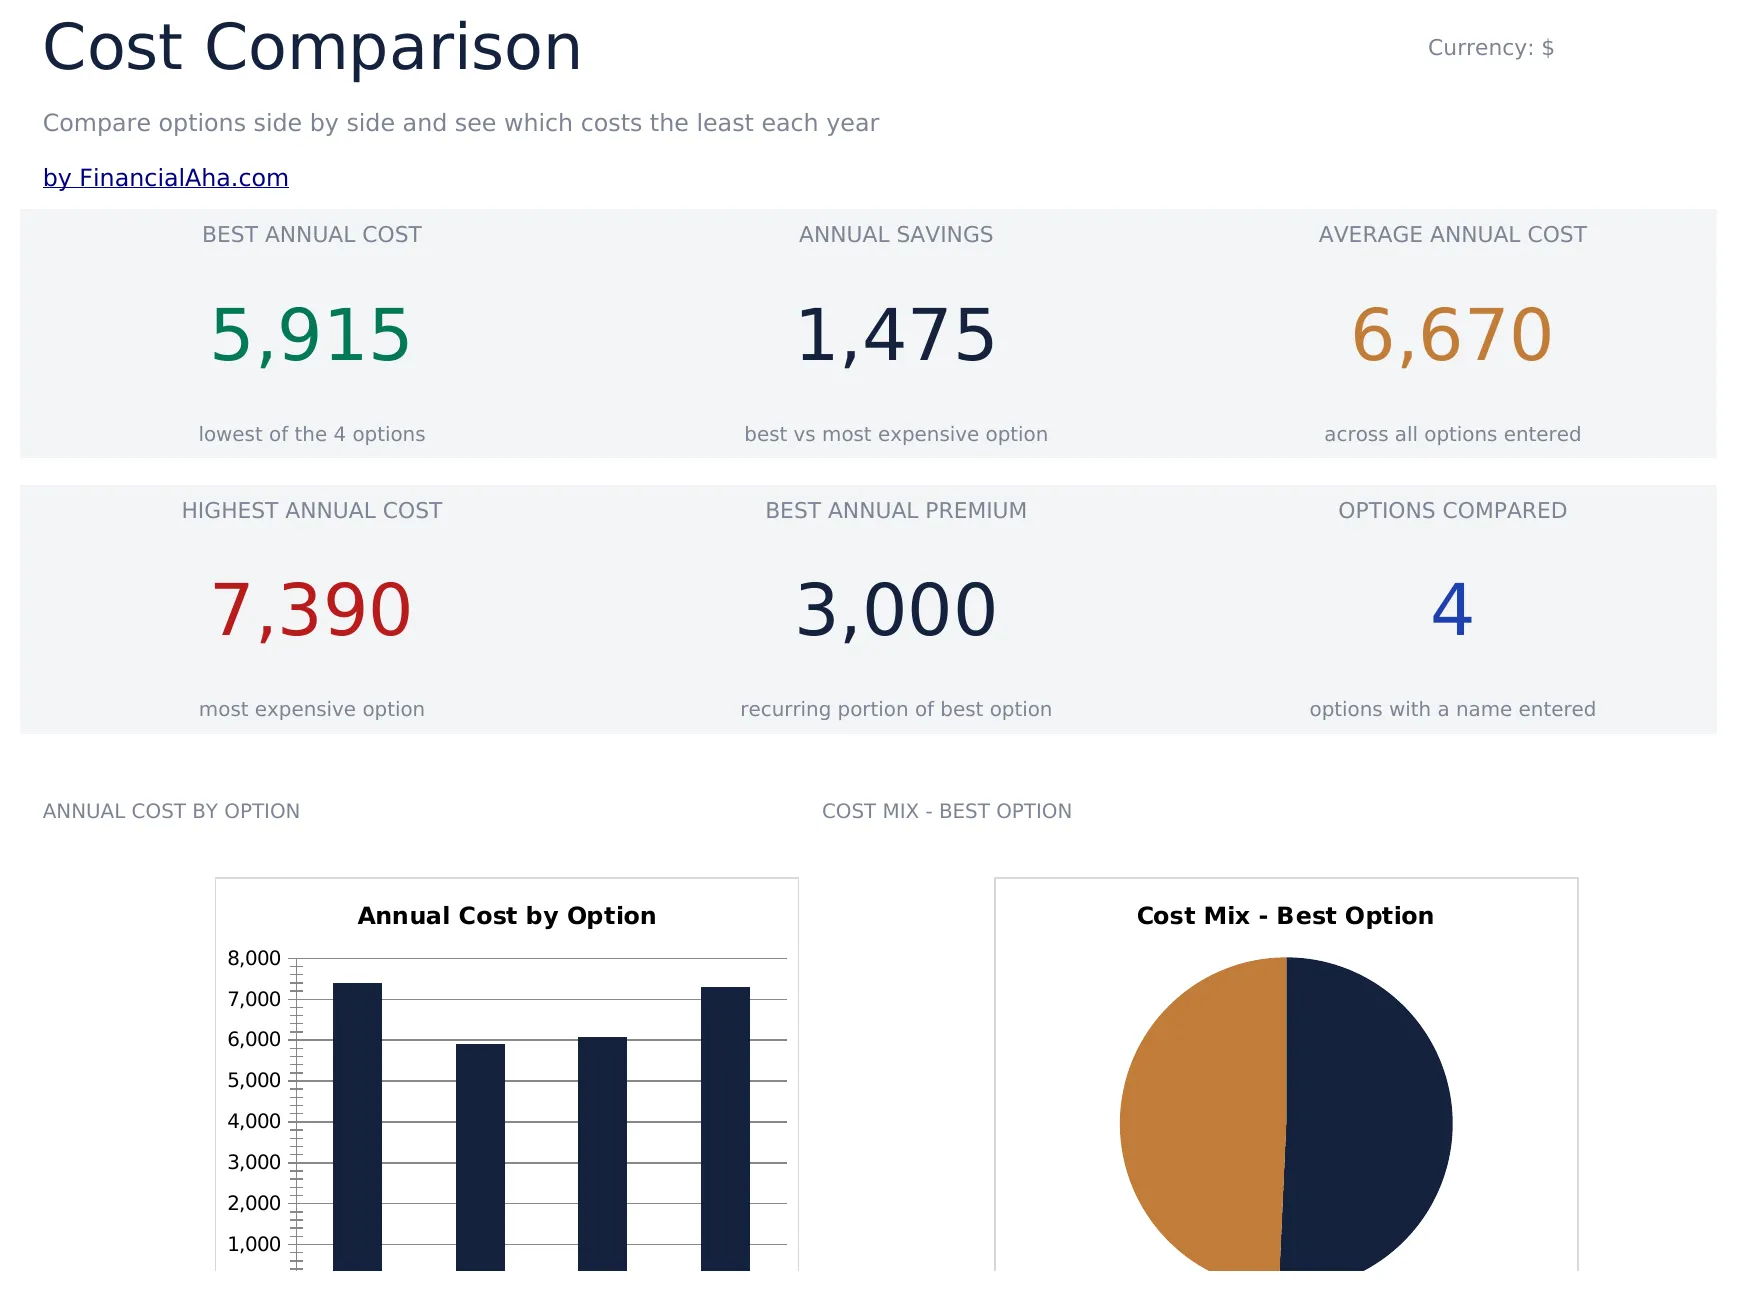
- Dashboard con riepilogo del confronto che evidenzia l'opzione meno costosa e le differenze di prezzo totali
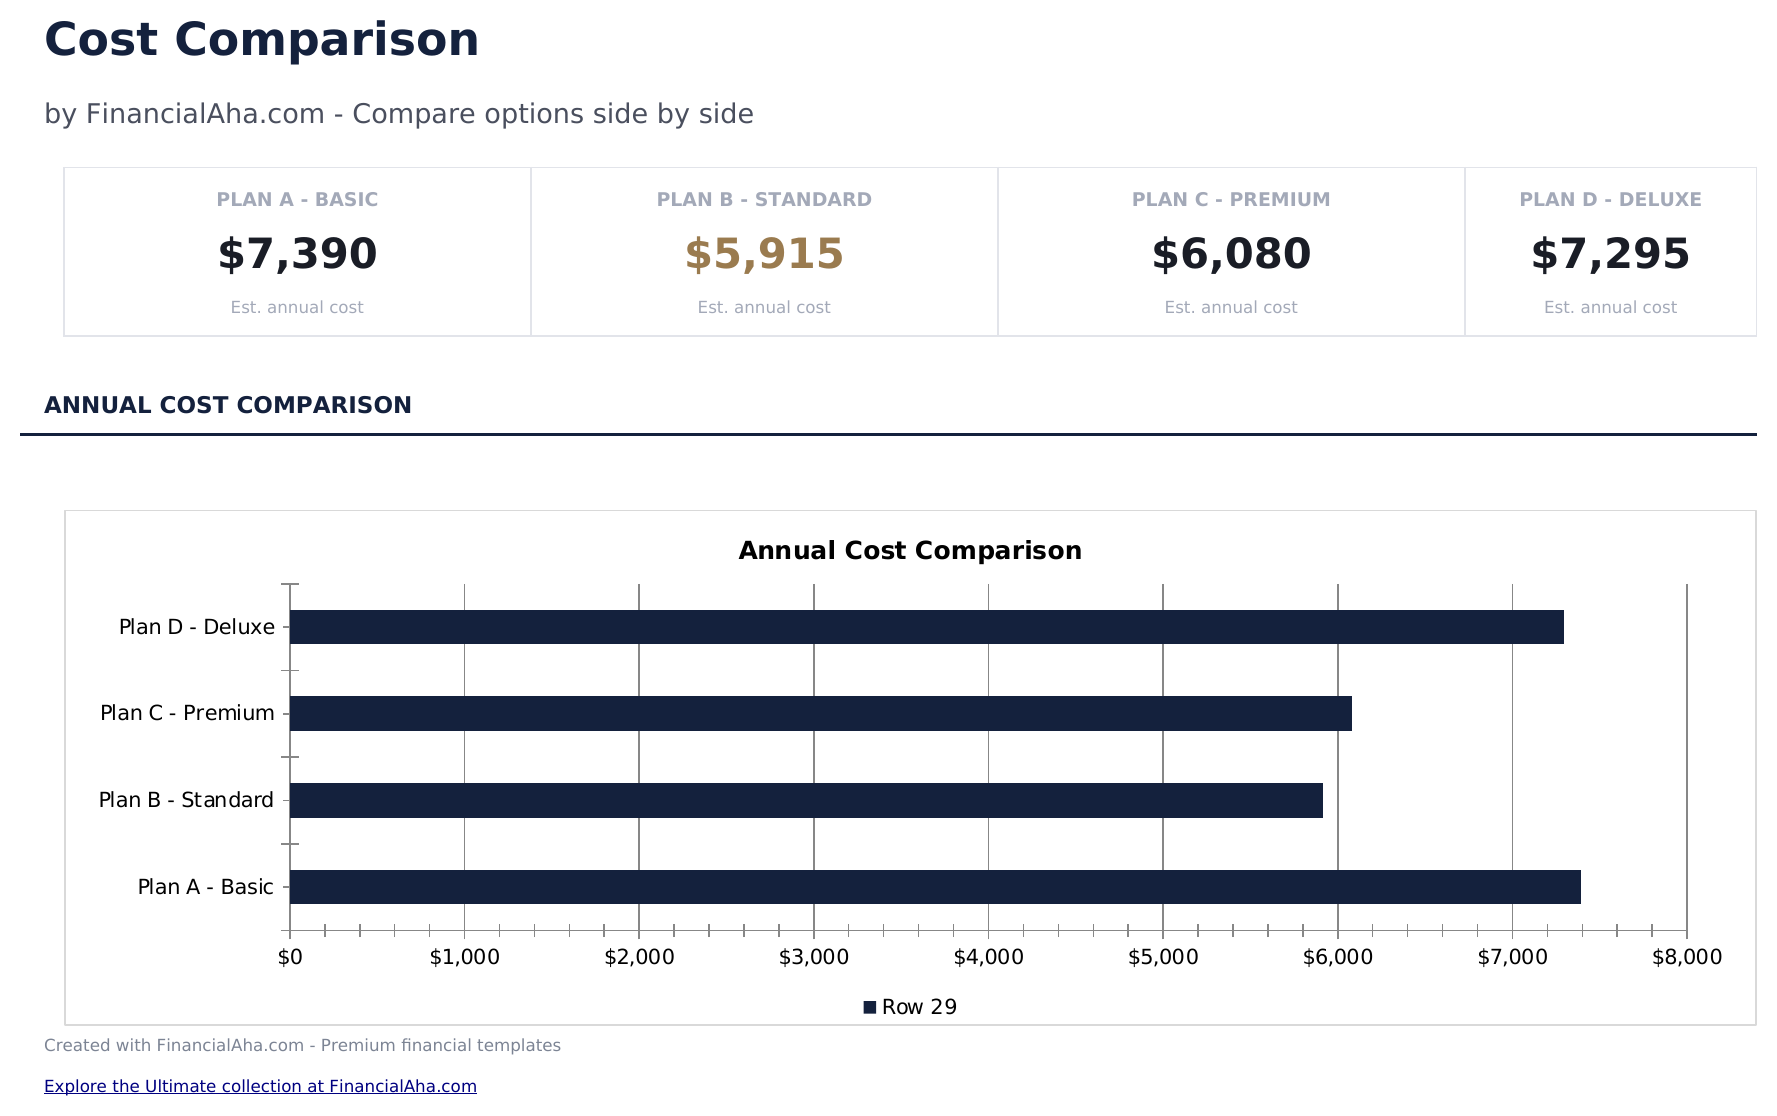
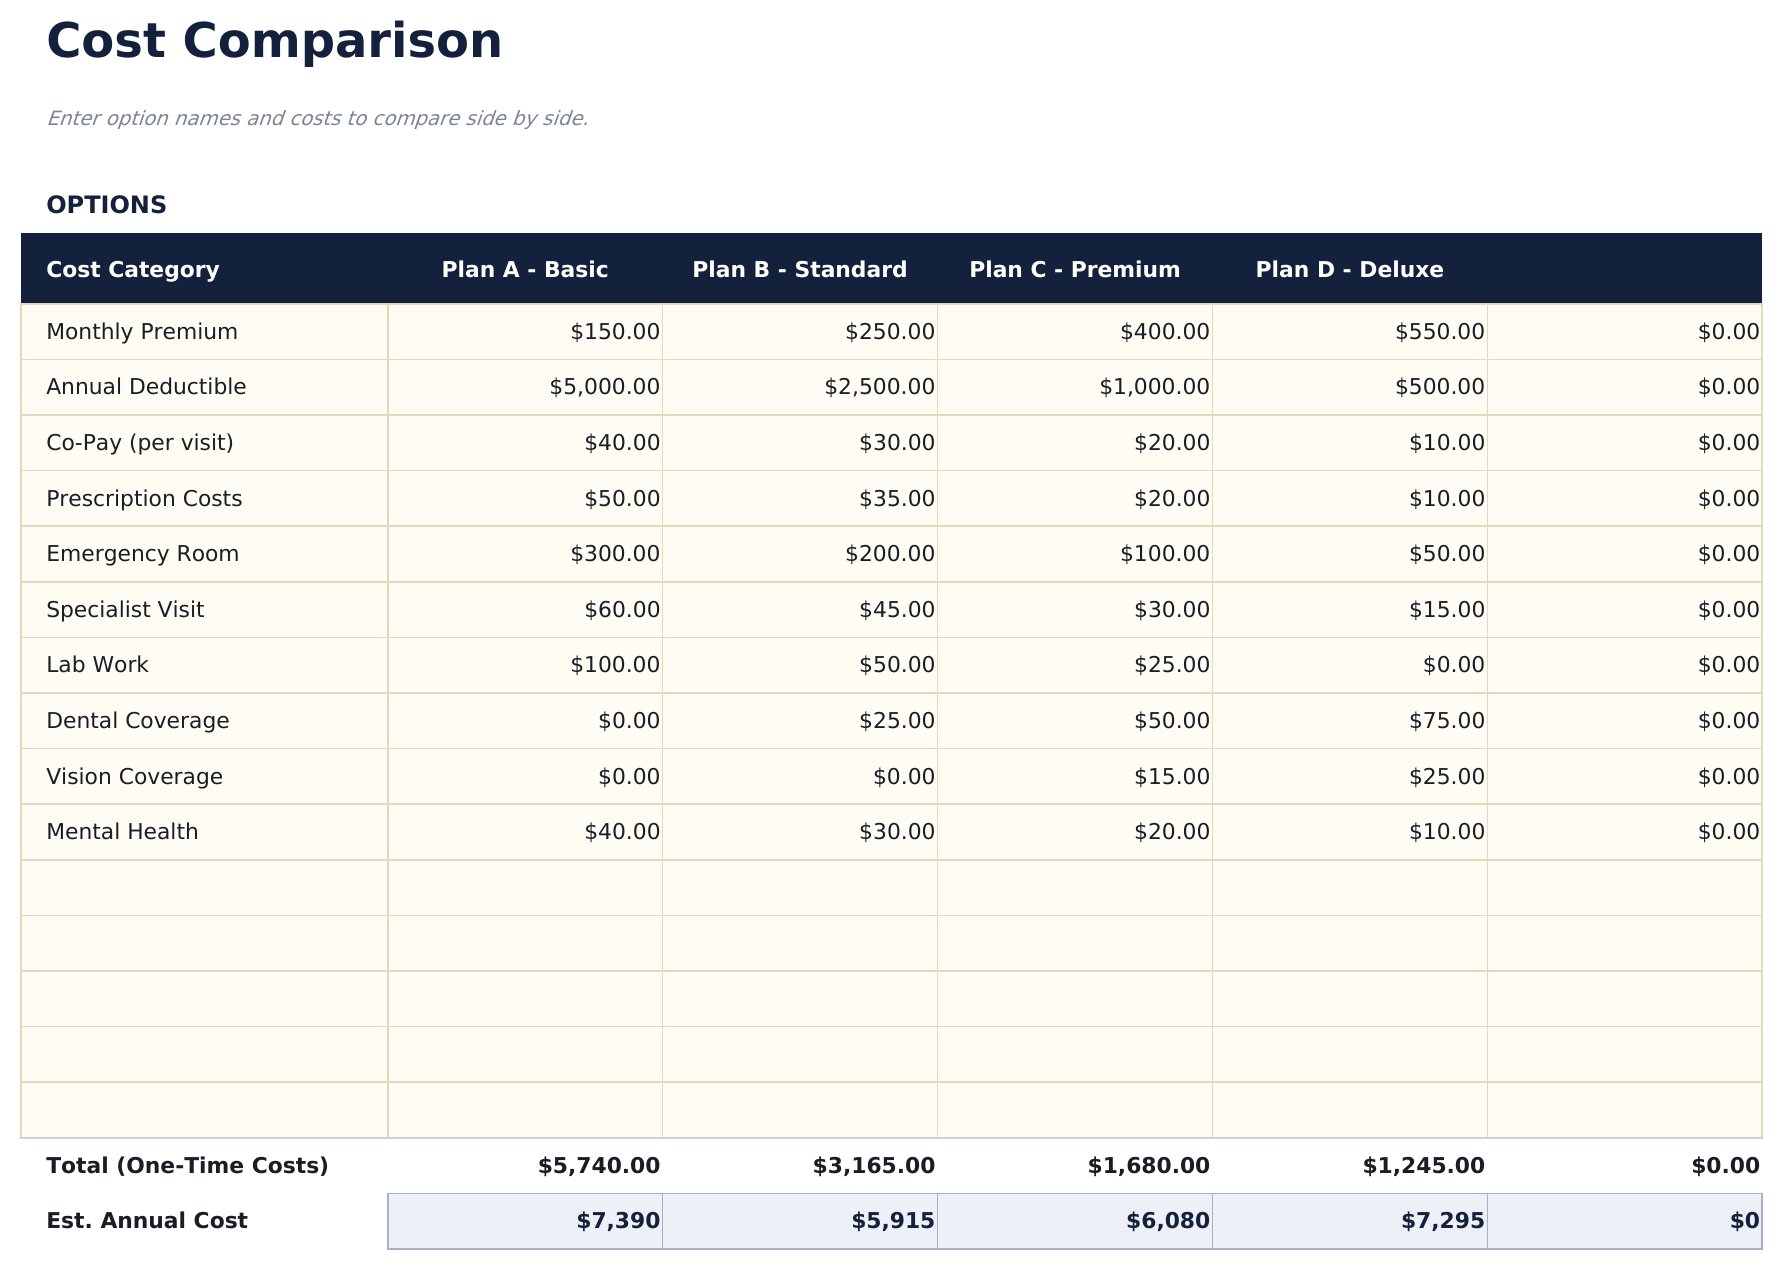
- Layout di confronto affiancato con colonne per fino a quattro opzioni e righe per ogni componente di costo
- Dettaglio dei costi per funzionalità o categoria, incluse quote mensili, costi annuali, spese di attivazione e costi extra
- Calcoli del costo totale per opzione con somma automatica e differenza rispetto all'alternativa più economica
- Opzione di punteggio ponderato e celle con codice colore per classificare le opzioni al di là delle sole considerazioni di prezzo
- Funziona con Microsoft Excel, Google Sheets e LibreOffice Calc senza alcuna configurazione iniziale
Anteprima
Scopri cosa contiene questo modello
Come usare questo modello Modello di Confronto Costi
Inserisci le opzioni da confrontare
Assegna un nome a fino a quattro opzioni nelle colonne - piani assicurativi, servizi, prodotti o qualsiasi elemento che stai valutando.
Aggiungi i componenti di costo
Elenca ogni fattore di costo come riga - quota mensile, costo annuale, spesa di attivazione e qualsiasi extra. Inserisci il prezzo per ogni opzione.
Rivedi i totali
Il modello somma tutti i componenti di costo per opzione e mette in evidenza automaticamente il totale più basso.
Considera i criteri non legati al prezzo
Usa la sezione del punteggio ponderato per classificare le opzioni in base a funzionalità, qualità e altri fattori che vanno oltre il semplice prezzo.
Customer Reviews
What Our Customers Say
"If I get half as good at handling my finances as you are at customer service, this'll be the best $26 I've spent lately."
"Great tool! Simplifies financial planning without the hassle of complex spreadsheets."
"I recently purchased your super convenient spreadsheet, it really helps me!"
"They're great and super intuitive. Thank you!"
Creati da Claude AI. Perfezionati da noi.
Utilizziamo Claude AI per creare ogni modello, dopo una ricerca approfondita. Poi interviene il nostro team. Miglioriamo il layout, testiamo ogni formula, correggiamo i casi limite e rifiniamo il design fino a ottenere qualcosa che useremmo noi stessi. L'AI ci porta all'80%. L'ultimo 20% è tutto giudizio umano.
Domande frequenti
Quante opzioni posso confrontare?
Il modello supporta fino a quattro opzioni affiancate. Per un numero maggiore di opzioni, aggiungi colonne aggiuntive seguendo lo stesso formato.
Posso confrontare servizi invece di prodotti?
Sì. Il modello funziona per qualsiasi cosa abbia dei costi - piani assicurativi, abbonamenti software, fornitori di servizi o prodotti fisici.
Come funziona il punteggio ponderato?
Assegna pesi a criteri come prezzo, qualità e funzionalità. Ogni opzione riceve un punteggio per ciascun criterio e il totale ponderato le classifica al di là del semplice costo.
Gestisce i prezzi mensili e annuali?
Aggiungi righe sia per i costi mensili che per quelli annuali. I totali sommeranno tutte le righe, così puoi vedere i costi combinati per qualsiasi periodo di tempo inserito.
Come posso aprirlo in Google Sheets?
Carica il file .xlsx su Google Drive, poi aprilo con Google Sheets. Tutte le formule e la formattazione saranno conservate.
Altri modelli Essentials Patrimonio Netto e Pianificazione Finanziaria
Punti Chiave:
Cerchi modelli di fogli di calcolo premium?
I nostri modelli a pagamento includono dashboard multi-foglio avanzate, grafici nativi Excel e aggiornamenti continui.
Privato e sicuro
I tuoi dati finanziari restano sul tuo dispositivo. Non li vediamo mai.
Scopri di piu →Ottieni invece ogni modello Ultimate
Tutti i 58 modelli Ultimate in un unico acquisto per $299 - valore di $1,102, risparmi $803.